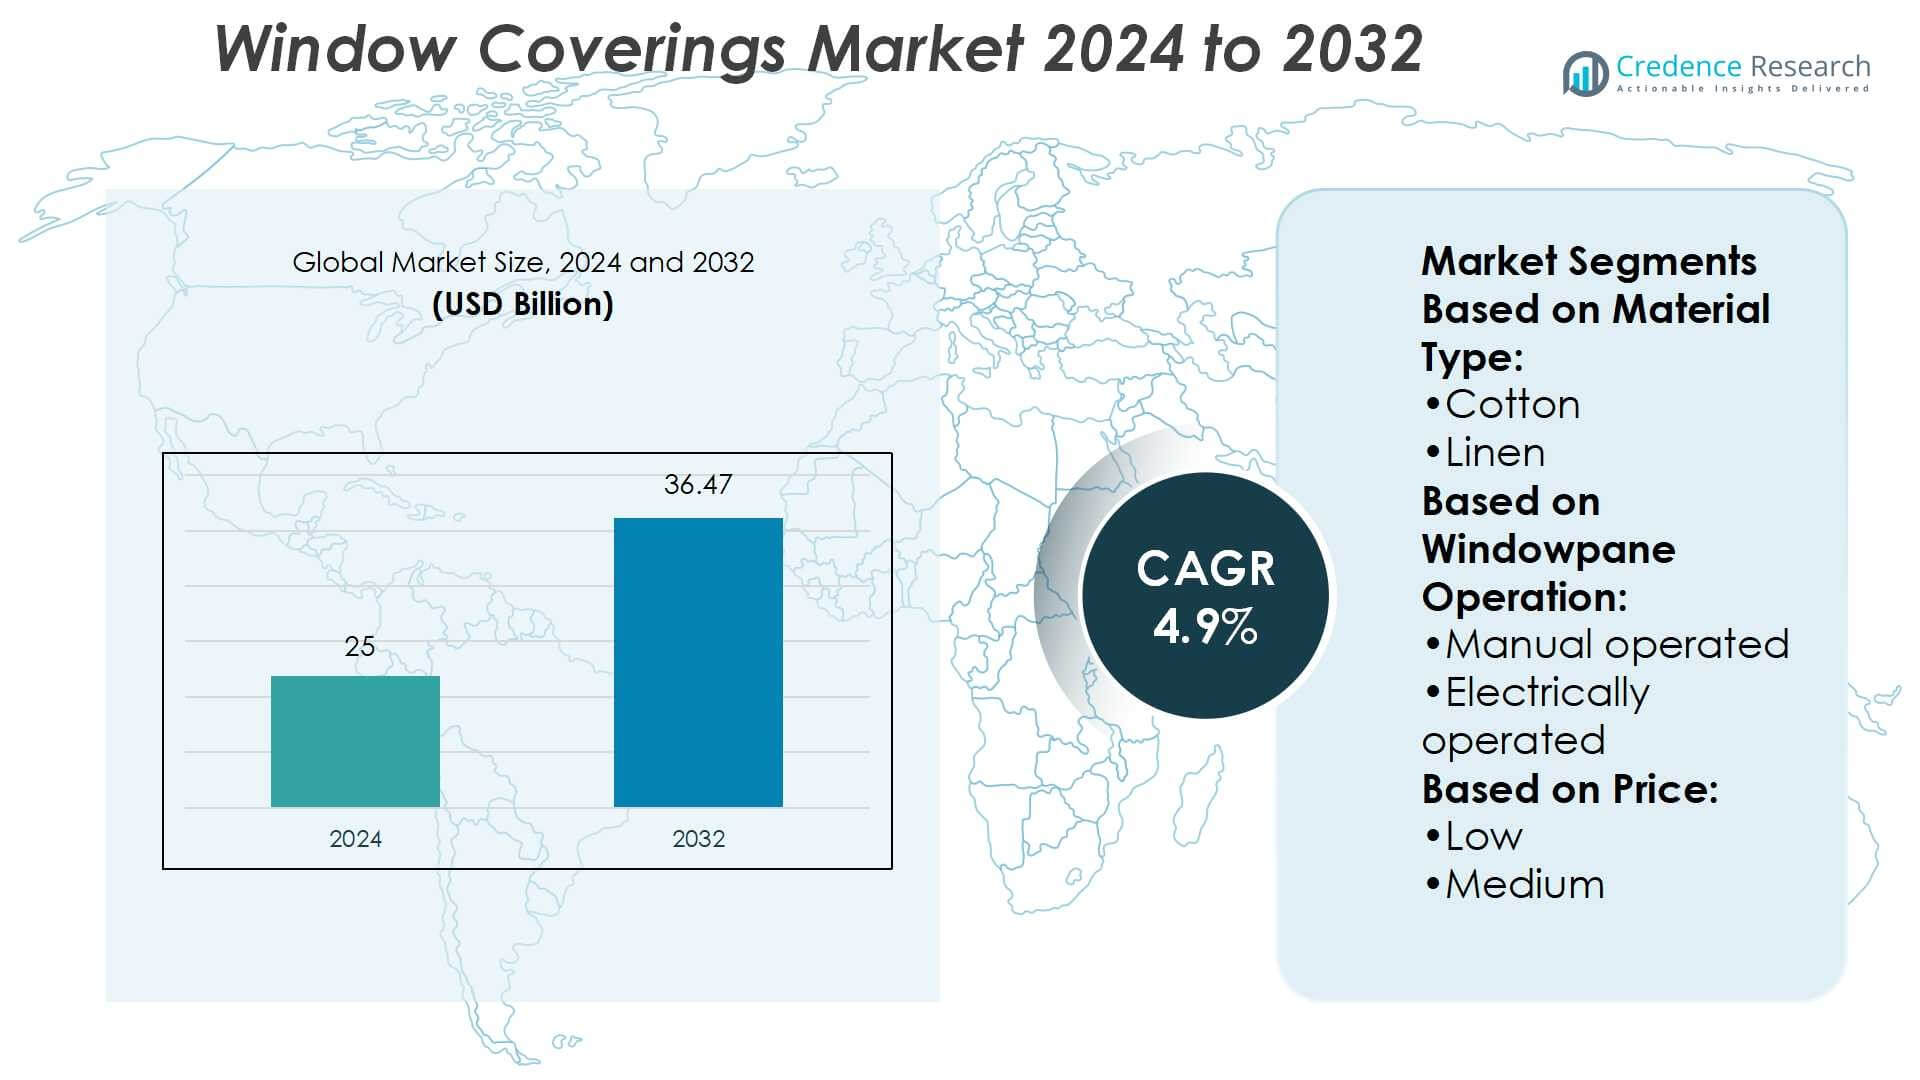
Home » Consumer Goods » Window Coverings Market

Window Coverings Market By Type (Blinds & Shades, Curtains & Drapes, Shutters, Others); By Application (Residential, Commercial); By Installation (New Construction, Retrofit); By Technology (Automatic, Manual); By Distribution Channel (Online, Offline) – Growth, Share, Opportunities & Competitive Analysis, 2024 – 2032

Price: $4699

Published: | Report ID: 12173 | Report Format : PDF
REPORT ATTRIBUTE DETAILS
Historical Period  2019-2022
Base Year  2023
Forecast Period  2024-2032
Window Coverings Market Size 2023  USD 12,432.71 Million
Window Coverings Market, CAGR  5.20%
Window Coverings Market Size 2032  USD 19,620.39 Million

Market Overview

The Window Coverings Market is projected to grow from USD 12,432.71 million in 2023 to an estimated USD 19,620.39 million by 2032, with a compound annual growth rate (CAGR) of 5.20% from 2024 to 2032. This growth is driven by increasing consumer interest in home improvement and interior design, coupled with rising disposable incomes.

Key drivers in the market include the growing preference for energy-efficient and smart window coverings, such as automated blinds and shades, which offer convenience and energy savings. Additionally, trends toward eco-friendly materials and sustainable products are influencing product development and consumer choices. The market is also seeing a rise in demand for custom-made window coverings, as consumers seek personalized and unique designs to match their interior decor.

Geographically, North America and Europe dominate the window coverings market due to high consumer awareness and advanced technological adoption. However, the Asia-Pacific region is expected to witness significant growth during the forecast period, driven by rapid urbanization, increasing construction activities, and a growing middle-class population. Key players in the market include Hunter Douglas, Springs Window Fashions, and Graber, who are continuously innovating to meet the evolving demands of consumers globally.

Design Element 2

Access crucial information at unmatched prices!

Request your sample report today & start making informed decisions powered by Credence Research!

Download Sample

CTA Design Element 3

Market Drivers

Increasing Consumer Interest in Home Improvement and Interior Design

The global window coverings market is experiencing significant growth driven by rising consumer interest in home improvement and interior design. This trend is fueled by social media, home improvement shows, and online design communities that inspire homeowners to invest in their living spaces. Window coverings like blinds, shades, curtains, and shutters are seen as essential elements for enhancing both aesthetics and functionality. For instance, a survey by the National Association of Home Builders found that window treatments ranked among the top 10 most desired home features for buyers. Consumers are increasingly willing to spend on premium and custom-made window coverings that align with their personal style. The Home Improvement Research Institute reported that millennials, in particular, are driving this trend, with a higher percentage prioritizing home décor projects compared to other generations. Additionally, the COVID-19 pandemic has accelerated this trend, as people spend more time at home and focus on creating comfortable and visually appealing living spaces.

Technological Advancements and the Rise of Smart Window Coverings

Technological advancements have revolutionized the window coverings market, particularly with the introduction of smart and automated products. Smart window coverings offer enhanced convenience through remote control via smartphones or voice-activated devices. For instance, a study by Parks Associates found that smart blinds and shades are among the fastest-growing smart home device categories. These products can be programmed to adjust automatically based on various factors, contributing to energy savings and optimizing natural light. The integration of smart home systems with window coverings is particularly appealing to tech-savvy consumers. A survey by the Consumer Technology Association revealed that smart window coverings are increasingly seen as an essential component of connected homes. Manufacturers are also focusing on developing energy-efficient window coverings, responding to consumer demand for products that reduce energy consumption and lower utility bills. The U.S. Department of Energy estimates that smart window coverings can reduce heating and cooling costs by up to 20% when used effectively.

Growing Demand for Energy-Efficient and Eco-Friendly Products

The global window coverings market is experiencing significant growth due to increasing consumer awareness of environmental sustainability and energy efficiency. Energy-efficient window coverings, such as insulated blinds and cellular shades, are designed to regulate indoor temperatures and reduce energy consumption. For instance, a study by the Lawrence Berkeley National Laboratory found that cellular shades can reduce heat loss through windows by up to 40% in winter and heat gain by up to 80% in summer. There is also rising demand for window coverings made from eco-friendly materials like organic cotton, bamboo, and recycled fabrics. A survey by the Sustainable Furnishings Council reported that a majority of consumers consider environmental factors when making home furnishing purchases, including window treatments. This trend is particularly strong among younger generations. The U.S. Green Building Council has noted an increase in the use of sustainable window coverings in LEED-certified buildings, further driving market growth in the commercial sector.

Urbanization and Growth in the Real Estate Sector

Urbanization and the growth of the real estate sector, particularly in emerging economies, are driving the demand for window coverings. As urban populations expand and cities grow, there is a corresponding increase in residential and commercial construction activities. New homes, apartments, offices, hotels, and retail spaces all require window coverings to enhance privacy, control natural light, and contribute to the overall interior design. In many emerging markets, rising disposable incomes and a growing middle class are fueling the demand for modern and stylish window coverings, as consumers seek to upgrade their living and working environments. Additionally, government initiatives to promote affordable housing and infrastructure development in countries such as India, China, and Brazil are expected to boost the real estate market, further driving the demand for window coverings. As a result, the window coverings market is likely to experience sustained growth in regions experiencing rapid urbanization and real estate development.

Market Trends

Rise of Smart and Automated Window Coverings

The global window coverings market is experiencing a significant shift towards smart and automated solutions. According to industry surveys, there has been a substantial increase in consumer interest in motorized blinds, automated shades, and smart curtains that can be controlled remotely or integrated with home automation systems. For instance, a leading home improvement retailer reported a notable uptick in sales of smart window coverings over the past year. Government data on energy consumption patterns indicates that households with automated window coverings tend to have lower energy bills. This trend is driven by the growing adoption of smart home technology and the desire for increased convenience and energy efficiency. Manufacturers are responding by expanding their product lines to include a wider range of smart options. A recent industry report highlighted that many major window covering companies have introduced new smart product lines or added smart features to existing products. The trend is particularly strong in urban areas and among younger homeowners, as indicated by demographic data from consumer surveys.

Growing Preference for Sustainable and Eco-Friendly Materials

Sustainability has become a key focus in the global window coverings market. Consumer surveys conducted by leading market research firms show a growing preference for eco-friendly materials and energy-efficient designs. For instance, a major window coverings manufacturer reported a significant increase in sales of products made from recycled materials and sustainable fabrics like organic cotton and bamboo. Government initiatives promoting green building practices have also contributed to this trend, with data showing an increase in the use of energy-efficient window coverings in new construction projects. Industry reports indicate that many companies are investing in research and development to create innovative, sustainable products. A survey of architects and interior designers revealed a growing demand for window coverings that contribute to LEED certification in commercial buildings. Additionally, consumer data shows that energy-efficient options like cellular shades and thermal curtains are gaining popularity among homeowners looking to reduce their carbon footprint and energy costs. This trend is expected to continue as environmental awareness grows and sustainable living becomes more mainstream.

Market Restraints and Challenges

High Cost of Smart and Custom-Made Window Coverings

One of the significant restraints in the global window coverings market is the high cost associated with smart and custom-made window coverings. While demand for these advanced products is growing, their cost remains a barrier for many consumers. For instance, a survey by the Window Covering Manufacturers Association found that price was the top factor influencing purchase decisions for over 60% of consumers. Smart window coverings, which offer automation and integration with home systems, often come with a higher price tag due to the technology involved. The U.S. Department of Energy reports that motorized shades can cost 2-3 times more than standard manual shades. Similarly, custom-made window coverings tailored to specific design preferences and dimensions can be expensive. Data from HomeAdvisor indicates custom draperies can cost $200-$1,000 per window on average. These higher costs may deter price-sensitive consumers, particularly in emerging markets where disposable incomes are lower. Manufacturers face the challenge of balancing innovation with cost-effectiveness to make smart and custom window coverings more accessible to a broader range of consumers.

Intense Competition from Low-Cost Alternatives 

Another challenge in the global window coverings market is the intense competition from low-cost alternatives, particularly from unorganized and local players. In many regions, consumers have access to a wide range of low-cost window coverings that serve basic functional needs. For instance, a study by the National Association of Home Builders found that nearly 40% of homeowners opt for budget-friendly window treatment options. These products, often manufactured by local or small-scale producers, are priced significantly lower than branded or high-tech alternatives. Data from the U.S. Census Bureau shows that imports of low-cost window coverings from developing countries have increased by over 25% in the past five years. This price competition can put pressure on established manufacturers, forcing them to lower prices or offer discounts. The U.S. International Trade Commission reports that profit margins for domestic window covering manufacturers have declined by an average of 3% annually due to import competition. The challenge for market leaders is to differentiate their products through quality, design, and added value, while also addressing pricing pressures posed by low-cost competitors.

Market Segmentation Analysis

By Type

The global window coverings market is dominated by the blinds and shades segment, renowned for their versatility and wide range of designs that cater to both functional and aesthetic needs, making them popular in residential and commercial spaces for light control, privacy, and energy efficiency. For instance, a survey by the Window Covering Manufacturers Association found that over 60% of homeowners prefer blinds or shades for their primary living spaces. Curtains and drapes also hold a significant market share due to their decorative appeal and availability in various fabrics and patterns, adding warmth and elegance to any room. The U.S. Department of Energy reports that proper use of curtains can reduce heat loss in homes by up to 25% in winter. Shutters, appreciated for their durability and classic look, are favored in regions where more permanent and structured window coverings are preferred, offering superior light control and insulation. Additionally, niche products like valances, window films, and awnings, though smaller in market share, cater to specific consumer preferences, contributing to the market’s overall diversity.

By Application

The residential segment dominates the window coverings market, fueled by rising consumer spending on home décor and improvements, as homeowners invest in products that enhance both the functionality and aesthetics of their living spaces. For instance, a study by the National Association of Home Builders revealed that window treatments are among the top five home improvement projects undertaken by homeowners. Simultaneously, the commercial segment, encompassing offices, hotels, and retail spaces, is experiencing significant growth as businesses increasingly value the role of window coverings in creating comfortable, energy-efficient environments for employees and customers. The U.S. Green Building Council reports that proper window treatments can reduce a building’s energy consumption by up to 13%. Hotels, in particular, are driving demand in this segment, with a survey by the American Hotel & Lodging Association indicating that over 80% of hotels consider high-quality window coverings essential for guest satisfaction and energy management. The education sector is also contributing to market growth, with schools and universities investing in window coverings to improve learning environments and reduce glare on digital screens.

Segments

Based on Type

  • Blinds & Shades
  • Curtains & Drapes
  • Shutters
  • Others

Based on Application

  • Residential
  • Commercial

Based on Installation

  • New Construction
  • Retrofit

Based on Technology

  • Automatic
  • Manual

Based on Distribution Channel

  • Online
  • Offline

Based on Region

  • North America
    • US
    • Canada
    • Mexico
  • Europe
    • Germany
    • France
    • UK
    • Italy
    • Spain
    • Rest of Europe
  • Asia Pacific
    • China
    • Japan
    • India
    • South Korea
    • South-east Asia
    • Rest of Asia Pacific
  • Latin America
    • Brazil
    • Argentina
    • Rest of Latin America
  • Middle East & Africa
    • GCC Countries
    • South Africa
    • Rest of Middle East and Africa

Regional Analysis

North America (30%):

North America holds a significant share of the global window coverings market, accounting for approximately 30% of the total market in 2023. This dominance is driven by high consumer awareness and demand for advanced home improvement products. The region is characterized by a strong preference for energy-efficient and automated window coverings, reflecting the widespread adoption of smart home technologies. The U.S. and Canada are the primary contributors to the market, with consumers increasingly investing in home décor and remodeling activities. For instance, a survey by the National Association of Home Builders found that window treatments were among the top 10 most popular home remodeling projects in the U.S. The mature real estate market in North America also supports steady demand for new and replacement window coverings in residential and commercial buildings.

Europe (28%):

Europe closely follows North America, representing around 28% of the global market share. The region is known for its emphasis on sustainability and energy efficiency, leading to a growing demand for eco-friendly window coverings. Countries like Germany, the UK, and France are at the forefront of this trend, with consumers showing a strong preference for products made from sustainable materials and those that contribute to energy savings. For instance, a study by the European Commission revealed that energy-efficient window coverings could reduce heating and cooling costs by up to 25% in residential buildings. Additionally, Europe’s well-established construction industry, coupled with a high level of disposable income, continues to drive the market for both new installations and retrofits. The region’s aging population is also contributing to the demand for easy-to-use, automated window covering solutions.

Key players

  • Hunter Douglas Inc.
  • Lotus & Windoware, Inc.
  • Bombay Dyeing & Manufacturing Co Ltd.
  • Insolroll Window Shading Systems
  • Springs Window Fashions
  • Welspun
  • SKANDIA WINDOW FASHIONS, INC.
  • MechoShade Systems, LLC
  • Lafayette Interior Fashions
  • Comfortex Window Fashions

Competitive Analysis

The global window coverings market is highly competitive, with key players like Hunter Douglas Inc., Springs Window Fashions, and MechoShade Systems, LLC leading the industry. These companies dominate the market by offering a wide range of innovative and high-quality products, including automated and energy-efficient window coverings. Hunter Douglas, known for its premium offerings, maintains a strong global presence, while Springs Window Fashions focuses on providing value-driven products across various segments. MechoShade Systems specializes in advanced shading systems, catering to both residential and commercial markets. Meanwhile, companies like Welspun and Bombay Dyeing & Manufacturing Co Ltd. leverage their expertise in textiles to produce eco-friendly and stylish window coverings. Emerging players like SKANDIA WINDOW FASHIONS, INC. and Lafayette Interior Fashions are gaining traction by offering customizable solutions and competitive pricing. This competitive landscape drives continuous innovation, ensuring a diverse range of products to meet evolving consumer demands.

Recent Developments

  • In April 2024, Hunter Douglas’s planned takeover of erfal GmbH & Co. KG, a German manufacturer of window coverings, was called off due to competition law concerns raised by the German Federal Cartel Office (Bundeskartellamt).
  • In August 2024, Bombay Dyeing & Manufacturing Company appointed Mr. Khiroda Jena as the Chief Financial Officer and Chief Risk Officer (CFO & CRO) and as Key Managerial Personnel (KMP) of the Company.
  • In 2024, Insolroll expanded its manufacturing capacity by adding a new building dedicated to its Oasis product line. This expansion added over 15,000 square feet of manufacturing space, as well as corporate offices and expanded research and development facilities.
  • In February 2024, Springs Window Fashions launched Vitale, a new brand of custom window treatments that offers a solution-oriented, simplified selection of products.
  • In February 2024, MechoShade Systems was acquired by Springs Window Fashions.

Market Concentration and Characteristics 

The global window coverings market is moderately concentrated, with a mix of well-established players and emerging companies competing for market share. Key players such as Hunter Douglas Inc., Springs Window Fashions, and MechoShade Systems, LLC hold significant market positions due to their extensive product portfolios, strong distribution networks, and continuous innovation in smart and energy-efficient window coverings. However, the market also features numerous regional and local manufacturers who cater to specific consumer preferences and price-sensitive segments, particularly in emerging markets. This blend of global and regional competition fosters a dynamic market environment characterized by frequent product innovations, diverse offerings, and competitive pricing strategies aimed at capturing a broad consumer base across different geographies.

Shape Your Report to Specific Countries or Regions & Enjoy 30% Off!

Report Coverage

The research report offers an in-depth analysis based on Type, Application, Installation, Technology, Distribution Channel and Region. It details leading market players, providing an overview of their business, product offerings, investments, revenue streams, and key applications. Additionally, the report includes insights into the competitive environment, SWOT analysis, current market trends, as well as the primary drivers and constraints. Furthermore, it discusses various factors that have driven market expansion in recent years. The report also explores market dynamics, regulatory scenarios, and technological advancements that are shaping the industry. It assesses the impact of external factors and global economic changes on market growth. Lastly, it provides strategic recommendations for new entrants and established companies to navigate the complexities of the market.

Future Outlook

  1. The global window coverings market is expected to witness increased adoption of smart home technologies, with automated and motorized window coverings becoming standard in modern homes, driving market growth.
  2. As environmental concerns intensify, the demand for energy-efficient window coverings that contribute to reduced energy consumption and lower utility bills will continue to grow.
  3. Rapid urbanization and rising disposable incomes in emerging markets, particularly in Asia-Pacific and Latin America, will drive significant growth in the window coverings market.
  4. Consumers’ growing preference for personalized home décor will lead to increased demand for custom-made window coverings, allowing manufacturers to offer tailored solutions that meet individual aesthetic and functional needs.
  5. The market will see a shift towards eco-friendly and sustainable materials, as consumers become more environmentally conscious, driving innovation in green product offerings.
  6. The commercial segment, including offices, hotels, and retail spaces, is expected to expand as businesses invest in window coverings to enhance energy efficiency, comfort, and aesthetics in their environments.
  7. The convenience of e-commerce platforms will continue to boost online sales of window coverings, providing consumers with easier access to a wide variety of products and driving growth in the online distribution channel.
  8. As competition intensifies, particularly from low-cost regional players, established companies will face pricing pressures, leading to potential market consolidation and strategic partnerships.
  9. Ongoing technological advancements, such as the integration of AI and IoT in window coverings, will drive product innovation, offering enhanced functionality and user experience.
  10. The market will increasingly emphasize safety features and compliance with global standards, particularly in child-safe window coverings, as regulatory frameworks become more stringent.

CHAPTER NO. 1 : INTRODUCTION 28
1.1.1. Report Description 28
Purpose of the Report 28
USP & Key Offerings 28
1.1.2. Key Benefits for Stakeholders 28
1.1.3. Target Audience 29
1.1.4. Report Scope 29
1.1.5. Regional Scope 30
CHAPTER NO. 2 : EXECUTIVE SUMMARY 31
2.1. Window Coverings Market Snapshot 31
2.1.1. Global Window Coverings Market, 2018 – 2032 (Million Sq. Ft) (USD Million) 33
2.2. Insights from Primary Respondents 34
CHAPTER NO. 3 : GEOPOLITICAL CRISIS IMPACT ANALYSIS 35
3.1. Russia-Ukraine and Israel-Palestine War Impacts 35
CHAPTER NO. 4 : WINDOW COVERINGS MARKET – INDUSTRY ANALYSIS 36
4.1. Introduction 36
4.2. Market Drivers 37
4.2.1. Driving Factor 1 Analysis 37
4.2.2. Driving Factor 2 Analysis 38
4.3. Market Restraints 39
4.3.1. Restraining Factor Analysis 39
4.4. Market Opportunities 40
4.4.1. Market Opportunity Analysis 40
4.5. Porter’s Five Forces Analysis 41
CHAPTER NO. 5 : ANALYSIS COMPETITIVE LANDSCAPE 42
5.1. Company Market Share Analysis – 2023 42
5.1.1. Global Window Coverings Market: Company Market Share, by Volume, 2023 42
5.1.2. Global Window Coverings Market: Company Market Share, by Revenue, 2023 43
5.1.3. Global Window Coverings Market: Top 6 Company Market Share, by Revenue, 2023 43
5.1.4. Global Window Coverings Market: Top 3 Company Market Share, by Revenue, 2023 44
5.2. Global Window Coverings Market Company Volume Market Share, 2023 45
5.3. Global Window Coverings Market Company Revenue Market Share, 2023 46
5.4. Company Assessment Metrics, 2023 47
5.4.1. Stars 47
5.4.2. Emerging Leaders 47
5.4.3. Pervasive Players 47
5.4.4. Participants 47
5.5. Start-ups /SMEs Assessment Metrics, 2023 47
5.5.1. Progressive Companies 47
5.5.2. Responsive Companies 47
5.5.3. Dynamic Companies 47
5.5.4. Starting Blocks 47
5.6. Strategic Developments 48
5.6.1. Acquisitions & Mergers 48
New Product Launch 48
Regional Expansion 48
5.7. Key Players Product Matrix 49
CHAPTER NO. 6 : PESTEL & ADJACENT MARKET ANALYSIS 50
6.1. PESTEL 50
6.1.1. Political Factors 50
6.1.2. Economic Factors 50
6.1.3. Social Factors 50
6.1.4. Technological Factors 50
6.1.5. Environmental Factors 50
6.1.6. Legal Factors 50
6.2. Adjacent Market Analysis 50
CHAPTER NO. 7 : WINDOW COVERINGS MARKET – BY TYPE SEGMENT ANALYSIS 51
7.1. Window Coverings Market Overview, by Type Segment 51
7.1.1. Window Coverings Market Volume Share, By Type, 2023 & 2032 52
7.1.2. Window Coverings Market Revenue Share, By Type, 2023 & 2032 52
7.1.3. Window Coverings Market Attractiveness Analysis, By Type 53
7.1.4. Incremental Revenue Growth Opportunity, by Type, 2024 – 2032 53
7.1.5. Window Coverings Market Revenue, By Type, 2018, 2023, 2027 & 2032 54
7.2. Blinds & Shades 55
7.2.1. Global Blinds & Shades Window Coverings Market Volume & Revenue, By Region, 2018 – 2023 (Million Sq. Ft) (USD Million) 56
7.2.2. Global Blinds & Shades Window Coverings Market Volume & Revenue, By Region, 2024 – 2032 (Million Sq. Ft) (USD Million) 56
7.3. Curtains & Drapes 57
7.3.1. Global Curtains & Drapes Window Coverings Market Volume & Revenue, By Region, 2018 – 2023 (Million Sq. Ft) (USD Million) 58
7.3.2. Global Curtains & Drapes Window Coverings Market Volume & Revenue, By Region, 2024 – 2032 (Million Sq. Ft) (USD Million) 58
7.4. Shutters 59
7.4.1. Global Shutters Window Coverings Market Volume & Revenue, By Region, 2018 – 2023 (Million Sq. Ft) (USD Million) 60
7.4.2. Global Shutters Window Coverings Market Volume & Revenue, By Region, 2024 – 2032 (Million Sq. Ft) (USD Million) 60
7.5. Others 61
7.5.1. Global Others Window Coverings Market Volume & Revenue, By Region, 2018 – 2023 (Million Sq. Ft) (USD Million) 62
7.5.2. Global Others Window Coverings Market Volume & Revenue, By Region, 2024 – 2032 (Million Sq. Ft) (USD Million) 62
CHAPTER NO. 8 : WINDOW COVERINGS MARKET – BY APPLICATION SEGMENT ANALYSIS 63
8.1. Window Coverings Market Overview, by Application Segment 63
8.1.1. Window Coverings Market Volume Share, By Application, 2023 & 2032 64
8.1.2. Window Coverings Market Revenue Share, By Application, 2023 & 2032 64
8.1.3. Window Coverings Market Attractiveness Analysis, By Application 65
8.1.4. Incremental Revenue Growth Opportunity, by Application, 2024 – 2032 65
8.1.5. Window Coverings Market Revenue, By Application, 2018, 2023, 2027 & 2032 66
8.2. Residential 67
8.2.1. Global Residential Window Coverings Market Volume & Revenue, By Region, 2018 – 2023 (Million Sq. Ft) (USD Million) 68
8.2.2. Global Residential Window Coverings Market Volume & Revenue, By Region, 2024 – 2032 (Million Sq. Ft) (USD Million) 68
8.3. Commercial 69
8.3.1. Global Commercial Window Coverings Market Volume & Revenue, By Region, 2018 – 2023 (Million Sq. Ft) (USD Million) 70
8.3.2. Global Commercial Window Coverings Market Volume & Revenue, By Region, 2024 – 2032 (Million Sq. Ft) (USD Million) 70
CHAPTER NO. 9 : WINDOW COVERINGS MARKET – BY INSTALLATION SEGMENT ANALYSIS 71
9.1. Window Coverings Market Overview, by Installation Segment 71
9.1.1. Window Coverings Market Volume Share, By Installation, 2023 & 2032 72
9.1.2. Window Coverings Market Revenue Share, By Installation, 2023 & 2032 72
9.1.3. Window Coverings Market Attractiveness Analysis, By Installation 73
9.1.4. Incremental Revenue Growth Opportunity, by Installation, 2024 – 2032 73
9.1.5. Window Coverings Market Revenue, By Installation, 2018, 2023, 2027 & 2032 74
9.2. New Construction 75
9.2.1. Global New Construction Window Coverings Market Volume & Revenue, By Region, 2018 – 2023 (Million Sq. Ft) (USD Million) 76
9.2.2. Global New Construction Window Coverings Market Volume & Revenue, By Region, 2024 – 2032 (Million Sq. Ft) (USD Million) 76
9.3. Retrofit 77
9.3.1. Global Retrofit Window Coverings Market Volume & Revenue, By Region, 2018 – 2023 (Million Sq. Ft) (USD Million) 78
9.3.2. Global Retrofit Window Coverings Market Volume & Revenue, By Region, 2024 – 2032 (Million Sq. Ft) (USD Million) 78
CHAPTER NO. 10 : WINDOW COVERINGS MARKET – BY TECHNOLOGY SEGMENT ANALYSIS 79
10.1. Window Coverings Market Overview, by Technology Segment 79
10.1.1. Window Coverings Market Volume Share, By Technology, 2023 & 2032 80
10.1.2. Window Coverings Market Revenue Share, By Technology, 2023 & 2032 80
10.1.3. Window Coverings Market Attractiveness Analysis, By Technology 81
10.1.4. Incremental Revenue Growth Opportunity, by Technology, 2024 – 2032 81
10.1.5. Window Coverings Market Revenue, By Technology, 2018, 2023, 2027 & 2032 82
10.2. Automatic 83
10.2.1. Global Automatic Window Coverings Market Volume & Revenue, By Region, 2018 – 2023 (Million Sq. Ft) (USD Million) 84
10.2.2. Global Automatic Window Coverings Market Volume & Revenue, By Region, 2024 – 2032 (Million Sq. Ft) (USD Million) 84
10.3. Manual 85
10.3.1. Global Manual Window Coverings Market Volume & Revenue, By Region, 2018 – 2023 (Million Sq. Ft) (USD Million) 86
10.3.2. Global Manual Window Coverings Market Volume & Revenue, By Region, 2024 – 2032 (Million Sq. Ft) (USD Million) 86
CHAPTER NO. 11 : WINDOW COVERINGS MARKET – BY DISTRIBUTION CHANNEL SEGMENT ANALYSIS 87
11.1. Window Coverings Market Overview, by Distribution Channel Segment 87
11.1.1. Window Coverings Market Volume Share, By Distribution Channel, 2023 & 2032 88
11.1.2. Window Coverings Market Revenue Share, By Distribution Channel, 2023 & 2032 88
11.1.3. Window Coverings Market Attractiveness Analysis, By Distribution Channel 89
11.1.4. Incremental Revenue Growth Opportunity, by Distribution Channel, 2024 – 2032 89
11.1.5. Window Coverings Market Revenue, By Distribution Channel, 2018, 2023, 2027 & 2032 90
11.2. Online 91
11.2.1. Global Online Window Coverings Market Volume & Revenue, By Region, 2018 – 2023 (Million Sq. Ft) (USD Million) 92
11.2.2. Global Online Window Coverings Market Volume & Revenue, By Region, 2024 – 2032 (Million Sq. Ft) (USD Million) 93
11.3. Offline 94
11.3.1. Global Offline Window Coverings Market Volume & Revenue, By Region, 2018 – 2023 (Million Sq. Ft) (USD Million) 95
11.3.2. Global Offline Window Coverings Market Volume & Revenue, By Region, 2024 – 2032 (Million Sq. Ft) (USD Million) 96
CHAPTER NO. 12 : WINDOW COVERINGS MARKET – REGIONAL ANALYSIS 97
12.1. Window Coverings Market Overview, by Regional Segments 97
12.2. Region 98
12.2.1. Global Window Coverings Market Volume Share, By Region, 2023 & 2032 98
12.2.2. Global Window Coverings Market Revenue Share, By Region, 2023 & 2032 98
12.2.3. Window Coverings Market Attractiveness Analysis, By Region 99
12.2.4. Incremental Revenue Growth Opportunity, by Region, 2024 – 2032 99
12.2.5. Window Coverings Market Revenue, By Region, 2018, 2023, 2027 & 2032 100
12.2.6. Global Window Coverings Market Volume & Revenue, By Region, 2018 – 2023 (Million Sq. Ft) (USD Million) 101
12.2.7. Global Window Coverings Market Volume & Revenue, By Region, 2024 – 2032 (Million Sq. Ft) (USD Million) 101
12.3. Type 103
12.3.1. Global Window Coverings Market Volume & Revenue, By Type, 2018 – 2023 (Million Sq. Ft) (USD Million) 103
12.3.2. Global Window Coverings Market Volume & Revenue, By Type, 2024 – 2032 (Million Sq. Ft) (USD Million) 103
12.4. Application 104
12.4.1. Global Window Coverings Market Volume & Revenue, By Application, 2018 – 2023 (Million Sq. Ft) (USD Million) 104
12.4.2. Global Window Coverings Market Volume & Revenue, By Application, 2024 – 2032 (Million Sq. Ft) (USD Million) 105
12.5. Installation 106
12.5.1. Global Window Coverings Market Volume & Revenue, By Installation, 2018 – 2023 (Million Sq. Ft) (USD Million) 106
12.5.2. Global Window Coverings Market Volume & Revenue, By Installation, 2024 – 2032 (Million Sq. Ft) (USD Million) 107
12.6. Technology 108
12.6.1. Global Window Coverings Market Volume & Revenue, By Technology, 2018 – 2023 (Million Sq. Ft) (USD Million) 108
12.6.2. Global Window Coverings Market Volume & Revenue, By Technology, 2024 – 2032 (Million Sq. Ft) (USD Million) 109
12.7. Distribution Channel 110
12.7.1. Global Window Coverings Market Volume & Revenue, By Distribution Channel, 2018 – 2023 (Million Sq. Ft) (USD Million) 110
12.7.2. Global Window Coverings Market Volume & Revenue, By Distribution Channel, 2024 – 2032 (Million Sq. Ft) (USD Million) 111
CHAPTER NO. 13 : WINDOW COVERINGS MARKET – NORTH AMERICA 112
13.1. North America 112
13.1.1. Key Highlights 112
13.1.2. North America Window Coverings Market Volume, By Country, 2018 – 2032 (Million Sq. Ft) 113
13.1.3. North America Window Coverings Market Revenue, By Country, 2018 – 2023 (USD Million) 114
13.1.4. North America Window Coverings Market Volume, By Type, 2018 – 2023 (Million Sq. Ft) 115
13.1.5. North America Window Coverings Market Revenue, By Type, 2018 – 2023 (USD Million) 116
13.1.6. North America Window Coverings Market Volume, By Application, 2018 – 2023 (Million Sq. Ft) 117
13.1.7. North America Window Coverings Market Revenue, By Application, 2018 – 2023 (USD Million) 118
13.1.8. North America Window Coverings Market Volume, By Installation, 2018 – 2023 (Million Sq. Ft) 119
13.1.9. North America Window Coverings Market Revenue, By Installation, 2018 – 2023 (USD Million) 120
13.1.10. North America Window Coverings Market Volume, By Technology, 2018 – 2023 (Million Sq. Ft) 121
13.1.11. North America Window Coverings Market Revenue, By Technology, 2018 – 2023 (USD Million) 122
13.1.12. North America Window Coverings Market Volume, By Distribution Channel, 2018 – 2023 (Million Sq. Ft) 123
13.1.13. North America Window Coverings Market Revenue, By Distribution Channel, 2018 – 2023 (USD Million) 124
13.2. U.S. 125
13.3. Canada 125
13.4. Mexico 125
CHAPTER NO. 14 : WINDOW COVERINGS MARKET – EUROPE 126
14.1. Europe 126
14.1.1. Key Highlights 126
14.1.2. Europe Window Coverings Market Volume, By Country, 2018 – 2032 (Million Sq. Ft) 127
14.1.3. Europe Window Coverings Market Revenue, By Country, 2018 – 2023 (USD Million) 128
14.1.4. Europe Window Coverings Market Volume, By Type, 2018 – 2023 (Million Sq. Ft) 129
14.1.5. Europe Window Coverings Market Revenue, By Type, 2018 – 2023 (USD Million) 130
14.1.6. Europe Window Coverings Market Volume, By Application, 2018 – 2023 (Million Sq. Ft) 131
14.1.7. Europe Window Coverings Market Revenue, By Application, 2018 – 2023 (USD Million) 132
14.1.8. Europe Window Coverings Market Volume, By Installation, 2018 – 2023 (Million Sq. Ft) 133
14.1.9. Europe Window Coverings Market Revenue, By Installation, 2018 – 2023 (USD Million) 134
14.1.10. Europe Window Coverings Market Volume, By Technology, 2018 – 2023 (Million Sq. Ft) 135
14.1.11. Europe Window Coverings Market Revenue, By Technology, 2018 – 2023 (USD Million) 136
14.1.12. Europe Window Coverings Market Volume, By Distribution Channel, 2018 – 2023 (Million Sq. Ft) 137
14.1.13. Europe Window Coverings Market Revenue, By Distribution Channel, 2018 – 2023 (USD Million) 138
14.2. UK 139
14.3. France 139
14.4. Germany 139
14.5. Italy 139
14.6. Spain 139
14.7. Russia 139
14.8. Belgium 139
14.9. Netherland 139
14.10. Austria 139
14.11. Sweden 139
14.12. Poland 139
14.13. Denmark 139
14.14. Switzerland 139
14.15. Rest of Europe 139
CHAPTER NO. 15 : WINDOW COVERINGS MARKET – ASIA PACIFIC 140
15.1. Asia Pacific 140
15.1.1. Key Highlights 140
15.1.2. Asia Pacific Window Coverings Market Volume, By Country, 2018 – 2032 (Million Sq. Ft) 141
15.1.3. Asia Pacific Window Coverings Market Revenue, By Country, 2018 – 2023 (USD Million) 142
15.1.4. Asia Pacific Window Coverings Market Volume, By Type, 2018 – 2023 (Million Sq. Ft) 143
15.1.5. Asia Pacific Window Coverings Market Revenue, By Type, 2018 – 2023 (USD Million) 144
15.1.6. Asia Pacific Window Coverings Market Volume, By Application, 2018 – 2023 (Million Sq. Ft) 145
15.1.7. Asia Pacific Window Coverings Market Revenue, By Application, 2018 – 2023 (USD Million) 146
15.1.8. Asia Pacific Window Coverings Market Volume, By Installation, 2018 – 2023 (Million Sq. Ft) 147
15.1.9. Asia Pacific Window Coverings Market Revenue, By Installation, 2018 – 2023 (USD Million) 148
15.1.10. Asia Pacific Window Coverings Market Volume, By Technology, 2018 – 2023 (Million Sq. Ft) 149
15.1.11. Asia Pacific Window Coverings Market Revenue, By Technology, 2018 – 2023 (USD Million) 150
15.1.12. Asia Pacific Window Coverings Market Volume, By Distribution Channel, 2018 – 2023 (Million Sq. Ft) 151
15.1.13. Asia Pacific Window Coverings Market Revenue, By Distribution Channel, 2018 – 2023 (USD Million) 152
15.2. China 153
15.3. Japan 153
15.4. South Korea 153
15.5. India 153
15.6. Australia 153
15.7. Thailand 153
15.8. Indonesia 153
15.9. Vietnam 153
15.10. Malaysia 153
15.11. Philippines 153
15.12. Taiwan 153
15.13. Rest of Asia Pacific 153
CHAPTER NO. 16 : WINDOW COVERINGS MARKET – LATIN AMERICA 154
16.1. Latin America 154
16.1.1. Key Highlights 154
16.1.2. Latin America Window Coverings Market Volume, By Country, 2018 – 2032 (Million Sq. Ft) 155
16.1.3. Latin America Window Coverings Market Revenue, By Country, 2018 – 2023 (USD Million) 156
16.1.4. Latin America Window Coverings Market Volume, By Type, 2018 – 2023 (Million Sq. Ft) 157
16.1.5. Latin America Window Coverings Market Revenue, By Type, 2018 – 2023 (USD Million) 158
16.1.6. Latin America Window Coverings Market Volume, By Application, 2018 – 2023 (Million Sq. Ft) 159
16.1.7. Latin America Window Coverings Market Revenue, By Application, 2018 – 2023 (USD Million) 160
16.1.8. Latin America Window Coverings Market Volume, By Installation, 2018 – 2023 (Million Sq. Ft) 161
16.1.9. Latin America Window Coverings Market Revenue, By Installation, 2018 – 2023 (USD Million) 162
16.1.10. Latin America Window Coverings Market Volume, By Technology, 2018 – 2023 (Million Sq. Ft) 163
16.1.11. Latin America Window Coverings Market Revenue, By Technology, 2018 – 2023 (USD Million) 164
16.1.12. Latin America Window Coverings Market Volume, By Distribution Channel, 2018 – 2023 (Million Sq. Ft) 165
16.1.13. Latin America Window Coverings Market Revenue, By Distribution Channel, 2018 – 2023 (USD Million) 166
16.2. Brazil 167
16.3. Argentina 167
16.4. Peru 167
16.5. Chile 167
16.6. Colombia 167
16.7. Rest of Latin America 167
CHAPTER NO. 17 : WINDOW COVERINGS MARKET – MIDDLE EAST 168
17.1. Middle East 168
17.1.1. Key Highlights 168
17.1.2. Middle East Window Coverings Market Volume, By Country, 2018 – 2032 (Million Sq. Ft) 169
17.1.3. Middle East Window Coverings Market Revenue, By Country, 2018 – 2023 (USD Million) 170
17.1.4. Middle East Window Coverings Market Volume, By Type, 2018 – 2023 (Million Sq. Ft) 171
17.1.5. Middle East Window Coverings Market Revenue, By Type, 2018 – 2023 (USD Million) 172
17.1.6. Middle East Window Coverings Market Volume, By Application, 2018 – 2023 (Million Sq. Ft) 173
17.1.7. Middle East Window Coverings Market Revenue, By Application, 2018 – 2023 (USD Million) 174
17.1.8. Middle East Window Coverings Market Volume, By Installation, 2018 – 2023 (Million Sq. Ft) 175
17.1.9. Middle East Window Coverings Market Revenue, By Installation, 2018 – 2023 (USD Million) 176
17.1.10. Middle East Window Coverings Market Volume, By Technology, 2018 – 2023 (Million Sq. Ft) 177
17.1.11. Middle East Window Coverings Market Revenue, By Technology, 2018 – 2023 (USD Million) 178
17.1.12. Middle East Window Coverings Market Volume, By Distribution Channel, 2018 – 2023 (Million Sq. Ft) 179
17.1.13. Middle East Window Coverings Market Revenue, By Distribution Channel, 2018 – 2023 (USD Million) 180
17.2. UAE 181
17.3. KSA 181
17.4. Israel 181
17.5. Turkey 181
17.6. Iran 181
17.7. Rest of Middle East 181
CHAPTER NO. 18 : WINDOW COVERINGS MARKET – AFRICA 182
18.1. Africa 182
18.1.1. Key Highlights 182
18.1.2. Africa Window Coverings Market Volume, By Country, 2018 – 2032 (Million Sq. Ft) 183
18.1.3. Africa Window Coverings Market Revenue, By Country, 2018 – 2023 (USD Million) 184
18.1.4. Africa Window Coverings Market Volume, By Type, 2018 – 2023 (Million Sq. Ft) 185
18.1.5. Africa Window Coverings Market Revenue, By Type, 2018 – 2023 (USD Million) 186
18.1.6. Africa Window Coverings Market Volume, By Application, 2018 – 2023 (Million Sq. Ft) 187
18.1.7. Africa Window Coverings Market Revenue, By Application, 2018 – 2023 (USD Million) 188
18.1.8. Africa Window Coverings Market Volume, By Installation, 2018 – 2023 (Million Sq. Ft) 189
18.1.9. Africa Window Coverings Market Revenue, By Installation, 2018 – 2023 (USD Million) 190
18.1.10. Africa Window Coverings Market Volume, By Technology, 2018 – 2023 (Million Sq. Ft) 191
18.1.11. Africa Window Coverings Market Revenue, By Technology, 2018 – 2023 (USD Million) 192
18.1.12. Africa Window Coverings Market Volume, By Distribution Channel, 2018 – 2023 (Million Sq. Ft) 193
18.1.13. Africa Window Coverings Market Revenue, By Distribution Channel, 2018 – 2023 (USD Million) 194
18.2. Egypt 195
18.3. Nigeria 195
18.4. Algeria 195
18.5. Morocco 195
18.6. Rest of Africa 195
CHAPTER NO. 19 : COMPANY PROFILES 196
19.1. Hunter Douglas Inc. 196
19.1.1. Company Overview 196
19.1.2. Product Portfolio 196
19.1.3. Swot Analysis 196
19.1.4. Business Strategy 196
19.1.5. Financial Overview 197
19.2. Lotus & Windoware, Inc. 198
19.3. Bombay Dyeing & Manufacturing Co Ltd. 198
19.4. Insolroll Window Shading Systems 198
19.5. Springs Window Fashions 198
19.6. Welspun 198
19.7. SKANDIA WINDOW FASHIONS, INC. 198
19.8. MechoShade Systems, LLC 198
19.9. Lafayette Interior Fashions 198
19.10. Comfortex Window Fashions 198
CHAPTER NO. 20 : RESEARCH METHODOLOGY 199
20.1. Research Methodology 199
20.1.1. Phase I – Secondary Research 200
20.1.2. Phase II – Data Modeling 200
Company Share Analysis Model 201
Revenue Based Modeling 201
20.1.3. Phase III – Primary Research 202
20.1.4. Research Limitations 203
Assumptions 203

List of Figures
FIG NO. 1. Global Window Coverings Market Volume & Revenue, 2018 – 2032 (Million Sq. Ft) (USD Million) 33
FIG NO. 2. Porter’s Five Forces Analysis for Global Window Coverings Market 41
FIG NO. 3. Company Share Analysis, 2023 42
FIG NO. 4. Company Share Analysis, 2023 43
FIG NO. 5. Company Share Analysis, 2023 43
FIG NO. 6. Company Share Analysis, 2023 44
FIG NO. 7. Window Coverings Market – Company Volume Market Share, 2023 45
FIG NO. 8. Window Coverings Market – Company Revenue Market Share, 2023 46
FIG NO. 9. Window Coverings Market Volume Share, By Type, 2023 & 2032 52
FIG NO. 10. Window Coverings Market Revenue Share, By Type, 2023 & 2032 52
FIG NO. 11. Market Attractiveness Analysis, By Type 53
FIG NO. 12. Incremental Revenue Growth Opportunity by Type, 2024 – 2032 53
FIG NO. 13. Window Coverings Market Revenue, By Type, 2018, 2023, 2027 & 2032 54
FIG NO. 14. Global Window Coverings Market for Blinds & Shades, Volume & Revenue (Million Sq. Ft) (USD Million) 2018 – 2032 55
FIG NO. 15. Global Window Coverings Market for Curtains & Drapes, Volume & Revenue (Million Sq. Ft) (USD Million) 2018 – 2032 57
FIG NO. 16. Global Window Coverings Market for Shutters, Volume & Revenue (Million Sq. Ft) (USD Million) 2018 – 2032 59
FIG NO. 17. Global Window Coverings Market for Others, Volume & Revenue (Million Sq. Ft) (USD Million) 2018 – 2032 61
FIG NO. 18. Window Coverings Market Volume Share, By Application, 2023 & 2032 64
FIG NO. 19. Window Coverings Market Revenue Share, By Application, 2023 & 2032 64
FIG NO. 20. Market Attractiveness Analysis, By Application 65
FIG NO. 21. Incremental Revenue Growth Opportunity by Application, 2024 – 2032 65
FIG NO. 22. Window Coverings Market Revenue, By Application, 2018, 2023, 2027 & 2032 66
FIG NO. 23. Global Window Coverings Market for Residential, Volume & Revenue (Million Sq. Ft) (USD Million) 2018 – 2032 67
FIG NO. 24. Global Window Coverings Market for Commercial, Volume & Revenue (Million Sq. Ft) (USD Million) 2018 – 2032 69
FIG NO. 25. Window Coverings Market Volume Share, By Installation, 2023 & 2032 72
FIG NO. 26. Window Coverings Market Revenue Share, By Installation, 2023 & 2032 72
FIG NO. 27. Market Attractiveness Analysis, By Installation 73
FIG NO. 28. Incremental Revenue Growth Opportunity by Installation, 2024 – 2032 73
FIG NO. 29. Window Coverings Market Revenue, By Installation, 2018, 2023, 2027 & 2032 74
FIG NO. 30. Global Window Coverings Market for New Construction, Volume & Revenue (Million Sq. Ft) (USD Million) 2018 – 2032 75
FIG NO. 31. Global Window Coverings Market for Retrofit, Volume & Revenue (Million Sq. Ft) (USD Million) 2018 – 2032 77
FIG NO. 32. Window Coverings Market Volume Share, By Technology, 2023 & 2032 80
FIG NO. 33. Window Coverings Market Revenue Share, By Technology, 2023 & 2032 80
FIG NO. 34. Market Attractiveness Analysis, By Technology 81
FIG NO. 35. Incremental Revenue Growth Opportunity by Technology, 2024 – 2032 81
FIG NO. 36. Window Coverings Market Revenue, By Technology, 2018, 2023, 2027 & 2032 82
FIG NO. 37. Global Window Coverings Market for Automatic, Volume & Revenue (Million Sq. Ft) (USD Million) 2018 – 2032 83
FIG NO. 38. Global Window Coverings Market for Manual, Volume & Revenue (Million Sq. Ft) (USD Million) 2018 – 2032 85
FIG NO. 39. Window Coverings Market Volume Share, By Distribution Channel, 2023 & 2032 88
FIG NO. 40. Window Coverings Market Revenue Share, By Distribution Channel, 2023 & 2032 88
FIG NO. 41. Market Attractiveness Analysis, By Distribution Channel 89
FIG NO. 42. Incremental Revenue Growth Opportunity by Distribution Channel, 2024 – 2032 89
FIG NO. 43. Window Coverings Market Revenue, By Distribution Channel, 2018, 2023, 2027 & 2032 90
FIG NO. 44. Global Window Coverings Market for Online, Volume & Revenue (Million Sq. Ft) (USD Million) 2018 – 2032 91
FIG NO. 45. Global Window Coverings Market for Offline, Volume & Revenue (Million Sq. Ft) (USD Million) 2018 – 2032 94
FIG NO. 46. Global Window Coverings Market Volume Share, By Region, 2023 & 2032 98
FIG NO. 47. Global Window Coverings Market Revenue Share, By Region, 2023 & 2032 98
FIG NO. 48. Market Attractiveness Analysis, By Region 99
FIG NO. 49. Incremental Revenue Growth Opportunity by Region, 2024 – 2032 99
FIG NO. 50. Window Coverings Market Revenue, By Region, 2018, 2023, 2027 & 2032 100
FIG NO. 51. North America Window Coverings Market Volume & Revenue, 2018 – 2032 (Million Sq. Ft) (USD Million) 112
FIG NO. 52. Europe Window Coverings Market Volume & Revenue, 2018 – 2032 (Million Sq. Ft) (USD Million) 126
FIG NO. 53. Asia Pacific Window Coverings Market Volume & Revenue, 2018 – 2032 (Million Sq. Ft) (USD Million) 140
FIG NO. 54. Latin America Window Coverings Market Volume & Revenue, 2018 – 2032 (Million Sq. Ft) (USD Million) 154
FIG NO. 55. Middle East Window Coverings Market Volume & Revenue, 2018 – 2032 (Million Sq. Ft) (USD Million) 168
FIG NO. 56. Africa Window Coverings Market Volume & Revenue, 2018 – 2032 (Million Sq. Ft) (USD Million) 182
FIG NO. 57. Research Methodology – Detailed View 199
FIG NO. 58. Research Methodology 200


List of Tables
TABLE NO. 1. : Global Window Coverings Market: Snapshot 31
TABLE NO. 2. : Drivers for the Window Coverings Market: Impact Analysis 37
TABLE NO. 3. : Restraints for the Window Coverings Market: Impact Analysis 39
TABLE NO. 4. : Global Blinds & Shades Window Coverings Market Volume & Revenue, By Region, 2018 – 2023 (Million Sq. Ft) (USD Million) 56
TABLE NO. 5. : Global Blinds & Shades Window Coverings Market Volume & Revenue, By Region, 2024 – 2032 (Million Sq. Ft) (USD Million) 56
TABLE NO. 6. : Global Curtains & Drapes Window Coverings Market Volume & Revenue, By Region, 2018 – 2023 (Million Sq. Ft) (USD Million) 58
TABLE NO. 7. : Global Curtains & Drapes Window Coverings Market Volume & Revenue, By Region, 2024 – 2032 (Million Sq. Ft) (USD Million) 58
TABLE NO. 8. : Global Shutters Window Coverings Market Volume & Revenue, By Region, 2018 – 2023 (Million Sq. Ft) (USD Million) 60
TABLE NO. 9. : Global Shutters Window Coverings Market Volume & Revenue, By Region, 2024 – 2032 (Million Sq. Ft) (USD Million) 60
TABLE NO. 10. : Global Others Window Coverings Market Volume & Revenue, By Region, 2018 – 2023 (Million Sq. Ft) (USD Million) 62
TABLE NO. 11. : Global Others Window Coverings Market Volume & Revenue, By Region, 2024 – 2032 (Million Sq. Ft) (USD Million) 62
TABLE NO. 12. : Global Residential Window Coverings Market Volume & Revenue, By Region, 2018 – 2023 (Million Sq. Ft) (USD Million) 68
TABLE NO. 13. : Global Residential Window Coverings Market Volume & Revenue, By Region, 2024 – 2032 (Million Sq. Ft) (USD Million) 68
TABLE NO. 14. : Global Commercial Window Coverings Market Volume & Revenue, By Region, 2018 – 2023 (Million Sq. Ft) (USD Million) 70
TABLE NO. 15. : Global Commercial Window Coverings Market Volume & Revenue, By Region, 2024 – 2032 (Million Sq. Ft) (USD Million) 70
TABLE NO. 16. : Global New Construction Window Coverings Market Volume & Revenue, By Region, 2018 – 2023 (Million Sq. Ft) (USD Million) 76
TABLE NO. 17. : Global New Construction Window Coverings Market Volume & Revenue, By Region, 2024 – 2032 (Million Sq. Ft) (USD Million) 76
TABLE NO. 18. : Global Retrofit Window Coverings Market Volume & Revenue, By Region, 2018 – 2023 (Million Sq. Ft) (USD Million) 78
TABLE NO. 19. : Global Retrofit Window Coverings Market Volume & Revenue, By Region, 2024 – 2032 (Million Sq. Ft) (USD Million) 78
TABLE NO. 20. : Global Automatic Window Coverings Market Volume & Revenue, By Region, 2018 – 2023 (Million Sq. Ft) (USD Million) 84
TABLE NO. 21. : Global Automatic Window Coverings Market Volume & Revenue, By Region, 2024 – 2032 (Million Sq. Ft) (USD Million) 84
TABLE NO. 22. : Global Manual Window Coverings Market Volume & Revenue, By Region, 2018 – 2023 (Million Sq. Ft) (USD Million) 86
TABLE NO. 23. : Global Manual Window Coverings Market Volume & Revenue, By Region, 2024 – 2032 (Million Sq. Ft) (USD Million) 86
TABLE NO. 24. : Global Online Window Coverings Market Volume & Revenue, By Region, 2018 – 2023 (Million Sq. Ft) (USD Million) 92
TABLE NO. 25. : Global Online Window Coverings Market Volume & Revenue, By Region, 2024 – 2032 (Million Sq. Ft) (USD Million) 93
TABLE NO. 26. : Global Offline Window Coverings Market Volume & Revenue, By Region, 2018 – 2023 (Million Sq. Ft) (USD Million) 95
TABLE NO. 27. : Global Offline Window Coverings Market Volume & Revenue, By Region, 2024 – 2032 (Million Sq. Ft) (USD Million) 96
TABLE NO. 28. : Global Window Coverings Market Volume & Revenue, By Region, 2018 – 2023 (Million Sq. Ft) (USD Million) 101
TABLE NO. 29. : Global Window Coverings Market Volume & Revenue, By Region, 2024 – 2032 (Million Sq. Ft) (USD Million) 101
TABLE NO. 30. : Global Window Coverings Market Volume & Revenue, By Type, 2018 – 2023 (Million Sq. Ft) (USD Million) 103
TABLE NO. 31. : Global Window Coverings Market Volume & Revenue, By Type, 2024 – 2032 (Million Sq. Ft) (USD Million) 103
TABLE NO. 32. : Global Window Coverings Market Volume & Revenue, By Application, 2018 – 2023 (Million Sq. Ft) (USD Million) 104
TABLE NO. 33. : Global Window Coverings Market Volume & Revenue, By Application, 2024 – 2032 (Million Sq. Ft) (USD Million) 105
TABLE NO. 34. : Global Window Coverings Market Volume & Revenue, By Installation, 2018 – 2023 (Million Sq. Ft) (USD Million) 106
TABLE NO. 35. : Global Window Coverings Market Volume & Revenue, By Installation, 2024 – 2032 (Million Sq. Ft) (USD Million) 107
TABLE NO. 36. : Global Window Coverings Market Volume & Revenue, By Technology, 2018 – 2023 (Million Sq. Ft) (USD Million) 108
TABLE NO. 37. : Global Window Coverings Market Volume & Revenue, By Technology, 2024 – 2032 (Million Sq. Ft) (USD Million) 109
TABLE NO. 38. : Global Window Coverings Market Volume & Revenue, By Distribution Channel, 2018 – 2023 (Million Sq. Ft) (USD Million) 110
TABLE NO. 39. : Global Window Coverings Market Volume & Revenue, By Distribution Channel, 2024 – 2032 (Million Sq. Ft) (USD Million) 111
TABLE NO. 40. : North America Window Coverings Market Volume, By Country, 2018 – 2023 (Million Sq. Ft) 113
TABLE NO. 41. : North America Window Coverings Market Volume, By Country, 2024 – 2032 (Million Sq. Ft) 113
TABLE NO. 42. : North America Window Coverings Market Revenue, By Country, 2018 – 2023 (USD Million) 114
TABLE NO. 43. : North America Window Coverings Market Revenue, By Country, 2024 – 2032 (USD Million) 114
TABLE NO. 44. : North America Window Coverings Market Volume, By Type, 2018 – 2023 (Million Sq. Ft) 115
TABLE NO. 45. : North America Window Coverings Market Volume, By Type, 2024 – 2032 (Million Sq. Ft) 115
TABLE NO. 46. : North America Window Coverings Market Revenue, By Type, 2018 – 2023 (USD Million) 116
TABLE NO. 47. : North America Window Coverings Market Revenue, By Type, 2024 – 2032 (USD Million) 116
TABLE NO. 48. : North America Window Coverings Market Volume, By Application, 2018 – 2023 (Million Sq. Ft) 117
TABLE NO. 49. : North America Window Coverings Market Volume, By Application, 2024 – 2032 (Million Sq. Ft) 117
TABLE NO. 50. : North America Window Coverings Market Revenue, By Application, 2018 – 2023 (USD Million) 118
TABLE NO. 51. : North America Window Coverings Market Revenue, By Application, 2024 – 2032 (USD Million) 118
TABLE NO. 52. : North America Window Coverings Market Volume, By Installation, 2018 – 2023 (Million Sq. Ft) 119
TABLE NO. 53. : North America Window Coverings Market Volume, By Installation, 2024 – 2032 (Million Sq. Ft) 119
TABLE NO. 54. : North America Window Coverings Market Revenue, By Installation, 2018 – 2023 (USD Million) 120
TABLE NO. 55. : North America Window Coverings Market Revenue, By Installation, 2024 – 2032 (USD Million) 120
TABLE NO. 56. : North America Window Coverings Market Volume, By Technology, 2018 – 2023 (Million Sq. Ft) 121
TABLE NO. 57. : North America Window Coverings Market Volume, By Technology, 2024 – 2032 (Million Sq. Ft) 121
TABLE NO. 58. : North America Window Coverings Market Revenue, By Technology, 2018 – 2023 (USD Million) 122
TABLE NO. 59. : North America Window Coverings Market Revenue, By Technology, 2024 – 2032 (USD Million) 122
TABLE NO. 60. : North America Window Coverings Market Volume, By Distribution Channel, 2018 – 2023 (Million Sq. Ft) 123
TABLE NO. 61. : North America Window Coverings Market Volume, By Distribution Channel, 2024 – 2032 (Million Sq. Ft) 123
TABLE NO. 62. : North America Window Coverings Market Revenue, By Distribution Channel, 2018 – 2023 (USD Million) 124
TABLE NO. 63. : North America Window Coverings Market Revenue, By Distribution Channel, 2024 – 2032 (USD Million) 124
TABLE NO. 64. : Europe Window Coverings Market Volume, By Country, 2018 – 2023 (Million Sq. Ft) 127
TABLE NO. 65. : Europe Window Coverings Market Volume, By Country, 2024 – 2032 (Million Sq. Ft) 127
TABLE NO. 66. : Europe Window Coverings Market Revenue, By Country, 2018 – 2023 (USD Million) 128
TABLE NO. 67. : Europe Window Coverings Market Revenue, By Country, 2024 – 2032 (USD Million) 128
TABLE NO. 68. : Europe Window Coverings Market Volume, By Type, 2018 – 2023 (Million Sq. Ft) 129
TABLE NO. 69. : Europe Window Coverings Market Volume, By Type, 2024 – 2032 (Million Sq. Ft) 129
TABLE NO. 70. : Europe Window Coverings Market Revenue, By Type, 2018 – 2023 (USD Million) 130
TABLE NO. 71. : Europe Window Coverings Market Revenue, By Type, 2024 – 2032 (USD Million) 130
TABLE NO. 72. : Europe Window Coverings Market Volume, By Application, 2018 – 2023 (Million Sq. Ft) 131
TABLE NO. 73. : Europe Window Coverings Market Volume, By Application, 2024 – 2032 (Million Sq. Ft) 131
TABLE NO. 74. : Europe Window Coverings Market Revenue, By Application, 2018 – 2023 (USD Million) 132
TABLE NO. 75. : Europe Window Coverings Market Revenue, By Application, 2024 – 2032 (USD Million) 132
TABLE NO. 76. : Europe Window Coverings Market Volume, By Installation, 2018 – 2023 (Million Sq. Ft) 133
TABLE NO. 77. : Europe Window Coverings Market Volume, By Installation, 2024 – 2032 (Million Sq. Ft) 133
TABLE NO. 78. : Europe Window Coverings Market Revenue, By Installation, 2018 – 2023 (USD Million) 134
TABLE NO. 79. : Europe Window Coverings Market Revenue, By Installation, 2024 – 2032 (USD Million) 134
TABLE NO. 80. : Europe Window Coverings Market Volume, By Technology, 2018 – 2023 (Million Sq. Ft) 135
TABLE NO. 81. : Europe Window Coverings Market Volume, By Technology, 2024 – 2032 (Million Sq. Ft) 135
TABLE NO. 82. : Europe Window Coverings Market Revenue, By Technology, 2018 – 2023 (USD Million) 136
TABLE NO. 83. : Europe Window Coverings Market Revenue, By Technology, 2024 – 2032 (USD Million) 136
TABLE NO. 84. : Europe Window Coverings Market Volume, By Distribution Channel, 2018 – 2023 (Million Sq. Ft) 137
TABLE NO. 85. : Europe Window Coverings Market Volume, By Distribution Channel, 2024 – 2032 (Million Sq. Ft) 137
TABLE NO. 86. : Europe Window Coverings Market Revenue, By Distribution Channel, 2018 – 2023 (USD Million) 138
TABLE NO. 87. : Europe Window Coverings Market Revenue, By Distribution Channel, 2024 – 2032 (USD Million) 138
TABLE NO. 88. : Asia Pacific Window Coverings Market Volume, By Country, 2018 – 2023 (Million Sq. Ft) 141
TABLE NO. 89. : Asia Pacific Window Coverings Market Volume, By Country, 2024 – 2032 (Million Sq. Ft) 141
TABLE NO. 90. : Asia Pacific Window Coverings Market Revenue, By Country, 2018 – 2023 (USD Million) 142
TABLE NO. 91. : Asia Pacific Window Coverings Market Revenue, By Country, 2024 – 2032 (USD Million) 142
TABLE NO. 92. : Asia Pacific Window Coverings Market Volume, By Type, 2018 – 2023 (Million Sq. Ft) 143
TABLE NO. 93. : Asia Pacific Window Coverings Market Volume, By Type, 2024 – 2032 (Million Sq. Ft) 143
TABLE NO. 94. : Asia Pacific Window Coverings Market Revenue, By Type, 2018 – 2023 (USD Million) 144
TABLE NO. 95. : Asia Pacific Window Coverings Market Revenue, By Type, 2024 – 2032 (USD Million) 144
TABLE NO. 96. : Asia Pacific Window Coverings Market Volume, By Application, 2018 – 2023 (Million Sq. Ft) 145
TABLE NO. 97. : Asia Pacific Window Coverings Market Volume, By Application, 2024 – 2032 (Million Sq. Ft) 145
TABLE NO. 98. : Asia Pacific Window Coverings Market Revenue, By Application, 2018 – 2023 (USD Million) 146
TABLE NO. 99. : Asia Pacific Window Coverings Market Revenue, By Application, 2024 – 2032 (USD Million) 146
TABLE NO. 100. : Asia Pacific Window Coverings Market Volume, By Installation, 2018 – 2023 (Million Sq. Ft) 147
TABLE NO. 101. : Asia Pacific Window Coverings Market Volume, By Installation, 2024 – 2032 (Million Sq. Ft) 147
TABLE NO. 102. : Asia Pacific Window Coverings Market Revenue, By Installation, 2018 – 2023 (USD Million) 148
TABLE NO. 103. : Asia Pacific Window Coverings Market Revenue, By Installation, 2024 – 2032 (USD Million) 148
TABLE NO. 104. : Asia Pacific Window Coverings Market Volume, By Technology, 2018 – 2023 (Million Sq. Ft) 149
TABLE NO. 105. : Asia Pacific Window Coverings Market Volume, By Technology, 2024 – 2032 (Million Sq. Ft) 149
TABLE NO. 106. : Asia Pacific Window Coverings Market Revenue, By Technology, 2018 – 2023 (USD Million) 150
TABLE NO. 107. : Asia Pacific Window Coverings Market Revenue, By Technology, 2024 – 2032 (USD Million) 150
TABLE NO. 108. : Asia Pacific Window Coverings Market Volume, By Distribution Channel, 2018 – 2023 (Million Sq. Ft) 151
TABLE NO. 109. : Asia Pacific Window Coverings Market Volume, By Distribution Channel, 2024 – 2032 (Million Sq. Ft) 151
TABLE NO. 110. : Asia Pacific Window Coverings Market Revenue, By Distribution Channel, 2018 – 2023 (USD Million) 152
TABLE NO. 111. : Asia Pacific Window Coverings Market Revenue, By Distribution Channel, 2024 – 2032 (USD Million) 152
TABLE NO. 112. : Latin America Window Coverings Market Volume, By Country, 2018 – 2023 (Million Sq. Ft) 155
TABLE NO. 113. : Latin America Window Coverings Market Volume, By Country, 2024 – 2032 (Million Sq. Ft) 155
TABLE NO. 114. : Latin America Window Coverings Market Revenue, By Country, 2018 – 2023 (USD Million) 156
TABLE NO. 115. : Latin America Window Coverings Market Revenue, By Country, 2024 – 2032 (USD Million) 156
TABLE NO. 116. : Latin America Window Coverings Market Volume, By Type, 2018 – 2023 (Million Sq. Ft) 157
TABLE NO. 117. : Latin America Window Coverings Market Volume, By Type, 2024 – 2032 (Million Sq. Ft) 157
TABLE NO. 118. : Latin America Window Coverings Market Revenue, By Type, 2018 – 2023 (USD Million) 158
TABLE NO. 119. : Latin America Window Coverings Market Revenue, By Type, 2024 – 2032 (USD Million) 158
TABLE NO. 120. : Latin America Window Coverings Market Volume, By Application, 2018 – 2023 (Million Sq. Ft) 159
TABLE NO. 121. : Latin America Window Coverings Market Volume, By Application, 2024 – 2032 (Million Sq. Ft) 159
TABLE NO. 122. : Latin America Window Coverings Market Revenue, By Application, 2018 – 2023 (USD Million) 160
TABLE NO. 123. : Latin America Window Coverings Market Revenue, By Application, 2024 – 2032 (USD Million) 160
TABLE NO. 124. : Latin America Window Coverings Market Volume, By Installation, 2018 – 2023 (Million Sq. Ft) 161
TABLE NO. 125. : Latin America Window Coverings Market Volume, By Installation, 2024 – 2032 (Million Sq. Ft) 161
TABLE NO. 126. : Latin America Window Coverings Market Revenue, By Installation, 2018 – 2023 (USD Million) 162
TABLE NO. 127. : Latin America Window Coverings Market Revenue, By Installation, 2024 – 2032 (USD Million) 162
TABLE NO. 128. : Latin America Window Coverings Market Volume, By Technology, 2018 – 2023 (Million Sq. Ft) 163
TABLE NO. 129. : Latin America Window Coverings Market Volume, By Technology, 2024 – 2032 (Million Sq. Ft) 163
TABLE NO. 130. : Latin America Window Coverings Market Revenue, By Technology, 2018 – 2023 (USD Million) 164
TABLE NO. 131. : Latin America Window Coverings Market Revenue, By Technology, 2024 – 2032 (USD Million) 164
TABLE NO. 132. : Latin America Window Coverings Market Volume, By Distribution Channel, 2018 – 2023 (Million Sq. Ft) 165
TABLE NO. 133. : Latin America Window Coverings Market Volume, By Distribution Channel, 2024 – 2032 (Million Sq. Ft) 165
TABLE NO. 134. : Latin America Window Coverings Market Revenue, By Distribution Channel, 2018 – 2023 (USD Million) 166
TABLE NO. 135. : Latin America Window Coverings Market Revenue, By Distribution Channel, 2024 – 2032 (USD Million) 166
TABLE NO. 136. : Middle East Window Coverings Market Volume, By Country, 2018 – 2023 (Million Sq. Ft) 169
TABLE NO. 137. : Middle East Window Coverings Market Volume, By Country, 2024 – 2032 (Million Sq. Ft) 169
TABLE NO. 138. : Middle East Window Coverings Market Revenue, By Country, 2018 – 2023 (USD Million) 170
TABLE NO. 139. : Middle East Window Coverings Market Revenue, By Country, 2024 – 2032 (USD Million) 170
TABLE NO. 140. : Middle East Window Coverings Market Volume, By Type, 2018 – 2023 (Million Sq. Ft) 171
TABLE NO. 141. : Middle East Window Coverings Market Volume, By Type, 2024 – 2032 (Million Sq. Ft) 171
TABLE NO. 142. : Middle East Window Coverings Market Revenue, By Type, 2018 – 2023 (USD Million) 172
TABLE NO. 143. : Middle East Window Coverings Market Revenue, By Type, 2024 – 2032 (USD Million) 172
TABLE NO. 144. : Middle East Window Coverings Market Volume, By Application, 2018 – 2023 (Million Sq. Ft) 173
TABLE NO. 145. : Middle East Window Coverings Market Volume, By Application, 2024 – 2032 (Million Sq. Ft) 173
TABLE NO. 146. : Middle East Window Coverings Market Revenue, By Application, 2018 – 2023 (USD Million) 174
TABLE NO. 147. : Middle East Window Coverings Market Revenue, By Application, 2024 – 2032 (USD Million) 174
TABLE NO. 148. : Middle East Window Coverings Market Volume, By Installation, 2018 – 2023 (Million Sq. Ft) 175
TABLE NO. 149. : Middle East Window Coverings Market Volume, By Installation, 2024 – 2032 (Million Sq. Ft) 175
TABLE NO. 150. : Middle East Window Coverings Market Revenue, By Installation, 2018 – 2023 (USD Million) 176
TABLE NO. 151. : Middle East Window Coverings Market Revenue, By Installation, 2024 – 2032 (USD Million) 176
TABLE NO. 152. : Middle East Window Coverings Market Volume, By Technology, 2018 – 2023 (Million Sq. Ft) 177
TABLE NO. 153. : Middle East Window Coverings Market Volume, By Technology, 2024 – 2032 (Million Sq. Ft) 177
TABLE NO. 154. : Middle East Window Coverings Market Revenue, By Technology, 2018 – 2023 (USD Million) 178
TABLE NO. 155. : Middle East Window Coverings Market Revenue, By Technology, 2024 – 2032 (USD Million) 178
TABLE NO. 156. : Middle East Window Coverings Market Volume, By Distribution Channel, 2018 – 2023 (Million Sq. Ft) 179
TABLE NO. 157. : Middle East Window Coverings Market Volume, By Distribution Channel, 2024 – 2032 (Million Sq. Ft) 179
TABLE NO. 158. : Middle East Window Coverings Market Revenue, By Distribution Channel, 2018 – 2023 (USD Million) 180
TABLE NO. 159. : Middle East Window Coverings Market Revenue, By Distribution Channel, 2024 – 2032 (USD Million) 180
TABLE NO. 160. : Africa Window Coverings Market Volume, By Country, 2018 – 2023 (Million Sq. Ft) 183
TABLE NO. 161. : Africa Window Coverings Market Volume, By Country, 2024 – 2032 (Million Sq. Ft) 183
TABLE NO. 162. : Africa Window Coverings Market Revenue, By Country, 2018 – 2023 (USD Million) 184
TABLE NO. 163. : Africa Window Coverings Market Revenue, By Country, 2024 – 2032 (USD Million) 184
TABLE NO. 164. : Africa Window Coverings Market Volume, By Type, 2018 – 2023 (Million Sq. Ft) 185
TABLE NO. 165. : Africa Window Coverings Market Volume, By Type, 2024 – 2032 (Million Sq. Ft) 185
TABLE NO. 166. : Africa Window Coverings Market Revenue, By Type, 2018 – 2023 (USD Million) 186
TABLE NO. 167. : Africa Window Coverings Market Revenue, By Type, 2024 – 2032 (USD Million) 186
TABLE NO. 168. : Africa Window Coverings Market Volume, By Application, 2018 – 2023 (Million Sq. Ft) 187
TABLE NO. 169. : Africa Window Coverings Market Volume, By Application, 2024 – 2032 (Million Sq. Ft) 187
TABLE NO. 170. : Africa Window Coverings Market Revenue, By Application, 2018 – 2023 (USD Million) 188
TABLE NO. 171. : Africa Window Coverings Market Revenue, By Application, 2024 – 2032 (USD Million) 188
TABLE NO. 172. : Africa Window Coverings Market Volume, By Installation, 2018 – 2023 (Million Sq. Ft) 189
TABLE NO. 173. : Africa Window Coverings Market Volume, By Installation, 2024 – 2032 (Million Sq. Ft) 189
TABLE NO. 174. : Africa Window Coverings Market Revenue, By Installation, 2018 – 2023 (USD Million) 190
TABLE NO. 175. : Africa Window Coverings Market Revenue, By Installation, 2024 – 2032 (USD Million) 190
TABLE NO. 176. : Africa Window Coverings Market Volume, By Technology, 2018 – 2023 (Million Sq. Ft) 191
TABLE NO. 177. : Africa Window Coverings Market Volume, By Technology, 2024 – 2032 (Million Sq. Ft) 191
TABLE NO. 178. : Africa Window Coverings Market Revenue, By Technology, 2018 – 2023 (USD Million) 192
TABLE NO. 179. : Africa Window Coverings Market Revenue, By Technology, 2024 – 2032 (USD Million) 192
TABLE NO. 180. : Africa Window Coverings Market Volume, By Distribution Channel, 2018 – 2023 (Million Sq. Ft) 193
TABLE NO. 181. : Africa Window Coverings Market Volume, By Distribution Channel, 2024 – 2032 (Million Sq. Ft) 193
TABLE NO. 182. : Africa Window Coverings Market Revenue, By Distribution Channel, 2018 – 2023 (USD Million) 194
TABLE NO. 183. : Africa Window Coverings Market Revenue, By Distribution Channel, 2024 – 2032 (USD Million) 194

Frequently Asked Questions

What is the projected growth of the global window coverings market?

The global window coverings market is expected to grow from USD 12,432.71 million in 2023 to USD 19,620.39 million by 2032, with a CAGR of 5.20%.

What are the key drivers of the global window coverings market?

Key drivers include increasing consumer interest in home improvement, rising demand for energy-efficient and smart window coverings, and the growing preference for eco-friendly materials.

Which regions dominate the global window coverings market?

North America and Europe dominate the market due to high consumer awareness and advanced technological adoption, while Asia-Pacific is expected to witness significant growth.

How is the commercial segment performing in the window coverings market?

The commercial segment is experiencing significant growth as businesses invest in window coverings to enhance energy efficiency, comfort, and aesthetics in offices, hotels, and retail spaces.

What are the major trends in the window coverings market?

Major trends include the rise of smart and automated window coverings and the growing preference for sustainable and eco-friendly materials among consumers.

Composite Doors and Windows Market

Published:
Report ID: 16444

Cat Window Perches and Wall Shelves Market

Published:
Report ID: 73904

Automotive Window Regulator Market

Published:
Report ID: 72957

Windows Films Market

Published:
Report ID: 67048

Window Alarms Market

Published:
Report ID: 12213

Asia Pacific Windows and Doors Market

Published:
Report ID: 35894

Insulating Glass Window Market

Published:
Report ID: 33781

Robotic Window Cleaners Market

Published:
Report ID: 31735

Building Window Cleaning Systems Market

Published:
Report ID: 17149

Turkey Women Apparel Market

Published:
Report ID: 80361

Turkey Plus Size Clothing Market

Published:
Report ID: 80340

Augmented Reality Glasses Market

Published:
Report ID: 80341

South Korea Hotel Gift Cards Market

Published:
Report ID: 80337

Japan Women Apparel Market

Published:
Report ID: 80318

Japan Plus Size Clothing Market

Published:
Report ID: 80313

Italy Personalized Gift Card Market

Published:
Report ID: 80303

Bentonite Cat Litter Market

Published:
Report ID: 80297

Europe Bentonite Cat Litter Market

Published:
Report ID: 80291

China Personalized Gift Card Market

Published:
Report ID: 80284

China Hotel Gift Cards Market

Published:
Report ID: 80280

Brazil SAVE Tourism Market

Published:
Report ID: 80266

Purchase Options

The report comes as a view-only PDF document, optimized for individual clients. This version is recommended for personal digital use and does not allow printing.
$4699

To meet the needs of modern corporate teams, our report comes in two formats: a printable PDF and a data-rich Excel sheet. This package is optimized for internal analysis and multi-location access, making it an excellent choice for organizations with distributed workforce.
$5699

The report will be delivered in printable PDF format along with the report’s data Excel sheet. This license offers 100 Free Analyst hours where the client can utilize Credence Research Inc.’s research team. It is highly recommended for organizations seeking to execute short, customized research projects related to the scope of the purchased report.
$7699

Credence Staff 3

MIKE, North America

Support Staff at Credence Research

KEITH PHILLIPS, Europe

Smallform of Sample request

Report delivery within 24 to 48 hours

– Other Info –

What people say?-

User Review

I am very impressed with the information in this report. The author clearly did their research when they came up with this product and it has already given me a lot of ideas.

Jana Schmidt
CEDAR CX Technologies

– Connect with us –

Phone

+91 6232 49 3207


support

24/7 Research Support


sales@credenceresearch.com

– Research Methodology –

Going beyond the basics: advanced techniques in research methodology

– Trusted By –

Pepshi, LG, Nestle
Motorola, Honeywell, Johnson and johnson
LG Chem, SIEMENS, Pfizer
Unilever, Samsonite, QIAGEN

Request Sample