Market Overview
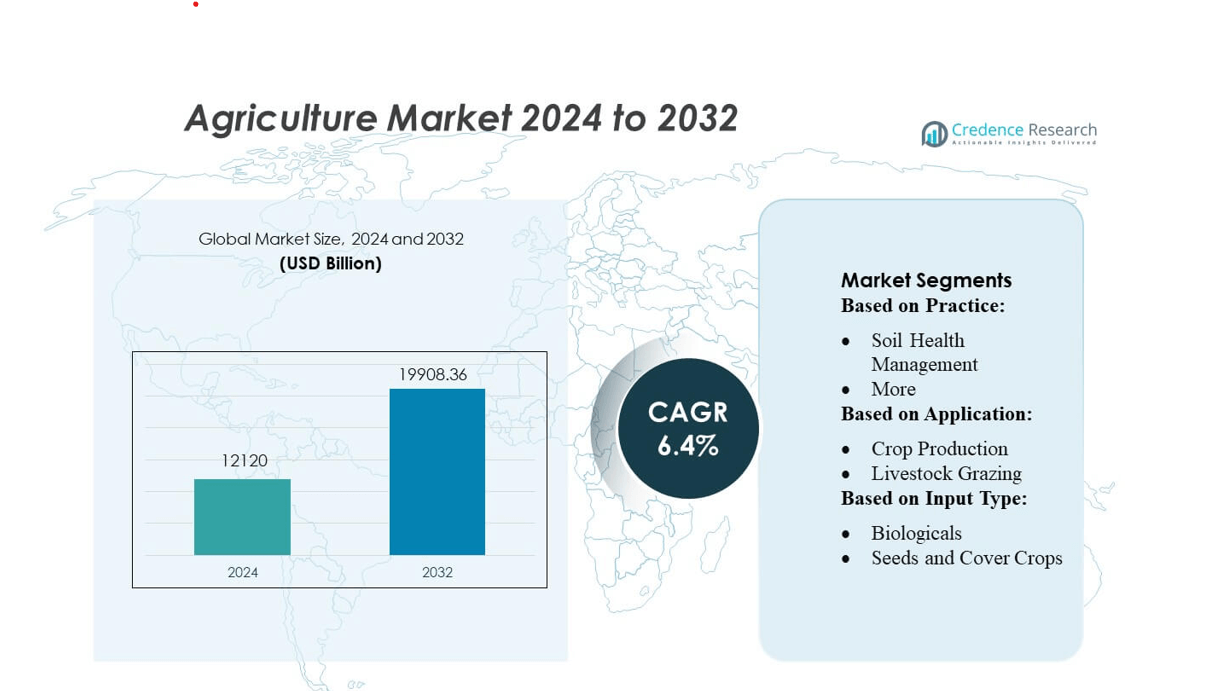
Agriculture Market size was valued USD 12120 billion in 2024 and is anticipated to reach USD 19908.36 billion by 2032, at a CAGR of 6.4% during the forecast period.
| REPORT ATTRIBUTE |
DETAILS |
| Historical Period |
2020-2023 |
| Base Year |
2024 |
| Forecast Period |
2025-2032 |
| Agriculture Market Size 2024 |
USD 12120 billion |
| Agriculture Market, CAGR |
6.4% |
| Agriculture Market Size 2032 |
USD 19908.36 billion |
The agriculture market is shaped by a mix of established agribusinesses, innovative biological input providers, and fast-growing digital agriculture platforms that collectively drive advancements in productivity, sustainability, and climate resilience. These players focus on expanding precision farming tools, improving seed performance, and developing low-toxicity biological solutions to meet evolving regulatory and consumer expectations. Asia-Pacific leads the global agriculture market with an exact market share of 33%, supported by extensive crop production, large farming populations, and strong government initiatives promoting modern farming practices. The region’s rapid adoption of irrigation technologies, hybrid seeds, and digital advisory systems reinforces its dominant position in the global landscape.
Market Insights
- The agriculture market was valued at USD 12,120 billion in 2024 and is projected to reach USD 19,908.36 billion by 2032 at a 4% CAGR, driven by rising demand for sustainable production and advanced farming technologies.
- Market growth is supported by strong drivers such as expanding precision agriculture adoption, increasing use of biological inputs, and greater emphasis on climate-smart practices that enhance soil health and resource efficiency.
- Key trends include rapid digitalization, wider integration of AI-based analytics, accelerated use of automation and robotics, and growing investment in hybrid seeds and water-efficient systems.
- Competitive intensity rises as global agribusinesses and agri-tech innovators compete in high-growth segments, with biological inputs capturing a rising share and digital platforms expanding across large and small farms.
- Asia-Pacific leads regional performance with 33% market share, while crop production remains the dominant segment globally, supported by hybrid seed demand, expanding irrigation coverage, and government-led modernization programs.
Access crucial information at unmatched prices!
Request your sample report today & start making informed decisions powered by Credence Research Inc.!
Download Sample
Market Segmentation Analysis:
By Practice
Soil Health Management dominates the agriculture market, accounting for an estimated 38–42% market share, driven by rising adoption of regenerative practices and increased government incentives for sustainable farming. Farmers invest in soil testing, organic amendments, reduced tillage, and microbial soil enhancers to improve nutrient retention and boost long-term productivity. This segment benefits from growing concerns about soil degradation, carbon loss, and declining yields. Adoption accelerates as precision agriculture tools—such as in-field sensors and digital soil maps—enable better decision-making and measurable improvements in soil organic carbon and moisture balance.
- For instance, Ecorobotix SA’s ARA sprayer uses centimeter-precise AI detection (6 × 6 cm) and applies micro-doses of herbicide, cutting input use by up to 95% per application.
By Application
Crop Production is the leading application segment, holding approximately 55–60% market share, supported by expanding global food demand and investments in yield-enhancing technologies. Farmers increasingly integrate climate-smart practices, such as diversified crop rotations, precision irrigation, and remote-sensing-based monitoring, to optimize inputs and reduce waste. The segment’s growth is driven by stronger focus on drought resilience, pest resistance, and higher profitability per acre. Additionally, digital farm management platforms accelerate adoption by providing real-time data for crop planning, nutrient scheduling, and predictive yield modeling.
- For instance, Cargill Nutrition System, powered by a Near-Infrared Reflectance (NIR) database of roughly 2 million samples across more than 200 feed ingredients, generating over 10 million nutrient-analysis results annually.
By Input Type
Seeds and Cover Crops represent the dominant input type, capturing 40–45% market share, propelled by the demand for high-performance seed varieties and regenerative cover cropping systems. Producers prioritize seeds that offer improved germination rates, stress tolerance, and resistance to pests and diseases. Cover crops drive further adoption by enhancing soil fertility, reducing erosion, and increasing carbon sequestration. Market growth is reinforced by advancements in hybrid and bioengineered seed technologies, along with subsidy programs encouraging farmers to integrate cover crops to rebuild soil health and stabilize long-term production.
Key Growth Drivers
Rising Demand for Sustainable and Regenerative Farming
The agriculture market grows as farmers adopt regenerative practices to restore soil health, improve water efficiency, and enhance long-term productivity. Governments and global organizations increasingly support carbon-smart practices through subsidies, carbon credit programs, and sustainability-linked financing. Advancements in soil analytics, biological inputs, and precision application tools accelerate adoption by enabling measurable improvements in soil organic carbon and nutrient cycling. As food companies strengthen sustainability commitments across their supply chains, demand for climate-resilient agricultural practices continues to expand, reinforcing this driver’s long-term impact.
- For instance, Aker Technologies, Inc. developed its TrueCause™ drone system that uses AI-driven computer vision to assess in-season stress across a field, capturing disease, weeds, and fertility signals every 1 m², and enabling growers to identify stress zones early and reduce unnecessary input applications.
Expansion of Precision Agriculture Technologies
Precision agriculture accelerates market growth by enabling data-driven decision-making through sensors, drones, GPS-enabled farm equipment, and AI-based analytics platforms. Farmers improve yields, optimize fertilizer and pesticide use, and reduce operational costs through real-time monitoring and variable-rate application. As equipment automation and digital farm management tools become more affordable, adoption increases among large and mid-sized farms. The integration of satellite imaging, predictive modeling, and automated irrigation systems enhances resource efficiency, strengthening the segment’s role as a key driver of productivity and profitability in modern agriculture.
- For instance, Carbon Robotics’ LaserWeeder G2 unit, powered by its “Carbon AI” deep-learning system trained on a dataset of over 40 million labeled plants from three continents, now eliminates more than 15 billion weeds across over 250,000 acres, all while operating with sub-millimeter accuracy.
Increasing Global Food Demand and Crop Diversification
Population growth, rising incomes, and changing dietary patterns increase demand for cereals, oilseeds, fruits, vegetables, and high-protein crops. This drives farmers to expand cultivation areas, adopt higher-yielding varieties, and diversify into specialty crops. Advances in hybrid seeds, biotechnology, and climate-tolerant cultivars support consistent production despite environmental stressors. The push for year-round supply chains, combined with investments in greenhouse farming and controlled-environment agriculture, further strengthens output capacity. These factors collectively position rising global food demand as a major driver of agricultural market expansion.
Key Trends & Opportunities
Rapid Growth of Biological Inputs and Bio-based Solutions
The market experiences strong momentum toward biological fertilizers, biopesticides, and microbial soil enhancers as growers seek safer, residue-free alternatives to synthetic chemicals. This trend creates opportunities for companies developing microbial consortia, plant growth–promoting rhizobacteria, and bio-stimulant technologies. Regulatory support for low-toxicity inputs and consumer preference for organic produce further accelerate adoption. Advances in fermentation, encapsulation, and formulation technologies enhance product stability and efficacy, positioning biological inputs as one of the fastest-growing categories in the agriculture market.
- For instance, Indigo Ag, Inc. recently introduced biotrinsic® Nemora FP™, a Pseudomonas oryzihabitans–based seed treatment, which in trials achieved a 68% reduction in soybean-cyst-nematode egg hatch compared to untreated controls.
Digitalization and Data-Driven Farm Management
Digital platforms create significant opportunities by enabling farmers to monitor field conditions, automate operations, and reduce waste. Integration of machine learning, IoT sensors, and remote-sensing tools supports predictive analytics for crop health, pest outbreaks, and yield forecasting. As connectivity improves in rural regions, digital adoption accelerates across mid-sized farms. Cloud-based farm management systems help optimize input planning, labor allocation, and financial tracking. Companies offering interoperable digital ecosystems and equipment-to-platform integration gain a competitive edge in this expanding trend.
- For instance, Agreed.Earth triangulates data from satellite imagery of nitrous-oxide emissions, field-level nutrient billing records, and ground-based sensors to track nitrogen flow, achieving sub-field resolution (as fine as 10 m²) for N₂O hotspots. This granular insight lets farmers pinpoint fertilizer inefficiencies and reduce nitrous loss while improving soil health.
Climate-Resilient Agriculture and Water-Efficient Solutions
Growing climate variability creates opportunities for technologies that enhance resilience against drought, heat, and irregular rainfall. Adoption rises for drought-tolerant seed varieties, precision irrigation systems, and moisture-retaining soil amendments. Water scarcity strengthens demand for drip systems, sensor-controlled irrigation, and water recycling solutions. Governments and sustainability programs increasingly fund climate-resilient agritech innovations, while food companies integrate climate-risk mitigation into procurement strategies. These shifts position resilience technologies as a major growth opportunity for suppliers and technology providers.
Key Challenges
High Initial Investment and Technology Accessibility Gaps
Despite strong market potential, adoption of advanced agriculture technologies is hindered by high upfront costs for precision equipment, protected cultivation systems, and digital tools. Small and marginal farmers face financing constraints and limited access to credit, slowing technology penetration in developing regions. Gaps in digital literacy, fragmented supply chains, and inadequate rural infrastructure further restrict adoption. These barriers create uneven modernization across farming communities and limit the overall pace of transformation in the agriculture market.
Increasing Climate Risks and Environmental Uncertainty
Unpredictable weather patterns, extreme temperatures, and irregular rainfall intensify production risks for farmers. Climate change exacerbates pest and disease outbreaks, affecting crop yields and input requirements. Water scarcity, soil degradation, and nutrient depletion create additional operational challenges, especially for rainfed agricultural systems. Although climate-smart practices are emerging, widespread implementation remains inconsistent due to knowledge gaps and resource limitations. These environmental uncertainties continue to challenge productivity and long-term planning across global agriculture markets.
Regional Analysis
North America
North America holds approximately 28–30% of the global agriculture market, supported by large-scale commercial farming, advanced mechanization, and widespread adoption of precision agriculture technologies. The U.S. leads the region with strong investment in automation, biological inputs, and data-driven crop management platforms. Canada contributes through its expanding oilseed, pulses, and sustainable farming initiatives. High R&D spending, supportive federal programs, and strong agribusiness supply chains strengthen market performance. The region’s focus on climate-smart practices, soil restoration, and high-efficiency irrigation further enhances productivity and solidifies its dominant role in global agricultural innovation.
Europe
Europe accounts for roughly 22–24% of the agriculture market, driven by strict sustainability regulations and strong government support for regenerative and organic practices. Countries such as France, Germany, and Spain lead adoption of biological inputs, low-emission farming, and digital compliance tools aligned with the EU’s Farm to Fork Strategy. High emphasis on traceability, carbon reduction, and biodiversity protection accelerates investment in smart irrigation, automation, and environmental monitoring technologies. The region’s mature agri-food processing industry and strong research institutions reinforce steady growth while maintaining strict environmental standards across production systems.
Asia-Pacific
Asia-Pacific dominates the global market with an estimated 32–34% market share, driven by large-scale crop production in China, India, and Southeast Asia. Rapid population growth, rising food demand, and expanding government subsidies for modern farming practices support strong regional momentum. Adoption accelerates for hybrid seeds, drip irrigation, and low-cost precision tools tailored for smallholder farmers. Investment in agri-tech startups, greenhouse farming, and climate-resilient crop varieties strengthens productivity. Despite fragmented farm structures, increased digitization and mechanization continue to push the region toward higher efficiency and long-term sustainability.
Latin America
Latin America holds around 10–12% of the agriculture market, anchored by Brazil, Argentina, and Mexico, which serve as major global exporters of soybeans, corn, sugarcane, and beef. Large arable land availability and favorable climate conditions drive high-yield commercial farming. Adoption of no-till practices, soil restoration systems, and biological inputs is increasing as producers focus on long-term land productivity. Investments in smart irrigation, satellite-based monitoring, and traceability strengthen operational efficiency. However, infrastructure gaps and climate vulnerabilities influence regional performance, though export-oriented agribusiness continues to fuel steady growth.
Middle East & Africa
The Middle East & Africa region represents 6–8% of the market, shaped by rising food security initiatives, expanding irrigation infrastructure, and rapid adoption of controlled-environment agriculture. GCC countries invest heavily in hydroponics, vertical farming, and desalination-supported irrigation to reduce dependence on imports. In Africa, growth stems from increased adoption of improved seeds, mechanization, and mobile-based agronomy advisory services. Governments and development agencies support climate-resilient farming, soil enhancement, and water conservation technologies. Despite limited resources and climate stress, technological upgrades and policy reforms continue to elevate regional agricultural output.
Market Segmentations:
By Practice:
- Soil Health Management
- More
By Application:
- Crop Production
- Livestock Grazing
By Input Type:
- Biologicals
- Seeds and Cover Crops
By Geography
- North America
- Europe
- Germany
- France
- U.K.
- Italy
- Spain
- Rest of Europe
- Asia Pacific
- China
- Japan
- India
- South Korea
- South-east Asia
- Rest of Asia Pacific
- Latin America
- Brazil
- Argentina
- Rest of Latin America
- Middle East & Africa
- GCC Countries
- South Africa
- Rest of the Middle East and Africa
Competitive Landscape
The competitive landscape of the agriculture market features a diverse ecosystem of innovators and established players, including Ecorobotix SA, Continuum Ag, Cargill, Incorporated, Aker Technologies, Inc., Ruumi, Carbon Robotics, Indigo Ag, Inc., Agreed.Earth, Astanor Ventures, and Biotrex. The agriculture market continues to evolve, driven by rapid advancements in digital technologies, biological inputs, and climate-resilient farming solutions. Companies increasingly focus on integrating precision agriculture tools, automation, and data analytics to enhance productivity, reduce input costs, and improve environmental performance. Innovation in soil health management, carbon-smart farming, and biological crop protection intensifies competition as producers seek scalable and sustainable alternatives to conventional methods. Partnerships between agritech startups, research institutions, and large agribusinesses are expanding, enabling faster product development and broader adoption. Market players differentiate themselves through advanced analytics, climate-adaptive inputs, and end-to-end farm management platforms that support traceability and long-term value creation.
Shape Your Report to Specific Countries or Regions & Enjoy 30% Off!
Key Player Analysis
- Ecorobotix SA
- Continuum Ag
- Cargill, Incorporated
- Aker Technologies, Inc.
- Ruumi
- Carbon Robotics
- Indigo Ag, Inc.
- Earth
- Astanor Ventures
- Biotrex
Recent Developments
- In May 2025, The PepsiCo Foundation has initiated a new programme called VivaOliva, aimed at assisting smallholder olive oil farmers in Jaén, Spain, in adopting regenerative agricultural practices. With a funding commitment of the initiative seeks to enhance the sustainability and profitability of olive oil production.
- In April 2025, Bayer is launched its first tranche of carbon credits from thousands of Indian rice farmers adopting regenerative practices like direct seeded rice (DSR) farming. The company is working with Gold Standard, a leading registry in the voluntary carbon market, to validate, certify, and issue up to 2,50,000 tons of carbon dioxide equivalent (CO2e) credits.
- In December 2024, Mars, Incorporated formed multi-year partnerships with suppliers, including ADM and Cargill, to advance regenerative agriculture within its pet nutrition operations across Europe. These collaborations aim to support farmers in countries such as Poland, Hungary, and the UK in adopting regenerative practices like crop rotation, reduced tillage, and cover crops.
- In April 2024, Nestlé Purina and Cargill launched a partnership to use regenerative agriculture in Purina’s North American corn and soy supply chains. The collaboration aims to improve soil health and reduce the carbon footprint of Purina’s dry pet food by implementing practices like cover cropping and no-tillage farming across more than 200,000 acres in the Midwest
Report Coverage
The research report offers an in-depth analysis based on Practice, Application, Input Type and Geography. It details leading market players, providing an overview of their business, product offerings, investments, revenue streams, and key applications. Additionally, the report includes insights into the competitive environment, SWOT analysis, current market trends, as well as the primary drivers and constraints. Furthermore, it discusses various factors that have driven market expansion in recent years. The report also explores market dynamics, regulatory scenarios, and technological advancements that are shaping the industry. It assesses the impact of external factors and global economic changes on market growth. Lastly, it provides strategic recommendations for new entrants and established companies to navigate the complexities of the market.
Future Outlook
- The agriculture market will increasingly adopt precision technologies that improve yields and optimize resource use.
- Biological inputs will gain wider acceptance as growers shift toward low-residue and environmentally sustainable solutions.
- Climate-resilient crop varieties and water-efficient systems will play a central role in mitigating climate risks.
- Digital farm management platforms will expand, enabling data-driven decisions and stronger supply chain traceability.
- Robotics and automation will streamline labor-intensive operations and address workforce shortages.
- Regenerative farming practices will grow as governments and companies prioritize soil health and carbon reduction.
- Controlled-environment agriculture will rise to meet demand for year-round, high-quality food production.
- Investments in agri-tech startups will accelerate innovation across inputs, analytics, and automation.
- Public–private partnerships will strengthen efforts to modernize farming systems in emerging markets.
- Global food security initiatives will drive adoption of scalable, climate-smart agricultural solutions.


