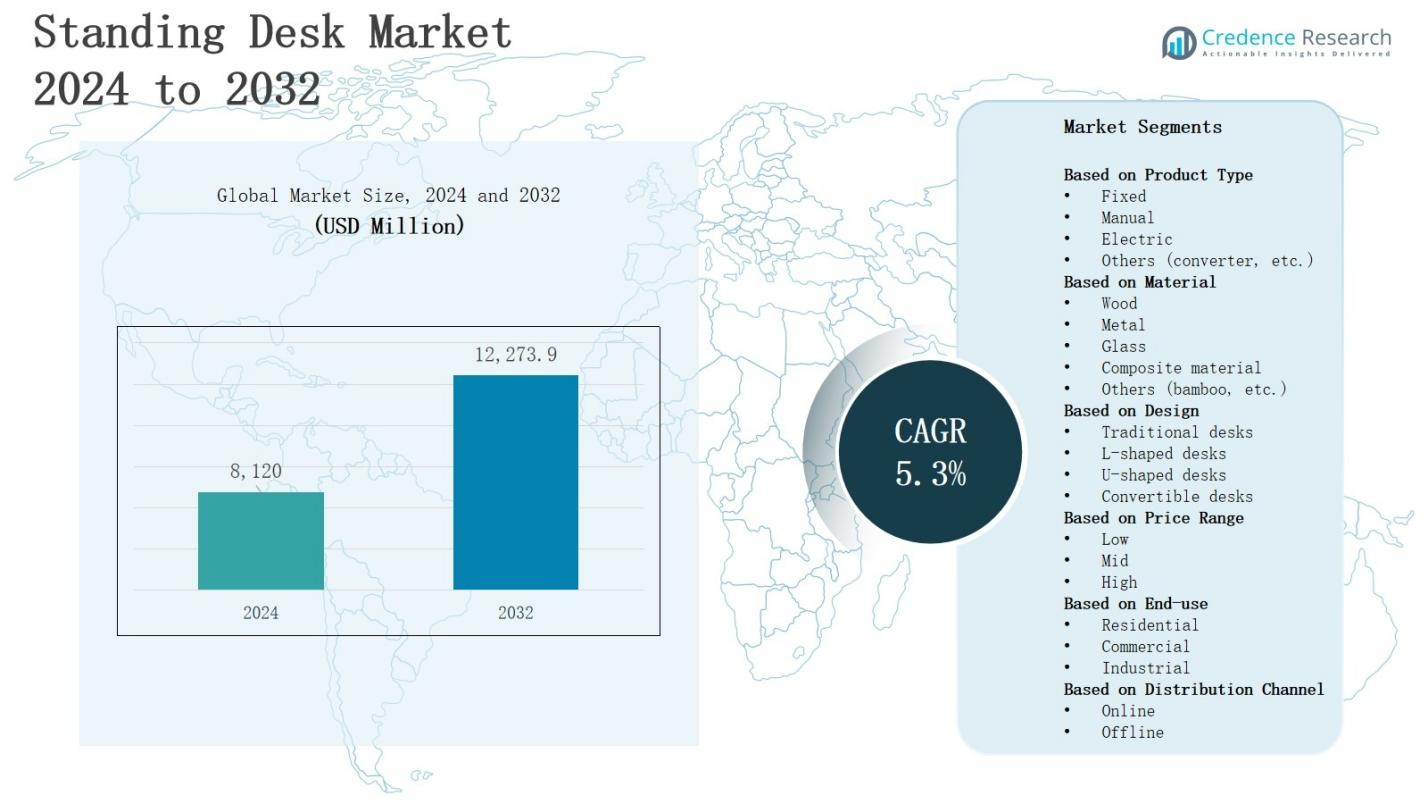
Home » Consumer Goods » Standing Desks Market

Standing Desks Market By Product Type (Fixed Standing Desk, Mechanically Adjusted Desk, Electrically Adjusted Desk, Converter Standing Desk) By End Use (Household, Commercial) By Distribution Channel (Onlin By Type (Standard (Fixed) Standing Desks, Mechanical Adjustable Standing Desks, Electrically Adjustable Standing Desk, Converter Standing Desk), By Application (Corporate Office, Education, Residential, Healthcare, Manufacturing) – Growth, Future Prospects And Competitive Analysis 2016 – 2028

Price: $4999

Published: | Report ID: 9700 | Report Format : PDF

Why the need for Standing Desks increased during covid 19?

The COVID-19 era had a negative impact on market growth both during and after that time. The growing demand for contemporary height-adjustable workstations is driving the standing desk industry. Increasing the need for office spaces, including co-working spaces, is driving the standing desk business. More positions and office space are available as a result of the rise in the number of multinational firms operating on a global scale. People’s concerns about back pain contributed to the growth of the standing desk market. Most people were quite concerned about the backache problem because they spent so much time sitting down at their jobs.

What is the Market Size of Standing Desks in terms of value?

The stand desk market is expected to grow significantly over the next few years, at a CAGR of 7.20 percent. The market for standing desks was valued at USD 6,744.49 million in 2022, and by 2030, it is expected to be worth USD 10,971.58 million. The demand for standing desks is anticipated to rise sharply in the upcoming years. During the forecast period between 2022 and 2030, it is anticipated to create revenue opportunities worth USD 4227.09 million for the major industry participants.

Standing Desks Market


How ergonomic design helped the Standing Desks market growth?

This is mostly because there is a severe global shortage of standing desks and a high demand for them. Because Canadian farmers switching to alternative crops like cereals due to higher input costs and Canada’s crushing capabilities, the prices of Standing Desks remained high in the North American region. In addition, standing desk pricing displayed fluctuating behavior due to conflicting market attitudes in the Asia Pacific region. 

Design Element 2

Access crucial information at unmatched prices!

Request your free sample report today & start making informed decisions powered by Credence Research!

Download Free Sample
CTA Design Element 3

Interesting Facts about Standing Desks Industry

  • The current height-adjustable desk market is propelled by the product’s ability to reduce downtime, enhance performance, and assist prevent avoidable back disorders. The market for contemporary height-adjustable workstations, which is anticipated to increase during the forecast period, is being driven by numerous advantages for both businesses and employees.
  • Maintenance will be a significant barrier to the existing height-adjustable desk market, and numerous technological issues are projected to be the main limitations on the growth of the standing desks sector globally. Standing Desk Comfort Mats’ global expansion is significantly hampered.
  • In terms of volume and value, the Asia Pacific region dominated the global market for standing desks in 2021. It is anticipated that this dominance will last throughout the forecast period.
  • The demand for mechanically adjustable standing desks will expand during the forecast period as customers worldwide become more accustomed to buying organic products.

Who are the Top 10 players/companies in the Standing Desks market in terms of value?

The value of the global Standing Desks market includes Steelcase, Ergotron, Herman Miller, Okamura, Haworth, HNI Corporation, Humanscale, Workrite Ergonomics, Global Furniture Group, and Qidong Vision Mounts Manufacturing Co., Ltd.. These key companies are concentrating on new product development and technological innovation to increase their Standing Desk production and grab a piece of the market that is competitive worldwide. In addition, some regional and national players are making significant investments to broaden their product lines and boost sales. For instance, starting in September 2021, Apple’s new Apple Park headquarters in California will provide all of its employees with desks that can be raised to a comfortable height when they want to stand and work. If you can stand for a while, then sit, and so on, it will be significantly healthier for your lifestyle.

On the other hand, DeskMakers will launch the Ascend line of height-adjustable desks in February 2020. In addition, employees are once more seeking privacy as a result of the changing employment environment. The most recent series from DesksMakers tries to reconcile this growing desire for more privacy with the adaptability provided by open workstations.

Standing Desk Market

Who are the Top 10 Countries in the Standing Desks Market?

In the global Standing Desks market, the major countries are China, the U.S., India, Canada, France, the U.K., Germany, Russia, Switzerland, and Japan. With a volume share of more than 40% in the global market for standing desks in 2021, China is the leading producer and consumer of these devices. The market in developed nations is also being driven by a rise in the demand for organic standing desks and consumer health consciousness. Additionally, the market for standing desks is anticipated to grow dramatically in the coming years as young people in developing nations like India become more aware of them.

Which is the Key Product Area of the Standing Desks Market?

The main uses for standing desks include converter standing desks, mechanically adjustable desks, and electrically adjustable desks. Because they can be easily adjusted for height, mechanically adjustable standing desks are suitable for a larger range of users. As a result, they dominate the global market for standing desk comfort mats. Since mechanical standing workstations are less expensive than electrically adjustable workstations, they are fairly common on the market. In addition, the health concerns presented by employees’ hunched-over positions at work are worrying businesses more and more. Due to this, the overall price of standing desk comfort mats has significantly climbed in recent years.

Additionally, people’s concerns about their daily routines, posture, and health while at work are growing, which is driving up demand for standing desk comfort mats. The market has consequently expanded quickly. A few of the main factors propelling market expansion for the global standing desk comfort mat are decreased risks of obesity, diabetes, back pain issues, heart disease, improved optimism, and increased job productivity.

What are the Major Driving Factors for Standing Desks Market?

The primary factors driving the market for height-adjustable desks today are their ability to reduce downtime, improve performance, and prevent avoidable back problems. Numerous advantages for both employers and employees are what are driving the market for contemporary height-adjustable desks and are expected to boost demand during the projected period.

What are the Major Restraints for the Standing Desks Market?

The key restraint of the global Standing Desks market, which is projected to hamper the market growth, includes the different technological challenges. Maintenance will be the key limitation for the modern height-adjustable desk market. The high cost of products is a major stumbling block to the global growth of standing desk comfort mats. In addition, a lack of public understanding of the benefits of comfort mats limits the market’s growth.

Which Region Dominated the World Standing Desks Market?

In 2021, Asia Pacific dominated the global Standing Desks market and accounted for more than 40% of the market revenue share in terms of value as well as volume. Due to rising public awareness about health and corporate adoption of ergonomic furniture, Asia-Pacific is expected to grow at a fast pace in the worldwide standing desk comfort mat market. The need for flexible comfort mats has created a number of opportunities for manufacturers to create comfort mats with innovative characteristics that provide greater comfort. Increased awareness of people’s health in the workplace and the benefits of comfort mats in increasing people’s work productivity have prompted companies to develop new products. Additionally, the increased market competition brought on by the introduction of small and medium-sized enterprises has compelled current companies to increase their R&D spending in order to better serve their clientele. Even standing meetings have grown in popularity in recent years, not simply because productivity is increased; standing meetings are also considered healthier. The study finds that because the hip, knee, and neck muscles are locked while we sit, we are more likely to experience these pains. Therefore, the stand-up desks market is expanding to prevent these ailments.

Shape Your Report to Specific Countries or Regions & Enjoy 30% Off!

The largest market share is in North America due to individuals’ growing awareness and motivation toward their health. Additionally, many standing desk comfort mat manufacturers are situated in North America.

Segmentation of Global Standing Desks Market-

Global Standing Desks Market –By Product Type

  • Fixed Standing Desk
  • Mechanically Adjusted Desk
  • Electrically Adjusted Desk
  • Converter Standing Desk

 Global Standing Desks Market – By End Use

  • Household
  • Commercial

Global Standing Desks Market – By Distribution Channel

  • Online
  • Offline

CHAPTER NO. 1 : INTRODUCTION 33
1.1. Report Description 33
1.1.1. Purpose of the Report 33
1.1.2. USP & Key Offerings 33
1.2. Key Benefits for Stakeholders 33
1.3. Target Audience 34
1.4. Report Scope 35

CHAPTER NO. 2 : EXECUTIVE SUMMARY 37
2.1. Standing Desks Market Snapshot 37
2.2. Global Standing Desks Market, 2017 – 2022 (K Units) (USD Million) 39
2.3. Insights from Primary Respondents 39

CHAPTER NO. 3 : IMPACT ANALYSIS OF COVID 19 & RUSSIA-UKRAINE WAR ON STANDING DESKS MARKET 41
3.1. Impact Assessment of COVID-19 Pandemic, By Region 41
3.1.1. Supply chain disruptions 41
3.1.2. Demand fluctuations 41
3.1.3. Shift in product mix 41
3.1.4. Reduced industrial activity 41
3.1.5. Temporary disruptions and delays 41
3.1.6. Shift in focus towards essential services 41
3.2. Russia-Ukraine War Impacts 42
3.2.1. Uncertainty and economic instability 42
3.2.2. Supply chain disruptions 42
3.2.3. Regional market shifts 42
3.2.4. Shift in government priorities 42

CHAPTER NO. 4 : STANDING DESKS MARKET – INDUSTRY ANALYSIS 43
4.1. Introduction 43
4.2. Market Drivers 44
4.2.1. Driving Factor 1 Analysis 44
4.2.2. Driving Factor 2 Analysis 45
4.3. Market Restraints 46
4.3.1. Restraining Factor Analysis 46
4.4. Market Opportunities 47
4.4.1. Market Opportunity Analysis 47
4.5. Porter’s Five Forces Analysis 48
4.6. Value Chain Analysis 49
4.7. Buying Criteria 50

CHAPTER NO. 5 : IMPORT EXPORT ANALYSIS 51
5.1. Import Analysis by Region 51
5.1.1. Global Standing Desks Market Import Volume/Revenue, By Region, 2017 – 2022 51
5.2. Export Analysis by Region 52
5.2.1. Global Standing Desks Market Export Volume/Revenue, By Region, 2017 – 2022 52

CHAPTER NO. 6 : DEMAND SUPPLY ANALYSIS 53
6.1. Demand Analysis by Region 53
6.1.1. Global Standing Desks Market Demand Volume/Revenue, By Region, 2017 – 2022 53
6.2. Supply Analysis by Region 54
6.2.1. Global Standing Desks Market Supply Volume/Revenue, By Region, 2017 – 2022 54

CHAPTER NO. 7 : PRODUCTION ANALYSIS 55
7.1. Production Analysis by Region 55
7.1.1. Global Standing Desks Market Production, By Region, 2017 – 2022 55
7.1.2. Global Standing Desks Market Production Volume, By Region, 2017 – 2022 (K Units) 55

CHAPTER NO. 8 : PRICE ANALYSIS 56
8.1. Price Analysis by Region 56
8.1.1. Global Standing Desks Market Price, By Region, 2017 – 2022 56
8.1.2. Global Type Market Price, By Region, 2017 – 2022 56
8.2. Price Analysis by Type 57
8.2.1. Global Standing Desks Market Price, By Type, 2017 – 2022 57
8.2.2. Global Type Market Price, By Type, 2017 – 2022 57

CHAPTER NO. 9 : RAW MATERIALS ANALYSIS 58
9.1. Key Raw Materials and Suppliers 58
9.2. Key Raw Materials Price Trend 58

CHAPTER NO. 10 : MANUFACTURING COST ANALYSIS 59
10.1. Manufacturing Cost Analysis 59
10.1.1. Manufacturing Cost Analysis 59
10.2. Manufacturing Process 59
10.2.1. Manufacturing Process 59

CHAPTER NO. 11 : ANALYSIS COMPETITIVE LANDSCAPE 60
11.1. Company Market Share Analysis – 2022 60
11.1.1. Global Standing Desks Market: Company Market Share, by Volume, 2022 60
11.1.2. Global Standing Desks Market: Company Market Share, by Revenue2022 60
11.1.3. Global Standing Desks Market: Top 6 Company Market Share, by Revenue2022 61
11.1.4. Global Standing Desks Market: Top 3 Company Market Share, by Revenue2022 61
11.2. Global Standing Desks Market Company Volume Market Share, 2022 62
11.2.1 Global Standing Desks Market Company Revenue Market Share, 2022 63
11.3. Company Assessment Metrics, 2022 64
11.3.1. Stars 64
11.3.2. Emerging Leaders 64
11.3.3. Pervasive Players 64
11.3.4. Participants 64
11.4. Start-ups /SMEs Assessment Metrics, 2022 64
11.4.1. Progressive Companies 64
11.4.2. Responsive Companies 64
11.4.3. Dynamic Companies 64
11.4.4. Starting Blocks 64
11.5. Strategic Developments 65
11.5.1. Acquisitions & Mergers 65
11.5.2. New Product Launch 65
11.5.3. Regional Expansion 65
11.6. Key Players Product Matrix 66

CHAPTER NO. 12 : PESTEL & ADJACENT MARKET ANALYSIS 67
12.1. PESTEL 67
12.1.1. Political Factors 67
12.1.2. Economic Factors 67
12.1.3. Social Factors 67
12.1.4. Technological Factors 67
12.1.5. Environmental Factors 67
12.1.6. Legal Factors 67
12.2. Adjacent Market Analysis 67

CHAPTER NO. 13 : STANDING DESKS MARKET – BY TYPE SEGMENT ANALYSIS 68
13.1. Standing Desks Market Overview, by Type Segment 68
13.1.1. Standing Desks Market Volume Share, By Type, 2022 & 2030 69
13.1.2. Standing Desks Market Revenue Share, By Type, 2022 & 2030 69
13.1.3. Standing Desks Market Attractiveness Analysis, By Type 70
13.1.4. Incremental Revenue Growth Opportunity, by Type, 2023 – 2030 70
13.1.5. Standing Desks Market Revenue, By Type, 2017, 2022, 2026 & 2030 71
13.2. Fixed Standing Desks 72
13.2.1. Global Fixed Standing Desks Standing Desks Market Volume & Revenue, By Region, 2017 – 2022 (K Units) (USD Million) 73
13.2.2. Global Fixed Standing Desks Standing Desks Market Volume & Revenue, By Region, 2017 – 2022 (K Units) (USD Million) 73
13.3. Mechanically Adjusted Desk 74
13.3.1. Global Mechanically Adjusted Desk Standing Desks Market Volume & Revenue, By Region, 2017 – 2022 (K Units) (USD Million) 75
13.3.2. Global Mechanically Adjusted Desk Standing Desks Market Volume & Revenue, By Region, 2017 – 2022 (K Units) (USD Million) 75
13.4. Electrically Adjusted Desk 76
13.4.1. Global Electrically Adjusted Desk Standing Desks Market Volume & Revenue, By Region, 2017 – 2022 (K Units) (USD Million) 77
13.4.2. Global Electrically Adjusted Desk Standing Desks Market Volume & Revenue, By Region, 2017 – 2022 (K Units) (USD Million) 77
13.5. Converter Standing Desk 78
13.5.1. Global Converter Standing Desk Standing Desks Market Volume & Revenue, By Region, 2017 – 2022 (K Units) (USD Million) 79
13.5.2. Global Converter Standing Desk Standing Desks Market Volume & Revenue, By Region, 2017 – 2022 (K Units) (USD Million) 79
13.6. Others 80
13.6.1. Global Others Standing Desks Market Volume & Revenue, By Region, 2017 – 2022 (K Units) (USD Million) 81
13.6.2. Global Others Standing Desks Market Volume & Revenue, By Region, 2017 – 2022 (K Units) (USD Million) 81

CHAPTER NO. 14 : STANDING DESKS MARKET – BY DESIGN SEGMENT ANALYSIS 82
14.1. Standing Desks Market Overview, by Design Segment 82
14.1.1. Standing Desks Market Volume Share, By Design, 2022 & 2030 83
14.1.2. Standing Desks Market Revenue Share, By Design, 2022 & 2030 83
14.1.3. Standing Desks Market Attractiveness Analysis, By Design 84
14.1.4. Incremental Revenue Growth Opportunity, by Design, 2023 – 2030 84
14.1.5. Standing Desks Market Revenue, By Design, 2017, 2022, 2026 & 2030 85
14.2. Traditional Standing Desks 86
14.2.1. Global Traditional Standing Desks Standing Desks Market Volume & Revenue, By Region, 2017 – 2022 (K Units) (USD Million) 87
14.2.2. Global Traditional Standing Desks Standing Desks Market Volume & Revenue, By Region, 2017 – 2022 (K Units) (USD Million) 87
14.3. L-shaped Standing Desks 88
14.3.1. Global L-shaped Standing Desks Standing Desks Market Volume & Revenue, By Region, 2017 – 2022 (K Units) (USD Million) 89
14.3.2. Global L-shaped Standing Desks Standing Desks Market Volume & Revenue, By Region, 2017 – 2022 (K Units) (USD Million) 89
14.4. Adjustable Standing Desks 90
14.4.1. Global Adjustable Standing Desks Standing Desks Market Volume & Revenue, By Region, 2017 – 2022 (K Units) (USD Million) 91
14.4.2. Global Adjustable Standing Desks Standing Desks Market Volume & Revenue, By Region, 2017 – 2022 (K Units) (USD Million) 91
14.5. Corner Standing Desks 92
14.5.1. Global Corner Standing Desks Standing Desks Market Volume & Revenue, By Region, 2017 – 2022 (K Units) (USD Million) 93
14.5.2. Global Corner Standing Desks Standing Desks Market Volume & Revenue, By Region, 2017 – 2022 (K Units) (USD Million) 93
14.6. Others 94
14.6.1. Global Others Standing Desks Market Volume & Revenue, By Region, 2017 – 2022 (K Units) (USD Million) 95
14.6.2. Global Others Standing Desks Market Volume & Revenue, By Region, 2017 – 2022 (K Units) (USD Million) 95

CHAPTER NO. 15 : STANDING DESKS MARKET – BY END-USER SEGMENT ANALYSIS 96
15.1. Standing Desks Market Overview, by End-user Segment 96
15.1.1. Standing Desks Market Volume Share, By End-user, 2022 & 2030 97
15.1.2. Standing Desks Market Revenue Share, By End-user, 2022 & 2030 97
15.1.3. Standing Desks Market Attractiveness Analysis, By End-user 98
15.1.4. Incremental Revenue Growth Opportunity, by End-user, 2023 – 2030 98
15.1.5. Standing Desks Market Revenue, By End-user, 2017, 2022, 2026 & 2030 99
15.2. Household 100
15.2.1. Global Household Standing Desks Market Volume & Revenue, By Region, 2017 – 2022 (K Units) (USD Million) 101
15.2.2. Global Household Standing Desks Market Volume & Revenue, By Region, 2023 – 2030 (K Units) (USD Million) 101
15.3. Commercial 102
15.3.1. Global Commercial Standing Desks Market Volume & Revenue, By Region, 2017 – 2022 (K Units) (USD Million) 103
15.3.2. Global Commercial Standing Desks Market Volume & Revenue, By Region, 2023 – 2030 (K Units) (USD Million) 103
15.4. Specialty Stores 104
15.4.1. Global Specialty Stores Standing Desks Market Volume & Revenue, By Region, 2017 – 2022 (K Units) (USD Million) 105
15.4.2. Global Specialty Stores Standing Desks Market Volume & Revenue, By Region, 2023 – 2030 (K Units) (USD Million) 105
15.5. Healthcare Facilities 106
15.5.1. Global Healthcare Facilities Standing Desks Market Volume & Revenue, By Region, 2017 – 2022 (K Units) (USD Million) 107
15.5.2. Global Healthcare Facilities Standing Desks Market Volume & Revenue, By Region, 2023 – 2030 (K Units) (USD Million) 107
15.6. Others 108
15.6.1. Global Others Standing Desks Market Volume & Revenue, By Region, 2017 – 2022 (K Units) (USD Million) 109
15.6.2. Global Others Standing Desks Market Volume & Revenue, By Region, 2023 – 2030 (K Units) (USD Million) 109

CHAPTER NO. 16 : STANDING DESKS MARKET – BY MATERIAL SEGMENT ANALYSIS 110
16.1. Standing Desks Market Overview, by Material Segment 110
16.1.1. Standing Desks Market Revenue Share, By Material, 2022 & 2030 111
16.1.2. Standing Desks Market Revenue Share, By Material, 2022 & 2030 111
16.1.3. Standing Desks Market Attractiveness Analysis, By Material 112
16.1.4. Incremental Revenue Growth Opportunity, by Material, 2023 – 2030 112
16.1.5. Standing Desks Market Revenue, By Material, 2017, 2022, 2026 & 2030 113
16.2. Wooden 114
16.2.1. Global Wooden Standing Desks Market Volume & Revenue, By Region, 2017 – 2022 (K Units) (USD Million) 115
16.2.2. Global Wooden Standing Desks Market Volume & Revenue, By Region, 2023 – 2030 (K Units) (USD Million) 115
16.3. Metal 116
16.3.1. Global Metal Standing Desks Market Volume & Revenue, By Region, 2017 – 2022 (K Units) (USD Million) 117
16.3.2. Global Metal Standing Desks Market Volume & Revenue, By Region, 2023 – 2030 (K Units) (USD Million) 117
16.4. Glass 118
16.4.1. Global Glass Standing Desks Market Volume & Revenue, By Region, 2017 – 2022 (K Units) (USD Million) 119
16.4.2. Global Glass Standing Desks Market Volume & Revenue, By Region, 2023 – 2030 (K Units) (USD Million) 119
16.5. Material 4 120
16.5.1. Global Material 4 Standing Desks Market Volume & Revenue, By Region, 2017 – 2022 (K Units) (USD Million) 121
16.5.2. Global Material 4 Standing Desks Market Volume & Revenue, By Region, 2023 – 2030 (K Units) (USD Million) 121
16.6. Material 5 122
16.6.1. Global Material 5 Standing Desks Market Volume & Revenue, By Region, 2017 – 2022 (K Units) (USD Million) 123
16.6.2. Global Material 5 Standing Desks Market Volume & Revenue, By Region, 2023 – 2030 (K Units) (USD Million) 123

CHAPTER NO. 17 : STANDING DESKS MARKET – BY DISTRIBUTION CHANNEL SEGMENT ANALYSIS 124
17.1. Standing Desks Market Overview, by Distribution Channel Segment 124
17.1.1. Standing Desks Market Revenue Share, By Distribution Channel, 2022 & 2030 125
17.1.2. Standing Desks Market Revenue Share, By Distribution Channel, 2022 & 2030 125
17.1.3. Standing Desks Market Attractiveness Analysis, By Distribution Channel 126
17.1.4. Incremental Revenue Growth Opportunity, by Distribution Channel, 2023 – 2030 126
17.1.5. Standing Desks Market Revenue, By Distribution Channel, 2017, 2022, 2026 & 2030 127
17.2. e-Commerce 128
17.2.1. Global e-Commerce Standing Desks Market Volume & Revenue, By Region, 2017 – 2022 (K Units) (USD Million) 129
17.2.2. Global e-Commerce Standing Desks Market Volume & Revenue, By Region, 2023 – 2030 (K Units) (USD Million) 129
17.3. Specialty Stores 130
17.3.1. Global Specialty Stores Standing Desks Market Volume & Revenue, By Region, 2017 – 2022 (K Units) (USD Million) 131
17.3.2. Global Specialty Stores Standing Desks Market Volume & Revenue, By Region, 2023 – 2030 (K Units) (USD Million) 131
17.4. Direct Sales (Company Websites) 132
17.4.1. Global Direct Sales (Company Websites) Standing Desks Market Volume & Revenue, By Region, 2017 – 2022 (K Units) (USD Million) 133
17.4.2. Global Direct Sales (Company Websites) Standing Desks Market Volume & Revenue, By Region, 2023 – 2030 (K Units) (USD Million) 133
17.5. Supermarkets/Hypermarkets 134
17.5.1. Global Supermarkets/Hypermarkets Standing Desks Market Volume & Revenue, By Region, 2017 – 2022 (K Units) (USD Million) 135
17.5.2. Global Supermarkets/Hypermarkets Standing Desks Market Volume & Revenue, By Region, 2023 – 2030 (K Units) (USD Million) 135
17.6. Others 136
17.6.1. Global Others Standing Desks Market Volume & Revenue, By Region, 2017 – 2022 (K Units) (USD Million) 137
17.6.2. Global Others Standing Desks Market Volume & Revenue, By Region, 2023 – 2030 (K Units) (USD Million) 137

CHAPTER NO. 18 : STANDING DESKS MARKET – REGIONAL ANALYSIS 138
18.1. Standing Desks Market Overview, by Regional Segments 138
18.2. Region 139
18.2.1. Global Standing Desks Market Volume Share, By Region, 2022 & 2030 139
18.2.2. Global Standing Desks Market Revenue Share, By Region, 2022 & 2030 139
18.2.3. Standing Desks Market Attractiveness Analysis, By Region 140
18.2.4. Incremental Revenue Growth Opportunity, by Region, 2023 – 2030 140
18.2.5. Standing Desks Market Revenue, By Region, 2017, 2022, 2026 & 2030 141
18.2.6. Global Standing Desks Market Volume & Revenue, By Region, 2017 – 2022 (K Units) (USD Million) 142
18.2.7. Global Standing Desks Market Volume & Revenue, By Region, 2023 – 2030 (K Units) (USD Million) 142
18.3. Type 143
18.3.1. Global Standing Desks Market Volume & Revenue, By Type, 2017 – 2022 (K Units) (USD Million) 143
18.3.2. Global Standing Desks Market Volume & Revenue, By Type, 2023 – 2030 (K Units) (USD Million) 143
18.4. Design 144
18.4.1. Global Standing Desks Market Volume & Revenue, By Design, 2017 – 2022 (K Units) (USD Million) 144
18.4.2. Global Standing Desks Market Volume & Revenue, By Design, 2023 – 2030 (K Units) (USD Million) 144
18.5. End-user 145
18.5.1. Global Standing Desks Market Volume & Revenue, By End-user, 2017 – 2022 (K Units) (USD Million) 145
18.5.2. Global Standing Desks Market Volume & Revenue, By End-user, 2023 – 2030 (K Units) (USD Million) 145
18.6. Material 146
18.6.1. Global Standing Desks Market Volume & Revenue, By Material, 2017 – 2022 (K Units) (USD Million) 146
18.6.2. Global Standing Desks Market Volume & Revenue, By Material, 2023 – 2030 (K Units) (USD Million) 146
18.7. Distribution Channel 147
18.7.1. Global Standing Desks Market Volume & Revenue, By Distribution Channel, 2017 – 2022 (K Units) (USD Million) 147
18.7.2. Global Standing Desks Market Volume & Revenue, By Distribution Channel, 2023 – 2030 (K Units) (USD Million) 147

CHAPTER NO. 19 : STANDING DESKS MARKET – NORTH AMERICA 148
19.1. North America 148
19.2. Key Highlights 148
19.2.1. North America Standing Desks Market Volume, By Country, 2017 – 2022 (K Units) 149
19.2.2. North America Standing Desks Market Revenue, By Country, 2017 – 2022 (USD Million) 149
19.2.2.1. North America Standing Desks Market Volume, By Type, 2017 – 2022 (K Units) 150
19.2.3. North America Standing Desks Market Revenue, By Type, 2017 – 2022 (USD Million) 151
19.2.4. North America Standing Desks Market Volume, By Design, 2017 – 2022 (K Units) 152
19.2.5. North America Standing Desks Market Revenue, By Design, 2017 – 2022 (USD Million) 153
19.2.6. North America Standing Desks Market Volume, By End-user, 2017 – 2022 (K Units) 154
19.2.7. North America Standing Desks Market Revenue, By End-user, 2017 – 2022 (USD Million) 155
19.2.8. North America Standing Desks Market Volume, By Material, 2017 – 2022 (K Units) 156
19.2.9. North America Standing Desks Market Revenue, By Material, 2017 – 2022 (USD Million) 157
19.2.10. North America Standing Desks Market Volume, By Distribution Channel, 2017 – 2022 (K Units) 158
19.2.11. North America Standing Desks Market Revenue, By Distribution Channel, 2017 – 2022 (USD Million) 159
19.2.12. U.S. 160
19.2.13. Canada 160
19.2.14. Mexico 160

CHAPTER NO. 20 : STANDING DESKS MARKET – EUROPE 161
20.1. Europe 161
20.2. Key Highlights 161
20.2.1. Europe Standing Desks Market Volume, By Country, 2017 – 2022 (K Units) 162
20.2.2. Europe Standing Desks Market Revenue, By Country, 2017 – 2022 (USD Million) 163
20.2.3. Europe Standing Desks Market Volume, By Type, 2017 – 2022 (K Units) 164
20.2.4. Europe Standing Desks Market Revenue, By Type, 2017 – 2022 (USD Million) 165
20.2.5. Europe Standing Desks Market Volume, By Design, 2017 – 2022 (K Units) 166
20.2.6. Europe Standing Desks Market Revenue, By Design, 2017 – 2022 (USD Million) 167
20.2.7. Europe Standing Desks Market Volume, By End-user, 2017 – 2022 (K Units) 168
20.2.8. Europe Standing Desks Market Revenue, By End-user, 2017 – 2022 (USD Million) 169
20.2.9. Europe Standing Desks Market Volume, By Material, 2017 – 2022 (K Units) 170
20.2.10. Europe Standing Desks Market Revenue, By Material, 2017 – 2022 (USD Million) 171
20.2.11. Europe Standing Desks Market Volume, By Distribution Channel, 2017 – 2022 (K Units) 172
20.2.12. Europe Standing Desks Market Revenue, By Distribution Channel, 2017 – 2022 (USD Million) 173
20.2.13. UK 174
20.2.14. France 174
20.2.15. Germany 174
20.2.16. Italy 174
20.2.17. Spain 174
20.2.18. Russia 174
20.2.19. BENELUX 174
20.2.20. Sweden 174
20.2.21. Denmark 174
20.2.22. Poland 174
20.2.23. Austria 174
20.2.24. Rest of Europe 174

CHAPTER NO. 21 : STANDING DESKS MARKET – ASIA PACIFIC 175
21.1. Asia Pacific 175
21.2. Key Highlights 175
21.2.1. Asia Pacific Standing Desks Market Volume, By Country, 2017 – 2022 (K Units) 176
21.2.2. Asia Pacific Standing Desks Market Revenue, By Country, 2017 – 2022 (USD Million) 177
21.2.3. Asia Pacific Standing Desks Market Volume, By Type, 2017 – 2022 (K Units) 178
21.2.4. Asia Pacific Standing Desks Market Revenue, By Type, 2017 – 2022 (USD Million) 179
21.2.5. Asia Pacific Standing Desks Market Volume, By Design, 2017 – 2022 (K Units) 180
21.2.6. Asia Pacific Standing Desks Market Revenue, By Design, 2017 – 2022 (USD Million) 181
21.2.7. Asia Pacific Standing Desks Market Volume, By End-user, 2017 – 2022 (K Units) 182
21.2.8. Asia Pacific Standing Desks Market Revenue, By End-user, 2017 – 2022 (USD Million) 183
21.2.9. Asia Pacific Standing Desks Market Volume, By Material, 2017 – 2022 (K Units) 184
21.2.10. Asia Pacific Standing Desks Market Revenue, By Material, 2017 – 2022 (USD Million) 185
21.2.11. Asia Pacific Standing Desks Market Volume, By Distribution Channel, 2017 – 2022 (K Units) 186
21.2.12. Asia Pacific Standing Desks Market Revenue, By Distribution Channel, 2017 – 2022 (USD Million) 187
21.2.13. China 188
21.2.14. Japan 188
21.2.15. South Korea 188
21.2.16. India 188
21.2.17. Thailand 188
21.2.18. Indonesia 188
21.2.19. Vietnam 188
21.2.20. Malaysia 188
21.2.21. Philippines 188
21.2.22. Taiwan 188
21.2.23. Rest of Asia Pacific 188

CHAPTER NO. 22 : STANDING DESKS MARKET – LATIN AMERICA 189
22.1. Latin America 189
22.2. Key Highlights 189
22.2.1. Latin America Standing Desks Market Volume, By Country, 2017 – 2022 (K Units) 190
22.2.2. Latin America Standing Desks Market Revenue, By Country, 2017 – 2022 (USD Million) 191
22.2.3. Latin America Standing Desks Market Volume, By Type, 2017 – 2022 (K Units) 192
22.2.4. Latin America Standing Desks Market Revenue, By Type, 2017 – 2022 (USD Million) 193
22.2.5. Latin America Standing Desks Market Volume, By Design, 2017 – 2022 (K Units) 194
22.2.6. Latin America Standing Desks Market Revenue, By Design, 2017 – 2022 (USD Million) 195
22.2.7. Latin America Standing Desks Market Volume, By End-user, 2017 – 2022 (K Units) 196
22.2.8. Latin America Standing Desks Market Revenue, By End-user, 2017 – 2022 (USD Million) 197
22.2.9. Latin America Standing Desks Market Volume, By Material, 2017 – 2022 (K Units) 198
22.2.10. Latin America Standing Desks Market Revenue, By Material, 2017 – 2022 (USD Million) 199
22.2.11. Latin America Standing Desks Market Volume, By Distribution Channel, 2017 – 2022 (K Units) 200
22.2.12. Latin America Standing Desks Market Revenue, By Distribution Channel, 2017 – 2022 (USD Million) 201
22.2.13. Brazil 202
22.2.14. Argentina 202
22.2.15. Colombia 202
22.2.16. Chile 202
22.2.17. Peru 202
22.2.18. Rest of Latin America 202

CHAPTER NO. 23 : STANDING DESKS MARKET – MIDDLE EAST 203
23.1. The Middle-East 203
23.2. Key Highlights 203
23.2.1. Middle East Standing Desks Market Volume, By Country, 2017 – 2022 (K Units) 204
23.2.2. Middle East Standing Desks Market Revenue, By Country, 2017 – 2022 (USD Million) 205
23.2.3. Middle East Standing Desks Market Volume, By Type, 2017 – 2022 (K Units) 206
23.2.4. Middle East Standing Desks Market Revenue, By Type, 2017 – 2022 (USD Million) 207
23.2.5. Middle East Standing Desks Market Volume, By Design, 2017 – 2022 (K Units) 208
23.2.6. Middle East Standing Desks Market Revenue, By Design, 2017 – 2022 (USD Million) 209
23.2.7. Middle East Standing Desks Market Volume, By End-user, 2017 – 2022 (K Units) 210
23.2.8. Middle East Standing Desks Market Revenue, By End-user, 2017 – 2022 (USD Million) 211
23.2.9. Middle East Standing Desks Market Volume, By Material, 2017 – 2022 (K Units) 212
23.2.10. Middle East Standing Desks Market Revenue, By Material, 2017 – 2022 (USD Million) 213
23.2.11. Middle East Standing Desks Market Volume, By Distribution Channel, 2017 – 2022 (K Units) 214
23.2.12. Middle East Standing Desks Market Revenue, By Distribution Channel, 2017 – 2022 (USD Million) 215
23.2.13. GCC Countries 216
23.2.14. Israel 216
23.2.15. Turkey 216
23.2.16. Iran 216
23.2.17. Rest of Middle East & Africa 216

CHAPTER NO. 24 : STANDING DESKS MARKET – AFRICA 217
24.1. Africa 217
24.2. Key Highlights 217
24.2.1. Africa Standing Desks Market Volume, By Country, 2017 – 2022 (K Units) 218
24.2.2. Africa Standing Desks Market Revenue, By Country, 2017 – 2022 (USD Million) 219
24.2.3. Africa Standing Desks Market Volume, By Type, 2017 – 2022 (K Units) 220
24.2.4. Africa Standing Desks Market Revenue, By Type, 2017 – 2022 (USD Million) 221
24.2.5. Africa Standing Desks Market Volume, By Design, 2017 – 2022 (K Units) 222
24.2.6. Africa Standing Desks Market Revenue, By Design, 2017 – 2022 (USD Million) 223
24.2.7. Africa Standing Desks Market Volume, By End-user, 2017 – 2022 (K Units) 224
24.2.8. Africa Standing Desks Market Revenue, By End-user, 2017 – 2022 (USD Million) 225
24.2.9. Africa Standing Desks Market Volume, By Material, 2017 – 2022 (K Units) 226
24.2.10. Africa Standing Desks Market Revenue, By Material, 2017 – 2022 (USD Million) 227
24.2.11. Africa Standing Desks Market Volume, By Distribution Channel, 2017 – 2022 (K Units) 228
24.2.12. Africa Standing Desks Market Revenue, By Distribution Channel, 2017 – 2022 (USD Million) 229
24.2.13. South Africa 230
24.2.14. Egypt 230
24.2.15. Nigeria 230
24.2.16. Algeria 230
24.2.17. Morocco 230
24.2.18. Rest of Africa 230

CHAPTER NO. 25 : COMPANY PROFILES 231
25.1. Steelcase 231
25.1.1. Company Overview 231
25.1.2. Product Portfolio 231
25.1.3. Swot Analysis 231
25.1.4. Business Strategy 232
25.1.5. Financial Overview 232
25.2. Ergotron 233
25.3. Herman Miller 233
25.4. Okamura 233
25.5. Haworth 233
25.6. HNI Corporation 233
25.7. Humanscale 233
25.8. Workrite Ergonomics 233
25.9. Global Furniture Group 233
25.10. Qidong Vision Mounts Manufacturing Co.,Ltd 233
25.11. Ergotron 233
25.12. Herman Miller 233
25.13. Company 13 233
25.14. Company 14 233

CHAPTER NO. 26 : RESEARCH METHODOLOGY 234
26.1. Research Methodology 234
26.2. Phase I – Secondary Research 235
26.3. Phase II – Data Modeling 235
26.3.1. Company Share Analysis Model 236
26.3.2. Revenue Based Modeling 236
26.4. Phase III – Primary Research 237
26.5. Research Limitations 238
26.5.1. Assumptions 238

List of Figures
FIG NO. 1. Global Standing Desks Market Volume & Revenue, 2017 – 2022 (K Units) (USD Million) 39
FIG NO. 2. Porter’s Five Forces Analysis for Global Standing Desks Market 48
FIG NO. 3. Value Chain Analysis for Global Standing Desks Market 49
FIG NO. 4. Global Standing Desks Market Import Volume/Revenue, By Region, 2017 – 2022 51
FIG NO. 5. Global Standing Desks Market Export Volume/Revenue, By Region, 2017 – 2022 52
FIG NO. 6. Global Standing Desks Market Demand Volume/Revenue, By Region, 2017 – 2022 53
FIG NO. 7. Global Standing Desks Market Supply Volume/Revenue, By Region, 2017 – 2022 54
FIG NO. 8. Global Standing Desks Market Production, By Region, 2017 – 2022 55
FIG NO. 9. Global Standing Desks Market Price, By Region, 2017 – 2022 56
FIG NO. 10. Global Standing Desks Market Price, By Type, 2017 – 2022 57
FIG NO. 11. Raw Materials Price Trend Analysis, 2017 – 2022 58
FIG NO. 12. Manufacturing Cost Analysis 59
FIG NO. 13. Manufacturing Process 59
FIG NO. 14. Company Share Analysis, 2022 60
FIG NO. 15. Company Share Analysis, 2022 60
FIG NO. 16. Company Share Analysis, 2022 61
FIG NO. 17. Company Share Analysis, 2022 61
FIG NO. 18. Standing Desks Market – Company Volume Market Share, 2022 62
FIG NO. 19. Standing Desks Market – Company Revenue Market Share, 2022 63
FIG NO. 20. Standing Desks Market Volume Share, By Type, 2022 & 2030 69
FIG NO. 21. Standing Desks Market Revenue Share, By Type, 2022 & 2030 69
FIG NO. 22. Market Attractiveness Analysis, By Type 70
FIG NO. 23. Incremental Revenue Growth Opportunity by Type 70
FIG NO. 24. Standing Desks Market Revenue, By Type, 2017, 2022, 2026 & 2030 71
FIG NO. 25. Global Standing Desks Market for Fixed Standing Desks, Volume & Revenue (K Units) (USD Million) 2017 – 2030 72
FIG NO. 26. Global Standing Desks Market for Mechanically Adjusted Desk, Volume & Revenue (K Units) (USD Million) 2017 – 2030 74
FIG NO. 27. Global Standing Desks Market for Electrically Adjusted Desk, Volume & Revenue (K Units) (USD Million) 2017 – 2030 76
FIG NO. 28. Global Standing Desks Market for Converter Standing Desk, Volume & Revenue (K Units) (USD Million) 2017 – 2030 78
FIG NO. 29. Global Standing Desks Market for Others, Volume & Revenue (K Units) (USD Million) 2017 – 2030 80
FIG NO. 30. Standing Desks Market Volume Share, By Design, 2022 & 2030 83
FIG NO. 31. Standing Desks Market Revenue Share, By Design, 2022 & 2030 83
FIG NO. 32. Market Attractiveness Analysis, By Design 84
FIG NO. 33. Incremental Revenue Growth Opportunity by Design 84
FIG NO. 34. Standing Desks Market Revenue, By Design, 2017, 2022, 2026 & 2030 85
FIG NO. 35. Global Standing Desks Market for Traditional Standing Desks, Volume & Revenue (K Units) (USD Million) 2017 – 2030 86
FIG NO. 36. Global Standing Desks Market for L-shaped Standing Desks, Volume & Revenue (K Units) (USD Million) 2017 – 2030 88
FIG NO. 37. Global Standing Desks Market for Adjustable Standing Desks, Volume & Revenue (K Units) (USD Million) 2017 – 2030 90
FIG NO. 38. Global Standing Desks Market for Corner Standing Desks, Volume & Revenue (K Units) (USD Million) 2017 – 2030 92
FIG NO. 39. Global Standing Desks Market for Others, Volume & Revenue (K Units) (USD Million) 2017 – 2030 94
FIG NO. 40. Standing Desks Market Volume Share, By End-user, 2022 & 2030 97
FIG NO. 41. Standing Desks Market Revenue Share, By End-user, 2022 & 2030 97
FIG NO. 42. Market Attractiveness Analysis, By End-user 98
FIG NO. 43. Incremental Revenue Growth Opportunity by End-user 98
FIG NO. 44. Standing Desks Market Revenue, By End-user, 2017, 2022, 2026 & 2030 99
FIG NO. 45. Global Standing Desks Market for Household, Volume & Revenue (K Units) (USD Million) 2017 – 2030 100
FIG NO. 46. Global Standing Desks Market for Commercial, Volume & Revenue (K Units) (USD Million) 2017 – 2030 102
FIG NO. 47. Global Standing Desks Market for Specialty Stores, Volume & Revenue (K Units) (USD Million) 2017 – 2030 104
FIG NO. 48. Global Standing Desks Market for Healthcare Facilities, Volume & Revenue (K Units) (USD Million) 2017 – 2030 106
FIG NO. 49. Global Standing Desks Market for Others, Volume & Revenue (K Units) (USD Million) 2017 – 2030 108
FIG NO. 50. Standing Desks Market Revenue Share, By Material, 2022 & 2030 111
FIG NO. 51. Standing Desks Market Revenue Share, By Material, 2022 & 2030 111
FIG NO. 52. Market Attractiveness Analysis, By Material 112
FIG NO. 53. Incremental Revenue Growth Opportunity by Material 112
FIG NO. 54. Standing Desks Market Revenue, By Material, 2017, 2022, 2026 & 2030 113
FIG NO. 55. Global Standing Desks Market for Wooden, Volume & Revenue (K Units) (USD Million) 2017 – 2030 114
FIG NO. 56. Global Standing Desks Market for Metal, Volume & Revenue (K Units) (USD Million) 2017 – 2030 116
FIG NO. 57. Global Standing Desks Market for Glass, Volume & Revenue (K Units) (USD Million) 2017 – 2030 118
FIG NO. 58. Global Standing Desks Market for Material 4, Volume & Revenue (K Units) (USD Million) 2017 – 2030 120
FIG NO. 59. Global Standing Desks Market for Material 5, Volume & Revenue (K Units) (USD Million) 2017 – 2030 122
FIG NO. 60. Standing Desks Market Revenue Share, By Distribution Channel, 2022 & 2030 125
FIG NO. 61. Standing Desks Market Revenue Share, By Distribution Channel, 2022 & 2030 125
FIG NO. 62. Market Attractiveness Analysis, By Distribution Channel 126
FIG NO. 63. Incremental Revenue Growth Opportunity by Distribution Channel 126
FIG NO. 64. Standing Desks Market Revenue, By Distribution Channel, 2017, 2022, 2026 & 2030 127
FIG NO. 65. Global Standing Desks Market for e-Commerce, Volume & Revenue (K Units) (USD Million) 2017 – 2030 128
FIG NO. 66. Global Standing Desks Market for Specialty Stores, Volume & Revenue (K Units) (USD Million) 2017 – 2030 130
FIG NO. 67. Global Standing Desks Market for Direct Sales (Company Websites), Volume & Revenue (K Units) (USD Million) 2017 – 2030 132
FIG NO. 68. Global Standing Desks Market for Supermarkets/Hypermarkets, Volume & Revenue (K Units) (USD Million) 2017 – 2030 134
FIG NO. 69. Global Standing Desks Market for Others, Volume & Revenue (K Units) (USD Million) 2017 – 2030 136
FIG NO. 70. Global Standing Desks Market Volume Share, By Region, 2022 & 2030 139
FIG NO. 71. Global Standing Desks Market Revenue Share, By Region, 2022 & 2030 139
FIG NO. 72. Market Attractiveness Analysis, By Region 140
FIG NO. 73. Incremental Revenue Growth Opportunity by Region 140
FIG NO. 74. Standing Desks Market Revenue, By Region, 2017, 2022, 2026 & 2030 141
FIG NO. 75. North America Standing Desks Market Volume & Revenue, 2017 – 2022 (K Units) (USD Million) 148
FIG NO. 76. Europe Standing Desks Market Volume & Revenue, 2017 – 2022 (K Units) (USD Million) 161
FIG NO. 77. Asia Pacific Standing Desks Market Volume & Revenue, 2017 – 2022 (K Units) (USD Million) 175
FIG NO. 78. Latin America Standing Desks Market Volume & Revenue, 2017 – 2022 (K Units) (USD Million) 189
FIG NO. 79. The Middle-East Standing Desks Market Volume & Revenue, 2017 – 2022 (K Units) (USD Million) 203
FIG NO. 80. Africa Standing Desks Market Volume & Revenue, 2017 – 2022 (K Units) (USD Million) 217
FIG NO. 81. Research Methodology – Detailed View 234
FIG NO. 82. Research Methodology 235

List of Tables
TABLE NO. 1. : Global Standing Desks Market: Snapshot 37
TABLE NO. 2. : Drivers for the Standing Desks Market: Impact Analysis 44
TABLE NO. 3. : Restraints for the Standing Desks Market: Impact Analysis 46
TABLE NO. 4. : Global Standing Desks Market Volume & Revenue, By Region, 2017 – 2022 (K Units) 55
TABLE NO. 5. : Global Standing Desks Market Volume & Revenue, By Region, 2017 – 2022 56
TABLE NO. 6. : Global Standing Desks Market Volume & Revenue, By Type, 2017 – 2022 57
TABLE NO. 7. : Key Raw Materials & Suppliers 58
TABLE NO. 8. : Global Fixed Standing Desks Standing Desks Market Volume & Revenue, By Region, 2017 – 2022 (K Units) (USD Million) 73
TABLE NO. 9. : Global Fixed Standing Desks Standing Desks Market Volume & Revenue, By Region, 2023– 2030 (K Units) (USD Million) 73
TABLE NO. 10. : Global Mechanically Adjusted Desk Standing Desks Market Volume & Revenue, By Region, 2017 – 2022 (K Units) (USD Million) 75
TABLE NO. 11. : Global Mechanically Adjusted Desk Standing Desks Market Volume & Revenue, By Region, 2023– 2030 (K Units) (USD Million) 75
TABLE NO. 12. : Global Electrically Adjusted Desk Standing Desks Market Volume & Revenue, By Region, 2017 – 2022 (K Units) (USD Million) 77
TABLE NO. 13. : Global Electrically Adjusted Desk Standing Desks Market Volume & Revenue, By Region, 2023– 2030 (K Units) (USD Million) 77
TABLE NO. 14. : Global Converter Standing Desk Standing Desks Market Volume & Revenue, By Region, 2017 – 2022 (K Units) (USD Million) 79
TABLE NO. 15. : Global Converter Standing Desk Standing Desks Market Volume & Revenue, By Region, 2023– 2030 (K Units) (USD Million) 79
TABLE NO. 16. : Global Others Standing Desks Market Volume & Revenue, By Region, 2017 – 2022 (K Units) (USD Million) 81
TABLE NO. 17. : Global Others Standing Desks Market Volume & Revenue, By Region, 2023– 2030 (K Units) (USD Million) 81
TABLE NO. 18. : Global Traditional Standing Desks Standing Desks Market Volume & Revenue, By Region, 2017 – 2022 (K Units) (USD Million) 87
TABLE NO. 19. : Global Traditional Standing Desks Standing Desks Market Volume & Revenue, By Region, 2023– 2030 (K Units) (USD Million) 87
TABLE NO. 20. : Global L-shaped Standing Desks Standing Desks Market Volume & Revenue, By Region, 2017 – 2022 (K Units) (USD Million) 89
TABLE NO. 21. : Global L-shaped Standing Desks Standing Desks Market Volume & Revenue, By Region, 2023– 2030 (K Units) (USD Million) 89
TABLE NO. 22. : Global Adjustable Standing Desks Standing Desks Market Volume & Revenue, By Region, 2017 – 2022 (K Units) (USD Million) 91
TABLE NO. 23. : Global Adjustable Standing Desks Standing Desks Market Volume & Revenue, By Region, 2023– 2030 (K Units) (USD Million) 91
TABLE NO. 24. : Global Corner Standing Desks Standing Desks Market Volume & Revenue, By Region, 2017 – 2022 (K Units) (USD Million) 93
TABLE NO. 25. : Global Corner Standing Desks Standing Desks Market Volume & Revenue, By Region, 2023– 2030 (K Units) (USD Million) 93
TABLE NO. 26. : Global Others Standing Desks Market Volume & Revenue, By Region, 2017 – 2022 (K Units) (USD Million) 95
TABLE NO. 27. : Global Others Standing Desks Market Volume & Revenue, By Region, 2023– 2030 (K Units) (USD Million) 95
TABLE NO. 28. : Global Household Standing Desks Market Volume & Revenue, By Region, 2017 – 2022 (K Units) (USD Million) 101
TABLE NO. 29. : Global Household Standing Desks Market Volume & Revenue, By Region, 2023– 2030 (K Units) (USD Million) 101
TABLE NO. 30. : Global Commercial Standing Desks Market Volume & Revenue, By Region, 2017 – 2022 (K Units) (USD Million) 103
TABLE NO. 31. : Global Commercial Standing Desks Market Volume & Revenue, By Region, 2023– 2030 (K Units) (USD Million) 103
TABLE NO. 32. : Global Specialty Stores Standing Desks Market Volume & Revenue, By Region, 2017 – 2022 (K Units) (USD Million) 105
TABLE NO. 33. : Global Specialty Stores Standing Desks Market Volume & Revenue, By Region, 2023– 2030 (K Units) (USD Million) 105
TABLE NO. 34. : Global Healthcare Facilities Standing Desks Market Volume & Revenue, By Region, 2017 – 2022 (K Units) (USD Million) 107
TABLE NO. 35. : Global Healthcare Facilities Standing Desks Market Volume & Revenue, By Region, 2023– 2030 (K Units) (USD Million) 107
TABLE NO. 36. : Global Others Standing Desks Market Volume & Revenue, By Region, 2017 – 2022 (K Units) (USD Million) 109
TABLE NO. 37. : Global Others Standing Desks Market Volume & Revenue, By Region, 2023– 2030 (K Units) (USD Million) 109
TABLE NO. 38. : Global Wooden Standing Desks Market Volume & Revenue, By Region, 2017 – 2022 (K Units) (USD Million) 115
TABLE NO. 39. : Global Wooden Standing Desks Market Volume & Revenue, By Region, 2023– 2030 (K Units) (USD Million) 115
TABLE NO. 40. : Global Metal Standing Desks Market Volume & Revenue, By Region, 2017 – 2022 (K Units) (USD Million) 117
TABLE NO. 41. : Global Metal Standing Desks Market Volume & Revenue, By Region, 2023– 2030 (K Units) (USD Million) 117
TABLE NO. 42. : Global Glass Standing Desks Market Volume & Revenue, By Region, 2017 – 2022 (K Units) (USD Million) 119
TABLE NO. 43. : Global Glass Standing Desks Market Volume & Revenue, By Region, 2023– 2030 (K Units) (USD Million) 119
TABLE NO. 44. : Global Material 4 Standing Desks Market Volume & Revenue, By Region, 2017 – 2022 (K Units) (USD Million) 121
TABLE NO. 45. : Global Material 4 Standing Desks Market Volume & Revenue, By Region, 2023– 2030 (K Units) (USD Million) 121
TABLE NO. 46. : Global Material 5 Standing Desks Market Volume & Revenue, By Region, 2017 – 2022 (K Units) (USD Million) 123
TABLE NO. 47. : Global Material 5 Standing Desks Market Volume & Revenue, By Region, 2023– 2030 (K Units) (USD Million) 123
TABLE NO. 48. : Global e-Commerce Standing Desks Market Volume & Revenue, By Region, 2017 – 2022 (K Units) (USD Million) 129
TABLE NO. 49. : Global e-Commerce Standing Desks Market Volume & Revenue, By Region, 2023– 2030 (K Units) (USD Million) 129
TABLE NO. 50. : Global Specialty Stores Standing Desks Market Volume & Revenue, By Region, 2017 – 2022 (K Units) (USD Million) 131
TABLE NO. 51. : Global Specialty Stores Standing Desks Market Volume & Revenue, By Region, 2023– 2030 (K Units) (USD Million) 131
TABLE NO. 52. : Global Direct Sales (Company Websites) Standing Desks Market Volume & Revenue, By Region, 2017 – 2022 (K Units) (USD Million) 133
TABLE NO. 53. : Global Direct Sales (Company Websites) Standing Desks Market Volume & Revenue, By Region, 2023– 2030 (K Units) (USD Million) 133
TABLE NO. 54. : Global Supermarkets/Hypermarkets Standing Desks Market Volume & Revenue, By Region, 2017 – 2022 (K Units) (USD Million) 135
TABLE NO. 55. : Global Supermarkets/Hypermarkets Standing Desks Market Volume & Revenue, By Region, 2023– 2030 (K Units) (USD Million) 135
TABLE NO. 56. : Global Others Standing Desks Market Volume & Revenue, By Region, 2017 – 2022 (K Units) (USD Million) 137
TABLE NO. 57. : Global Others Standing Desks Market Volume & Revenue, By Region, 2023– 2030 (K Units) (USD Million) 137
TABLE NO. 58. : Global Standing Desks Market Volume & Revenue, By Region, 2017 – 2022 (K Units) (USD Million) 142
TABLE NO. 59. : Global Standing Desks Market Volume & Revenue, By Region, 2023– 2030 (K Units) (USD Million) 142
TABLE NO. 60. : Global Standing Desks Market Volume & Revenue, By Type, 2017 – 2022 (K Units) (USD Million) 143
TABLE NO. 61. : Global Standing Desks Market Volume & Revenue, By Type, 2023– 2030 (K Units) (USD Million) 143
TABLE NO. 62. : Global Standing Desks Market Volume & Revenue, By Design, 2017 – 2022 (K Units) (USD Million) 144
TABLE NO. 63. : Global Standing Desks Market Volume & Revenue, By Design, 2023– 2030 (K Units) (USD Million) 144
TABLE NO. 64. : Global Standing Desks Market Volume & Revenue, By End-user, 2017 – 2022 (K Units) (USD Million) 145
TABLE NO. 65. : Global Standing Desks Market Volume & Revenue, By End-user, 2023– 2030 (K Units) (USD Million) 145
TABLE NO. 66. : Global Standing Desks Market Volume & Revenue, By Material, 2017 – 2022 (K Units) (USD Million) 146
TABLE NO. 67. : Global Standing Desks Market Volume & Revenue, By Material, 2023– 2030 (K Units) (USD Million) 146
TABLE NO. 68. : Global Standing Desks Market Volume & Revenue, By Distribution Channel, 2017 – 2022 (K Units) (USD Million) 147
TABLE NO. 69. : Global Standing Desks Market Volume & Revenue, By Distribution Channel, 2023– 2030 (K Units) (USD Million) 147
TABLE NO. 70. : North America Standing Desks Market Volume, By Country, 2017 – 2022 (K Units) 149
TABLE NO. 71. : North America Standing Desks Market Volume, By Country, 2023– 2030 (K Units) 149
TABLE NO. 72. : North America Standing Desks Market Revenue, By Country, 2017 – 2022 (USD Million) 149
TABLE NO. 73. : North America Standing Desks Market Revenue, By Country, 2023– 2030 (USD Million) 149
TABLE NO. 74. : North America Standing Desks Market Volume, By Type, 2017 – 2022 (K Units) 150
TABLE NO. 75. : North America Standing Desks Market Volume, By Type, 2023– 2030 (K Units) 150
TABLE NO. 76. : North America Standing Desks Market Revenue, By Type, 2017 – 2022 (USD Million) 151
TABLE NO. 77. : North America Standing Desks Market Revenue, By Type, 2023– 2030 (USD Million) 151
TABLE NO. 78. : North America Standing Desks Market Volume, By Design, 2017 – 2022 (K Units) 152
TABLE NO. 79. : North America Standing Desks Market Volume, By Design, 2023– 2030 (K Units) 152
TABLE NO. 80. : North America Standing Desks Market Revenue, By Design, 2017 – 2022 (USD Million) 153
TABLE NO. 81. : North America Standing Desks Market Revenue, By Design, 2023– 2030 (USD Million) 153
TABLE NO. 82. : North America Standing Desks Market Volume, By End-user, 2017 – 2022 (K Units) 154
TABLE NO. 83. : North America Standing Desks Market Volume, By End-user, 2023– 2030 (K Units) 154
TABLE NO. 84. : North America Standing Desks Market Revenue, By End-user, 2017 – 2022 (USD Million) 155
TABLE NO. 85. : North America Standing Desks Market Revenue, By End-user, 2023– 2030 (USD Million) 155
TABLE NO. 86. : North America Standing Desks Market Volume, By Material, 2017 – 2022 (K Units) 156
TABLE NO. 87. : North America Standing Desks Market Volume, By Material, 2023– 2030 (K Units) 156
TABLE NO. 88. : North America Standing Desks Market Revenue, By Material, 2017 – 2022 (USD Million) 157
TABLE NO. 89. : North America Standing Desks Market Revenue, By Material, 2023– 2030 (USD Million) 157
TABLE NO. 90. : North America Standing Desks Market Volume, By Distribution Channel, 2017 – 2022 (K Units) 158
TABLE NO. 91. : North America Standing Desks Market Volume, By Distribution Channel, 2023– 2030 (K Units) 158
TABLE NO. 92. : North America Standing Desks Market Revenue, By Distribution Channel, 2017 – 2022 (USD Million) 159
TABLE NO. 93. : North America Standing Desks Market Revenue, By Distribution Channel, 2023– 2030 (USD Million) 159
TABLE NO. 94. : Europe Standing Desks Market Volume, By Country, 2017 – 2022 (K Units) 162
TABLE NO. 95. : Europe Standing Desks Market Volume, By Country, 2023– 2030 (K Units) 162
TABLE NO. 96. : Europe Standing Desks Market Revenue, By Country, 2017 – 2022 (USD Million) 163
TABLE NO. 97. : Europe Standing Desks Market Revenue, By Country, 2023– 2030 (USD Million) 163
TABLE NO. 98. : Europe Standing Desks Market Volume, By Type, 2017 – 2022 (K Units) 164
TABLE NO. 99. : Europe Standing Desks Market Volume, By Type, 2023– 2030 (K Units) 164
TABLE NO. 100. : Europe Standing Desks Market Revenue, By Type, 2017 – 2022 (USD Million) 165
TABLE NO. 101. : Europe Standing Desks Market Revenue, By Type, 2023– 2030 (USD Million) 165
TABLE NO. 102. : Europe Standing Desks Market Volume, By Design, 2017 – 2022 (K Units) 166
TABLE NO. 103. : Europe Standing Desks Market Volume, By Design, 2023– 2030 (K Units) 166
TABLE NO. 104. : Europe Standing Desks Market Revenue, By Design, 2017 – 2022 (USD Million) 167
TABLE NO. 105. : Europe Standing Desks Market Revenue, By Design, 2023– 2030 (USD Million) 167
TABLE NO. 106. : Europe Standing Desks Market Volume, By End-user, 2017 – 2022 (K Units) 168
TABLE NO. 107. : Europe Standing Desks Market Volume, By End-user, 2023– 2030 (K Units) 168
TABLE NO. 108. : Europe Standing Desks Market Revenue, By End-user, 2017 – 2022 (USD Million) 169
TABLE NO. 109. : Europe Standing Desks Market Revenue, By End-user, 2023– 2030 (USD Million) 169
TABLE NO. 110. : Europe Standing Desks Market Volume, By Material, 2017 – 2022 (K Units) 170
TABLE NO. 111. : Europe Standing Desks Market Volume, By Material, 2023– 2030 (K Units) 170
TABLE NO. 112. : Europe Standing Desks Market Revenue, By Material, 2017 – 2022 (USD Million) 171
TABLE NO. 113. : Europe Standing Desks Market Revenue, By Material, 2023– 2030 (USD Million) 171
TABLE NO. 114. : Europe Standing Desks Market Volume, By Distribution Channel, 2017 – 2022 (K Units) 172
TABLE NO. 115. : Europe Standing Desks Market Volume, By Distribution Channel, 2023– 2030 (K Units) 172
TABLE NO. 116. : Europe Standing Desks Market Revenue, By Distribution Channel, 2017 – 2022 (USD Million) 173
TABLE NO. 117. : Europe Standing Desks Market Revenue, By Distribution Channel, 2023– 2030 (USD Million) 173
TABLE NO. 118. : Asia Pacific Standing Desks Market Volume, By Country, 2017 – 2022 (K Units) 176
TABLE NO. 119. : Asia Pacific Standing Desks Market Volume, By Country, 2023– 2030 (K Units) 176
TABLE NO. 120. : Asia Pacific Standing Desks Market Revenue, By Country, 2017 – 2022 (USD Million) 177
TABLE NO. 121. : Asia Pacific Standing Desks Market Revenue, By Country, 2023– 2030 (USD Million) 177
TABLE NO. 122. : Asia Pacific Standing Desks Market Volume, By Type, 2017 – 2022 (K Units) 178
TABLE NO. 123. : Asia Pacific Standing Desks Market Volume, By Type, 2023– 2030 (K Units) 178
TABLE NO. 124. : Asia Pacific Standing Desks Market Revenue, By Type, 2017 – 2022 (USD Million) 179
TABLE NO. 125. : Asia Pacific Standing Desks Market Revenue, By Type, 2023– 2030 (USD Million) 179
TABLE NO. 126. : Asia Pacific Standing Desks Market Volume, By Design, 2017 – 2022 (K Units) 180
TABLE NO. 127. : Asia Pacific Standing Desks Market Volume, By Design, 2023– 2030 (K Units) 180
TABLE NO. 128. : Asia Pacific Standing Desks Market Revenue, By Design, 2017 – 2022 (USD Million) 181
TABLE NO. 129. : Asia Pacific Standing Desks Market Revenue, By Design, 2023– 2030 (USD Million) 181
TABLE NO. 130. : Asia Pacific Standing Desks Market Volume, By End-user, 2017 – 2022 (K Units) 182
TABLE NO. 131. : Asia Pacific Standing Desks Market Volume, By End-user, 2023– 2030 (K Units) 182
TABLE NO. 132. : Asia Pacific Standing Desks Market Revenue, By End-user, 2017 – 2022 (USD Million) 183
TABLE NO. 133. : Asia Pacific Standing Desks Market Revenue, By End-user, 2023– 2030 (USD Million) 183
TABLE NO. 134. : Asia Pacific Standing Desks Market Volume, By Material, 2017 – 2022 (K Units) 184
TABLE NO. 135. : Asia Pacific Standing Desks Market Volume, By Material, 2023– 2030 (K Units) 184
TABLE NO. 136. : Asia Pacific Standing Desks Market Revenue, By Material, 2017 – 2022 (USD Million) 185
TABLE NO. 137. : Asia Pacific Standing Desks Market Revenue, By Material, 2023– 2030 (USD Million) 185
TABLE NO. 138. : Asia Pacific Standing Desks Market Volume, By Distribution Channel, 2017 – 2022 (K Units) 186
TABLE NO. 139. : Asia Pacific Standing Desks Market Volume, By Distribution Channel, 2023– 2030 (K Units) 186
TABLE NO. 140. : Asia Pacific Standing Desks Market Revenue, By Distribution Channel, 2017 – 2022 (USD Million) 187
TABLE NO. 141. : Asia Pacific Standing Desks Market Revenue, By Distribution Channel, 2023– 2030 (USD Million) 187
TABLE NO. 142. : Latin America Standing Desks Market Volume, By Country, 2017 – 2022 (K Units) 190
TABLE NO. 143. : Latin America Standing Desks Market Volume, By Country, 2023– 2030 (K Units) 190
TABLE NO. 144. : Latin America Standing Desks Market Revenue, By Country, 2017 – 2022 (USD Million) 191
TABLE NO. 145. : Latin America Standing Desks Market Revenue, By Country, 2023– 2030 (USD Million) 191
TABLE NO. 146. : Latin America Standing Desks Market Volume, By Type, 2017 – 2022 (K Units) 192
TABLE NO. 147. : Latin America Standing Desks Market Volume, By Type, 2023– 2030 (K Units) 192
TABLE NO. 148. : Latin America Standing Desks Market Revenue, By Type, 2017 – 2022 (USD Million) 193
TABLE NO. 149. : Latin America Standing Desks Market Revenue, By Type, 2023– 2030 (USD Million) 193
TABLE NO. 150. : Latin America Standing Desks Market Volume, By Design, 2017 – 2022 (K Units) 194
TABLE NO. 151. : Latin America Standing Desks Market Volume, By Design, 2023– 2030 (K Units) 194
TABLE NO. 152. : Latin America Standing Desks Market Revenue, By Design, 2017 – 2022 (USD Million) 195
TABLE NO. 153. : Latin America Standing Desks Market Revenue, By Design, 2023– 2030 (USD Million) 195
TABLE NO. 154. : Latin America Standing Desks Market Volume, By End-user, 2017 – 2022 (K Units) 196
TABLE NO. 155. : Latin America Standing Desks Market Volume, By End-user, 2023– 2030 (K Units) 196
TABLE NO. 156. : Latin America Standing Desks Market Revenue, By End-user, 2017 – 2022 (USD Million) 197
TABLE NO. 157. : Latin America Standing Desks Market Revenue, By End-user, 2023– 2030 (USD Million) 197
TABLE NO. 158. : Latin America Standing Desks Market Volume, By Material, 2017 – 2022 (K Units) 198
TABLE NO. 159. : Latin America Standing Desks Market Volume, By Material, 2023– 2030 (K Units) 198
TABLE NO. 160. : Latin America Standing Desks Market Revenue, By Material, 2017 – 2022 (USD Million) 199
TABLE NO. 161. : Latin America Standing Desks Market Revenue, By Material, 2023– 2030 (USD Million) 199
TABLE NO. 162. : Latin America Standing Desks Market Volume, By Distribution Channel, 2017 – 2022 (K Units) 200
TABLE NO. 163. : Latin America Standing Desks Market Volume, By Distribution Channel, 2023– 2030 (K Units) 200
TABLE NO. 164. : Latin America Standing Desks Market Revenue, By Distribution Channel, 2017 – 2022 (USD Million) 201
TABLE NO. 165. : Latin America Standing Desks Market Revenue, By Distribution Channel, 2023– 2030 (USD Million) 201
TABLE NO. 166. : Middle East Standing Desks Market Volume, By Country, 2017 – 2022 (K Units) 204
TABLE NO. 167. : Middle East Standing Desks Market Volume, By Country, 2023– 2030 (K Units) 204
TABLE NO. 168. : Middle East Standing Desks Market Revenue, By Country, 2017 – 2022 (USD Million) 205
TABLE NO. 169. : Middle East Standing Desks Market Revenue, By Country, 2023– 2030 (USD Million) 205
TABLE NO. 170. : Middle East Standing Desks Market Volume, By Type, 2017 – 2022 (K Units) 206
TABLE NO. 171. : Middle East Standing Desks Market Volume, By Type, 2023– 2030 (K Units) 206
TABLE NO. 172. : Middle East Standing Desks Market Revenue, By Type, 2017 – 2022 (USD Million) 207
TABLE NO. 173. : Middle East Standing Desks Market Revenue, By Type, 2023– 2030 (USD Million) 207
TABLE NO. 174. : Middle East Standing Desks Market Volume, By Design, 2017 – 2022 (K Units) 208
TABLE NO. 175. : Middle East Standing Desks Market Volume, By Design, 2023– 2030 (K Units) 208
TABLE NO. 176. : Middle East Standing Desks Market Revenue, By Design, 2017 – 2022 (USD Million) 209
TABLE NO. 177. : Middle East Standing Desks Market Revenue, By Design, 2023– 2030 (USD Million) 209
TABLE NO. 178. : Middle East Standing Desks Market Volume, By End-user, 2017 – 2022 (K Units) 210
TABLE NO. 179. : Middle East Standing Desks Market Volume, By End-user, 2023– 2030 (K Units) 210
TABLE NO. 180. : Middle East Standing Desks Market Revenue, By End-user, 2017 – 2022 (USD Million) 211
TABLE NO. 181. : Middle East Standing Desks Market Revenue, By End-user, 2023– 2030 (USD Million) 211
TABLE NO. 182. : Middle East Standing Desks Market Volume, By Material, 2017 – 2022 (K Units) 212
TABLE NO. 183. : Middle East Standing Desks Market Volume, By Material, 2023– 2030 (K Units) 212
TABLE NO. 184. : Middle East Standing Desks Market Revenue, By Material, 2017 – 2022 (USD Million) 213
TABLE NO. 185. : Middle East Standing Desks Market Revenue, By Material, 2023– 2030 (USD Million) 213
TABLE NO. 186. : Middle East Standing Desks Market Volume, By Distribution Channel, 2017 – 2022 (K Units) 214
TABLE NO. 187. : Middle East Standing Desks Market Volume, By Distribution Channel, 2023– 2030 (K Units) 214
TABLE NO. 188. : Middle East Standing Desks Market Revenue, By Distribution Channel, 2017 – 2022 (USD Million) 215
TABLE NO. 189. : Middle East Standing Desks Market Revenue, By Distribution Channel, 2023– 2030 (USD Million) 215
TABLE NO. 190. : Africa Standing Desks Market Volume, By Country, 2017 – 2022 (K Units) 218
TABLE NO. 191. : Africa Standing Desks Market Volume, By Country, 2023– 2030 (K Units) 218
TABLE NO. 192. : Africa Standing Desks Market Revenue, By Country, 2017 – 2022 (USD Million) 219
TABLE NO. 193. : Africa Standing Desks Market Revenue, By Country, 2023– 2030 (USD Million) 219
TABLE NO. 194. : Africa Standing Desks Market Volume, By Type, 2017 – 2022 (K Units) 220
TABLE NO. 195. : Africa Standing Desks Market Volume, By Type, 2023– 2030 (K Units) 220
TABLE NO. 196. : Africa Standing Desks Market Revenue, By Type, 2017 – 2022 (USD Million) 221
TABLE NO. 197. : Africa Standing Desks Market Revenue, By Type, 2023– 2030 (USD Million) 221
TABLE NO. 198. : Africa Standing Desks Market Volume, By Design, 2017 – 2022 (K Units) 222
TABLE NO. 199. : Africa Standing Desks Market Volume, By Design, 2023– 2030 (K Units) 222
TABLE NO. 200. : Africa Standing Desks Market Revenue, By Design, 2017 – 2022 (USD Million) 223
TABLE NO. 201. : Africa Standing Desks Market Revenue, By Design, 2023– 2030 (USD Million) 223
TABLE NO. 202. : Africa Standing Desks Market Volume, By End-user, 2017 – 2022 (K Units) 224
TABLE NO. 203. : Africa Standing Desks Market Volume, By End-user, 2023– 2030 (K Units) 224
TABLE NO. 204. : Africa Standing Desks Market Revenue, By End-user, 2017 – 2022 (USD Million) 225
TABLE NO. 205. : Africa Standing Desks Market Revenue, By End-user, 2023– 2030 (USD Million) 225
TABLE NO. 206. : Africa Standing Desks Market Volume, By Material, 2017 – 2022 (K Units) 226
TABLE NO. 207. : Africa Standing Desks Market Volume, By Material, 2023– 2030 (K Units) 226
TABLE NO. 208. : Africa Standing Desks Market Revenue, By Material, 2017 – 2022 (USD Million) 227
TABLE NO. 209. : Africa Standing Desks Market Revenue, By Material, 2023– 2030 (USD Million) 227
TABLE NO. 210. : Africa Standing Desks Market Volume, By Distribution Channel, 2017 – 2022 (K Units) 228
TABLE NO. 211. : Africa Standing Desks Market Volume, By Distribution Channel, 2023– 2030 (K Units) 228
TABLE NO. 212. : Africa Standing Desks Market Revenue, By Distribution Channel, 2017 – 2022 (USD Million) 229
TABLE NO. 213. : Africa Standing Desks Market Revenue, By Distribution Channel, 2023– 2030 (USD Million) 229

Frequently asked questions 

Which is the leading market for Standing Desks?

Asia Pacific accounted for the highest share in the global Standing Desks market in terms of value as well as volume.

What are the key drivers for the growth of the Standing Desks market?

The main reasons propelling the market’s expansion are: The rise in health consciousness among consumers throughout the world The rise in demand for ergonomic furniture The availability of standing desks in a range of forms

Which is the major segment in the Standing Desks Market by Product Type?

Standing desks that could be mechanically adjusted held a substantial market share in 2021, accounting for more than 70% of market revenues. Additionally, converter standing desks are anticipated to increase at the greatest rate.

Which is the major segment in the Standing Desks Market by End User?

Commercial accounted for a sizeable portion of the global market in 2021.

Pepper Market

Published:
Report ID: 9123

Diabetic Socks Market

Published:
Report ID: 34537

Online Clothing Rental Market

Published:
Report ID: 7826

India Outdoor Clothing Market

Published:
Report ID: 34246

India Compression Stockings for the Air Travel Market

Published:
Report ID: 34137

Canada Gift Cards Market

Published:
Report ID: 34134

Australia Gift Cards Market

Published:
Report ID: 34131

India and China Baby Food and Formula Market

Published:
Report ID: 6403

United Kingdom (UK) Gift Cards Market

Published:
Report ID: 34009

India Gift Card Market

Published:
Report ID: 34005

Germany Gift Card Market

Published:
Report ID: 33999

France Gift Cards Market

Published:
Report ID: 33995

Purchase Options

$2999
Delivery Format: Excel.
$4999
Designed for the individual purchaser.
$6999
Users located at a single corporate site or regional office.
$7999
Allowed for unlimited sharing globally within one company.
Smallform of Sample request

Have a question?

User Profile

Don’t settle for less – trust Mitul to help you find the best solution.

Report delivery within 24 to 48 hours

– Other Info –

What people say?-

User Review

I am very impressed with the information in this report. The author clearly did their research when they came up with this product and it has already given me a lot of ideas.

Jana Schmidt
CEDAR CX Technologies

– Connect with us –

Phone

+91 6232 49 3207


support

24/7 Research Support


sales@credenceresearch.com

– Research Methodology –

Going beyond the basics: advanced techniques in research methodology

– Trusted By –

Pepshi, LG, Nestle
Motorola, Honeywell, Johnson and johnson
LG Chem, SIEMENS, Pfizer
Unilever, Samsonite, QIAGEN