| REPORT ATTRIBUTE |
DETAILS |
| Historical Period |
2020-2023 |
| Base Year |
2024 |
| Forecast Period |
2025-2032 |
| VOC Recovery and Abatement Market Size 2024 |
USD 1,425.7 million |
| VOC Recovery and Abatement Market, CAGR |
4.63% |
| VOC Recovery and Abatement Market Size 2032 |
USD 12,437.1 million |
Market Overview
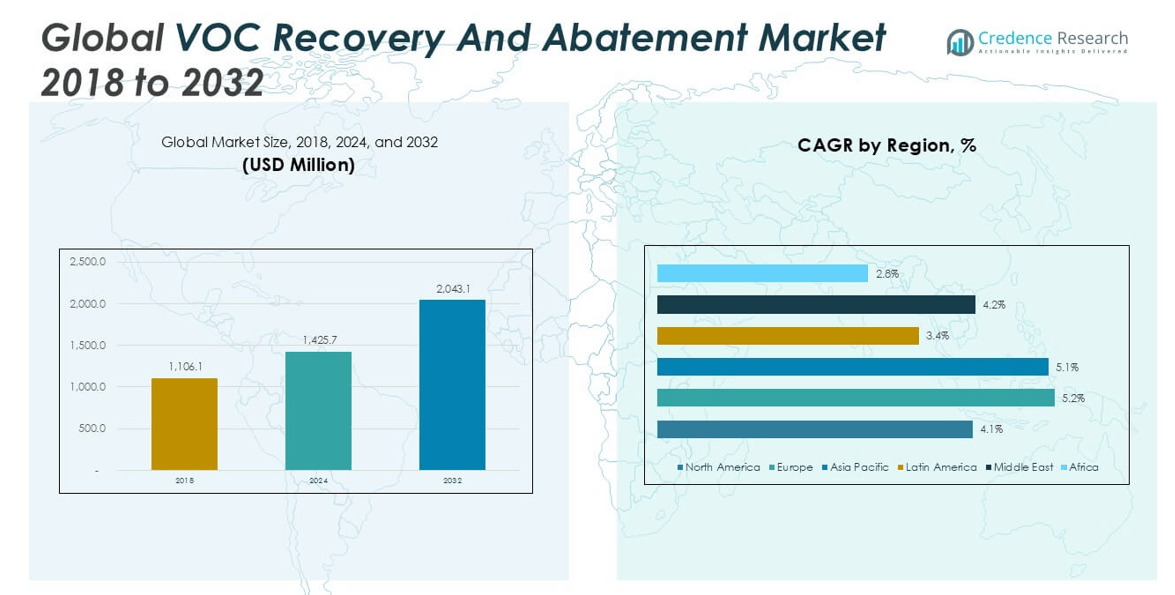
The Global VOC Recovery and Abatement Market is projected to grow from USD 1,425.7 million in 2024 to an estimated USD 2,043.1 million by 2032, with a compound annual growth rate (CAGR) of 4.63% from 2025 to 2032.
The market is primarily driven by rising environmental awareness and the need to reduce air pollution in both developed and developing economies. Technological advancements in VOC control systems, including thermal oxidizers, adsorption systems, and condensation methods, are improving operational efficiency and cost-effectiveness. In addition, increasing industrialization, particularly in Asia Pacific, and the growing emphasis on sustainable manufacturing practices are creating strong demand for advanced VOC management solutions. Government initiatives and incentives for clean technologies are further supporting market growth.
Geographically, Asia Pacific holds a significant share of the global market due to rapid industrial growth and increasing regulatory pressure in countries like China, India, and South Korea. North America and Europe follow, driven by stringent environmental regulations and a mature industrial base. Key players in the global VOC Recovery and Abatement Market include Air Products and Chemicals Inc., Anguil Environmental Systems Inc., Dürr AG, Aairflow Systems Inc., and Calgon Carbon Corporation, all of whom are focusing on innovation and strategic partnerships to enhance market presence.
Access crucial information at unmatched prices!
Request your sample report today & start making informed decisions powered by Credence Research Inc.!
Download Sample
Market Insights
- The Global VOC Recovery and Abatement Market is projected to grow from USD 1,425.7 million in 2024 to USD 2,043.1 million by 2032, at a CAGR of 4.63%.
- Increasing regulatory pressure and growing concern over air quality are key factors accelerating market growth.
- Demand is rising across sectors such as chemicals, oil and gas, automotive, and pharmaceuticals for emission control solutions.
- High capital investment and maintenance costs act as significant barriers, especially for small and mid-sized enterprises.
- Technological advancements like regenerative thermal oxidizers and smart monitoring systems are enhancing system efficiency.
- Asia Pacific leads the market with a 34.7% share in 2024, driven by rapid industrialization and stricter regulations.
- North America and Europe follow with mature markets, while Latin America and the Middle East present emerging growth opportunities.
Market Drivers
Stringent Environmental Regulations Mandating Emission Control Technologies
Government regulations across developed and emerging economies are playing a critical role in driving demand for VOC recovery and abatement solutions. Regulatory bodies such as the U.S. Environmental Protection Agency (EPA) and the European Environment Agency have imposed strict standards for VOC emissions, particularly in industrial and manufacturing sectors. Compliance with these rules requires the deployment of advanced VOC control systems, thereby creating sustained market demand. Countries in Asia Pacific are also tightening emission norms, compelling industries to invest in pollution control infrastructure. This regulatory push is compelling businesses to upgrade or install efficient abatement technologies to avoid penalties and operational restrictions. The Global VOC Recovery and Abatement Market is benefiting significantly from this regulatory landscape, which acts as a strong incentive for long-term growth.
- For instance, in 2023, over 70% of the global VOC abatement system market demand came from regions with the strictest environmental regulations, notably North America, Europe, and rapidly industrializing parts of Asia Pacific
Rising Industrialization and Expansion of Manufacturing Facilities
The global increase in industrial output is a major contributor to VOC emissions, especially in sectors such as chemicals, oil and gas, automotive, and paints and coatings. Rapid industrialization in countries like China, India, and Vietnam has led to increased release of hazardous air pollutants, driving the demand for abatement technologies. Companies are expanding their manufacturing footprints to meet growing product demand, which, in turn, heightens the need for emission control systems. It has led to a broader implementation of recovery solutions across both new and existing plants. Growth in these industries directly correlates with the need to manage emissions efficiently. Market players are capitalizing on this trend by offering scalable and customizable systems tailored to industrial applications.
- For instance, in 2023, Asia Pacific experienced the fastest growth in the VOC abatement market, with industrial sectors such as automotive, electronics, and chemicals accounting for a significant share of new installations to comply with tightening regulations and support rapid expansion
Advancements in Recovery and Abatement Technologies Enhancing Efficiency
Continuous innovations in VOC recovery and abatement technologies are contributing to greater market adoption. Solutions such as regenerative thermal oxidizers, carbon adsorption systems, and cryogenic condensation units are becoming more efficient and cost-effective. These technologies are enabling industries to not only comply with regulations but also recover valuable byproducts, creating economic advantages. The integration of smart monitoring and control systems is improving operational precision and reducing maintenance costs. It is allowing end users to achieve higher reliability and performance from their VOC control infrastructure. Technology providers are investing in R\&D to develop next-generation systems that align with evolving industrial needs.
Increasing Focus on Corporate Sustainability and ESG Goals
Growing emphasis on sustainability and environmental, social, and governance (ESG) goals is prompting companies to take voluntary action on emissions control. Businesses are actively incorporating emission reduction strategies into their sustainability frameworks to enhance brand value and investor appeal. Implementation of VOC recovery and abatement systems helps companies align with climate responsibility objectives and industry best practices. It strengthens their compliance profile while contributing to a cleaner operational footprint. Stakeholders are pressuring organizations to demonstrate accountability in environmental impact, making abatement solutions a key operational priority. This focus on responsible production is amplifying demand across various verticals.
Market Trends
Adoption of Smart Monitoring and Automation Technologies in VOC Systems
The integration of smart technologies is transforming VOC recovery and abatement systems into more responsive and data-driven solutions. Industries are adopting automation tools and real-time monitoring to improve emission control precision and reduce operational downtime. These advancements enable predictive maintenance, ensuring uninterrupted functionality and reducing unplanned shutdowns. Smart systems also support regulatory compliance by offering accurate reporting and documentation of emission levels. The shift toward Industry 4.0 is encouraging the adoption of these digital solutions across process-intensive sectors. The Global VOC Recovery and Abatement Market is witnessing a steady rise in demand for intelligent, automated platforms that enhance process transparency and efficiency.
- For instance, the adoption of smart monitoring systems in VOC abatement solutions has increased by over 50% in recent years, with IoT-enabled sensors and AI-based analytics now standard in new installations across leading industrial sectors
Growth in Demand for Modular and Scalable Abatement Solutions
Industries are increasingly seeking modular and scalable VOC abatement systems that can adapt to fluctuating operational needs. Modular designs allow for easy installation, maintenance, and future expansion, making them suitable for small and large facilities alike. This flexibility is particularly attractive to industries experiencing phased growth or unpredictable production volumes. Scalable solutions help reduce upfront capital expenditure while allowing capacity upgrades over time. It enables manufacturers to align emission control investments with operational requirements and budget constraints. Equipment suppliers are responding to this demand by offering customizable systems tailored to various industrial use cases.
- For instance, breakthroughs in modular abatement systems have enabled scalable deployment, with modular plasma-based abatement technologies now capable of achieving up to 95% VOC removal efficiency, supporting both small-scale and large-scale industrial operations
Emphasis on Energy-Efficient and Cost-Effective Technologies
Rising energy costs and the need for sustainable operations are driving interest in energy-efficient VOC control technologies. Solutions such as regenerative thermal oxidizers (RTOs) and adsorption systems are being optimized to minimize fuel consumption while maximizing VOC destruction efficiency. Manufacturers are designing systems that reduce pressure drop, improve heat recovery, and extend component lifespan. These features contribute to lower total cost of ownership and make adoption more financially viable for mid-size enterprises. It is creating a strong preference for systems that balance compliance with operational savings. Energy optimization is becoming a key differentiator among competing technologies in thmarket.
Expansion of VOC Solutions Across Emerging End-Use Industries
New growth opportunities are emerging from industries beyond traditional sectors such as petrochemicals and coatings. Sectors like food processing, electronics manufacturing, and pharmaceuticals are increasing their use of VOC-generating solvents and processes. This expansion is creating fresh demand for targeted recovery and abatement solutions tailored to these specialized environments. The need to manage indoor air quality and protect worker health is also prompting facilities in these sectors to invest in high-performance emission control systems. It broadens the addressable market and strengthens the long-term outlook for the Global VOC Recovery and Abatement Market. Companies offering industry-specific solutions are gaining a competitive edge in these emerging applications.
Market Challenges
High Capital Investment and Maintenance Costs Restraining Adoption
The initial cost of installing VOC recovery and abatement systems remains a significant barrier for many small and medium-sized enterprises. These systems often require complex engineering, high-performance materials, and integration with existing industrial infrastructure, which increases capital expenditure. Ongoing maintenance costs, including filter replacements, energy consumption, and skilled labor, further elevate operational expenses. This cost structure can deter companies in cost-sensitive industries from implementing advanced abatement solutions. The Global VOC Recovery and Abatement Market faces slower adoption in regions with limited access to financial incentives or subsidies. It limits market penetration, particularly in developing economies.
- For instance, in 2024, an industry survey found that more than 2,300 small and medium-sized manufacturers in Southeast Asia and Eastern Europe postponed or canceled VOC abatement system installations due to upfront costs exceeding $120,000 per site, with over 700 companies citing annual maintenance expenses above $18,000 as a key deterrent, according to procurement records and government environmental compliance reports.
Complexity in System Integration and Regulatory Compliance
Integrating VOC control systems into diverse industrial operations requires careful customization and technical expertise. Each application may involve unique emission profiles, process conditions, and space constraints, making standardized solutions difficult to implement. Ensuring compliance with evolving environmental regulations also demands continuous upgrades and monitoring. Companies without dedicated environmental teams may struggle to keep pace with technical and legal requirements. It creates delays in deployment and increases reliance on third-party service providers. These challenges can hinder market expansion and discourage long-term investment in VOC management infrastructure.
Market Opportunities
Growing Demand for Sustainable Industrial Practices Driving Expansion Opportunities
The increasing global emphasis on sustainability and carbon footprint reduction presents significant growth opportunities for the Global VOC Recovery and Abatement Market. Industries are prioritizing cleaner production methods and investing in technologies that minimize environmental impact. VOC recovery systems offer the dual benefit of emission reduction and resource recovery, aligning with corporate sustainability goals. It allows companies to improve operational efficiency while demonstrating environmental responsibility to regulators and stakeholders. Expansion in emerging economies, where industrialization is accelerating, further supports demand for effective VOC control solutions. Market players can capitalize on this trend by developing innovative, eco-friendly technologies that meet evolving industry requirements.
Emerging Markets and Industry Verticals Present New Growth Avenues
Emerging regions such as Asia Pacific, Latin America, and the Middle East are witnessing rapid industrial growth and tightening environmental regulations, creating untapped market potential. Expanding end-use industries like pharmaceuticals, food processing, and electronics manufacturing also contribute to demand diversification. Tailoring VOC recovery and abatement technologies to address the specific needs of these sectors can unlock new revenue streams. It enables suppliers to broaden their client base beyond traditional heavy industries. Strategic partnerships and localized solutions will strengthen market presence in these fast-growing areas. This diversification supports sustained expansion of the Global VOC Recovery and Abatement Market over the coming years.
Market Segmentation Analysis
By Product Type
The Global VOC Recovery and Abatement Market is segmented into oxidizers, filtration systems, membrane separations, scrubbers and strippers, condensation, and adsorbent systems. Among these, oxidizers hold a dominant share due to their high efficiency in destroying VOCs across various industrial applications. Regenerative thermal oxidizers, in particular, are widely adopted for their energy-saving design and effectiveness in treating high-volume emissions. Filtration systems and adsorbent systems are gaining traction in sectors requiring lower concentration VOC removal and recovery capabilities. Membrane separations and condensation technologies are being used in niche applications where selective recovery of VOCs is critical. Scrubbers and strippers also contribute a stable share, especially in chemical and refining processes. The product mix continues to diversify as industries demand tailored and application-specific solutions.
- For instance, in 2024, a leading environmental technology company reported installing more than 2,500 regenerative thermal oxidizer (RTO) units globally, each capable of treating up to 120,000 cubic meters of exhaust gas per hour in large-scale industrial facilities.
By End User
The end user segmentation of the Global VOC Recovery and Abatement Market includes manufacturing, automotive, and oil and gas industries. The manufacturing sector accounts for the largest revenue share due to its broad application base and strict regulatory environment. It relies heavily on abatement systems to comply with emission standards across processes such as metal coating, printing, and chemical production. The automotive industry follows, driven by the need to manage VOCs in painting and assembly operations. Oil and gas operations also represent a key segment, where VOC emissions arise from refining, storage, and distribution processes. These industries prioritize high-performance systems that offer both regulatory compliance and operational reliability, creating consistent demand across the segment.
- For instance, over 6,000 manufacturing plants in North America alone had upgraded or installed advanced VOC abatement systems, including oxidizers and scrubbers, to meet updated emission standards in metal finishing and chemical processing operations.
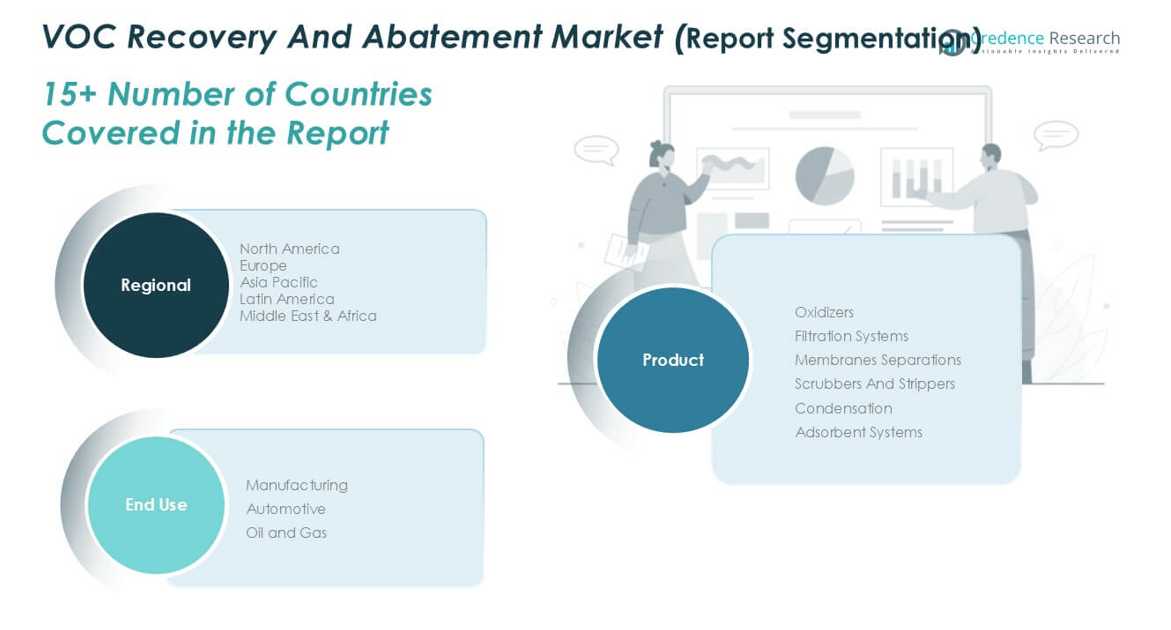
Segments
Based on Product Type
- Oxidizers
- Filtration Systems
- Membranes Separations
- Scrubbers And Strippers
- Condensation
- Adsorbent Systems
Based on End User
- Manufacturing
- Automotive
- Oil and Gas
Based on Region
- North America
- Europe
- UK
- France
- Germany
- Italy
- Spain
- Russia
- Belgium
- Netherlands
- Austria
- Sweden
- Poland
- Denmark
- Switzerland
- Rest of Europe
- Asia Pacific
- China
- Japan
- South Korea
- India
- Australia
- Thailand
- Indonesia
- Vietnam
- Malaysia
- Philippines
- Taiwan
- Rest of Asia Pacific
- Latin America
- Brazil
- Argentina
- Peru
- Chile
- Colombia
- Rest of Latin America
- Middle East
- UAE
- KSA
- Israel
- Turkey
- Iran
- Rest of Middle East
- Africa
- Egypt
- Nigeria
- Algeria
- Morocco
- Rest of Africa
Regional Analysis
North America VOC Recovery and Abatement Market
The North America VOC Recovery and Abatement Market is expected to grow from USD 340.61 million in 2024 to USD 469.92 million by 2032, expanding at a CAGR of 4.1%. The region accounted for approximately 23.9% of the global market share in 2024. Strict environmental regulations from the U.S. Environmental Protection Agency (EPA) and growing focus on industrial emissions control are major factors driving adoption. Key industries such as oil and gas, petrochemicals, and automotive are investing heavily in abatement technologies to comply with national emission standards. The U.S. leads the regional market, supported by advanced infrastructure and strong government policies. It continues to adopt newer, more efficient VOC control systems to meet both regulatory and corporate sustainability goals.
Europe VOC Recovery and Abatement Market
Europe’s VOC Recovery and Abatement Market is projected to rise from USD 321.26 million in 2024 to USD 480.95 million by 2032, at a CAGR of 5.2%, the highest among all regions. Europe held a 22.5% share of the global market in 2024. The EU’s stringent air quality directives and carbon neutrality targets have significantly accelerated the adoption of VOC control solutions across industries. Countries like Germany, France, and Italy are deploying advanced abatement systems in chemical, pharmaceutical, and manufacturing plants. The region emphasizes circular economy practices, supporting systems that recover and reuse VOCs. It remains a key innovation hub for sustainable emission technologies.
Asia Pacific VOC Recovery and Abatement Market
The Asia Pacific VOC Recovery and Abatement Market, the largest regional segment, is anticipated to grow from USD 494.50 million in 2024 to USD 735.53 million by 2032, with a CAGR of 5.1%. The region captured a dominant 34.7% of the global market share in 2024. Rapid industrial expansion in China, India, and Southeast Asia is a core driver of this growth. Governments are implementing stricter emission regulations, compelling industries to adopt compliant technologies. High demand from automotive, electronics, and petrochemical sectors further boosts market penetration. It continues to present high-volume opportunities for manufacturers and technology providers
Latin America VOC Recovery and Abatement Market
Latin America’s market is expected to increase from USD 140.69 million in 2024 to USD 183.88 million by 2032, growing at a CAGR of 3.4%. The region accounted for approximately 9.9% of the global market in 2024. Brazil and Mexico lead regional adoption due to rising environmental concerns and increasing industrial activities. While regulatory enforcement is less strict compared to North America or Europe, public and private investments in environmental technology are growing. Sectors such as oil and gas, mining, and manufacturing are integrating abatement systems to meet evolving standards. It represents an emerging growth area, albeit at a slower pace.
Middle East VOC Recovery and Abatement Market
The Middle East VOC Recovery and Abatement Market is forecasted to grow from USD 93.08 million in 2024 to USD 128.72 million by 2032, at a CAGR of 4.2%. It held a 6.5% share of the global market in 2024. Countries like Saudi Arabia and the UAE are focusing on emission management in the oil, gas, and refining sectors. National initiatives toward sustainability and diversification from oil dependence support the adoption of abatement technologies. Industrial projects in petrochemicals and energy infrastructure are key contributors to regional demand. It continues to adopt VOC solutions in line with broader environmental goals.
Africa VOC Recovery and Abatement Market
Africa’s VOC Recovery and Abatement Market is set to grow from USD 35.52 million in 2024 to USD 44.13 million by 2032, with the lowest regional CAGR of 2.8%. It represented only 2.5% of the global market share in 2024. Limited industrial infrastructure and weak regulatory frameworks have slowed the market’s pace. However, increased awareness of environmental health and growing investment in manufacturing and energy projects are creating gradual demand. South Africa and Nigeria are among the early adopters of VOC control solutions in the region. It offers long-term potential as industrialization advances and environmental policies strengthen.
Shape Your Report to Specific Countries or Regions & Enjoy 30% Off!
Key players
- The Linde Group
- Anguil Environmental Systems, Inc.
- Climate Technologies Corp.
- DCL International Inc.
- Multi Fan Systems Limited
- Praxair Technology, Inc.
- VOCZero Ltd.
- Wartsila Corporation
- Air Products and Chemicals, Inc.
- TANN Corporation
Competitive Analysis
The Global VOC Recovery and Abatement Market is highly competitive, with a mix of multinational corporations and specialized technology providers. Leading players such as The Linde Group, Air Products and Chemicals, Inc., and Praxair Technology, Inc. focus on advanced recovery systems and wide-reaching service networks. Mid-sized firms like Anguil Environmental Systems, Inc. and DCL International Inc. deliver customized solutions across industry-specific applications. Companies are investing in product innovation, strategic partnerships, and energy-efficient systems to maintain a competitive edge. The market sees continuous activity in mergers, technology upgrades, and geographic expansion. It remains innovation-driven, with players leveraging R\&D to address evolving emission regulations and client needs.
Recent Developments
- In May 2025, The Linde Group released its 2024 Sustainable Development Report, detailing a 6.2% reduction in absolute greenhouse gas (GHG) emissions compared to their 2021 baseline. This reduction aligns with Linde’s broader climate goals, and the company is actively employing emission-control technologies, including Volatile Organic Compound (VOC) recovery systems, to achieve further reductions.
- In January 2025, Anguil Environmental Systems, Inc. introduced new electric and hydrogen-fueled catalytic oxidizers to reduce the environmental impact of industrial air pollution control. These systems aim to lower the carbon footprint of industrial processes by offering cleaner energy alternatives for air pollution abatement.
Market Concentration and Characteristics
The Global VOC Recovery and Abatement Market is moderately concentrated, with a mix of established multinational corporations and regional specialists. Leading players hold a significant share due to their technological capabilities, global service networks, and strong customer relationships. The market is characterized by high technical complexity, regulatory influence, and demand for customized solutions across diverse industries. Entry barriers remain substantial due to the capital-intensive nature of the equipment and the need for compliance expertise. It demonstrates a steady pace of innovation, driven by environmental mandates and client expectations for energy efficiency and reliability. Competitive differentiation often hinges on system performance, operational cost, and after-sales support.
Report Coverage
The research report offers an in-depth analysis based on Product Type, End User and Region. It details leading market players, providing an overview of their business, product offerings, investments, revenue streams, and key applications. Additionally, the report includes insights into the competitive environment, SWOT analysis, current market trends, as well as the primary drivers and constraints. Furthermore, it discusses various factors that have driven market expansion in recent years. The report also explores market dynamics, regulatory scenarios, and technological advancements that are shaping the industry. It assesses the impact of external factors and global economic changes on market growth. Lastly, it provides strategic recommendations for new entrants and established companies to navigate the complexities of the market.
Future Outlook
- Governments worldwide will continue to tighten emission norms, compelling industries to invest in advanced VOC recovery and abatement systems to remain compliant.
- The market will see increased integration of IoT, AI, and real-time monitoring technologies, enabling better control, predictive maintenance, and performance optimization.
- Rapid industrialization, growing environmental awareness, and policy reforms in China, India, and Southeast Asia will sustain Asia Pacific’s leadership in market size.
- Industries will favor systems with low energy consumption and high operational efficiency to reduce costs while meeting sustainability goals.
- Clients will increasingly seek modular, scalable, and application-specific solutions that align with diverse industrial setups and evolving operational needs.
- Latin America, Africa, and the Middle East will become key expansion areas as industrial activities grow and environmental policies become more stringent.
- Technologies that enable VOC recovery and reuse will attract interest for their cost-saving and environmental benefits, especially in chemical and petrochemical sectors.
- Large players will pursue strategic acquisitions to expand regional presence, diversify product offerings, and gain access to emerging technologies.
- Companies will prioritize research into more efficient, compact, and sustainable solutions to meet rising demand and address complex industry challenges.
- Businesses aiming to meet ESG targets will integrate VOC abatement systems into sustainability strategies, reinforcing long-term market growth across sectors.


