
Market Overview
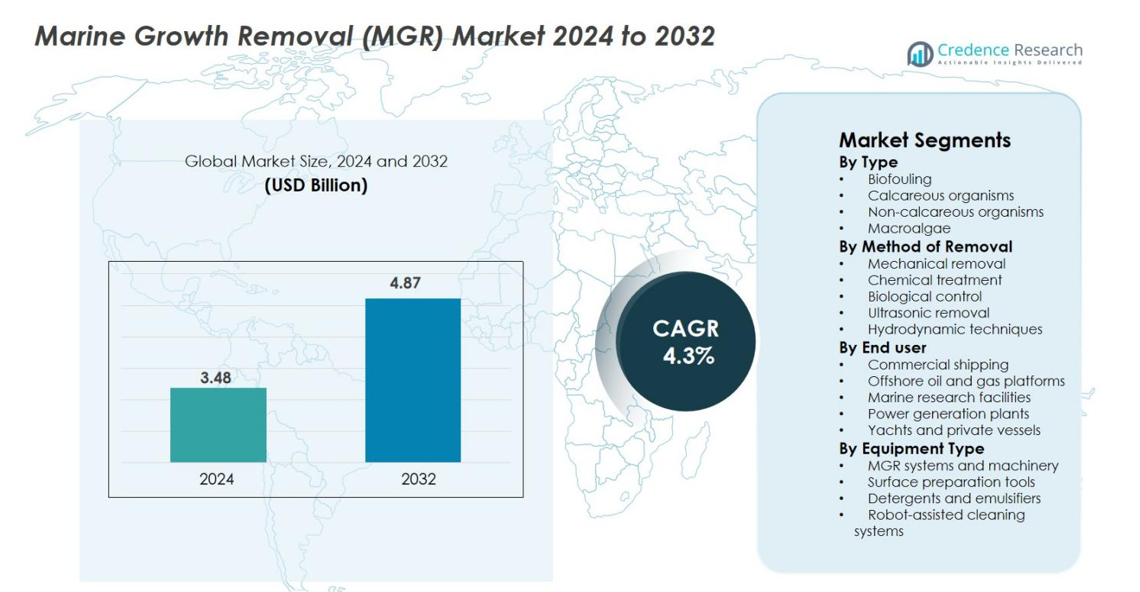
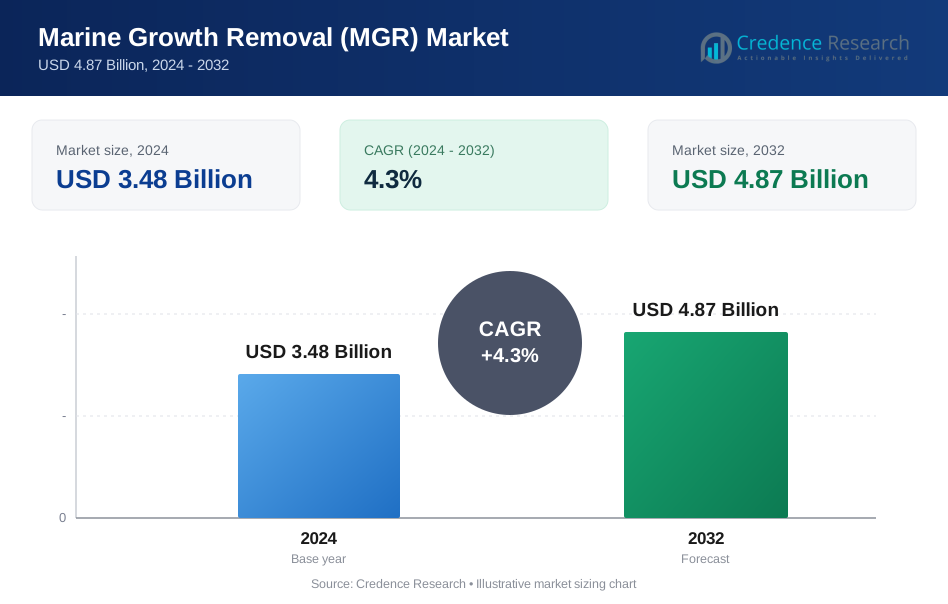
Marine Growth Removal (MGR) Market size was valued at USD 3.48 Billion in 2024 and is anticipated to reach USD 4.87 Billion by 2032, at a CAGR of 4.3% during the forecast period.
| REPORT ATTRIBUTE | DETAILS |
|---|---|
| Historical Period | 2020-2023 |
| Base Year | 2024 |
| Forecast Period | 2025-2032 |
| Marine Growth Removal (MGR) Market Size 2024 | USD 3.48 Billion |
| Marine Growth Removal (MGR) Market, CAGR | 4.3% |
| Marine Growth Removal (MGR) Market Size 2032 | USD 4.87 Billion |
Marine Growth Removal (MGR) Market is shaped by a competitive group of global players that deliver advanced underwater cleaning, inspection, and biofouling-control solutions. Key companies such as Aqua Air LLC, Tube Tech Industrial Ltd., Hydrex NV, Jotun A/S, Kongsberg Gruppen ASA, Oceaneering International, Inc., Schlumberger Limited, TotalEnergies SE, James Fisher & Sons plc, and Subsea 7 S.A. continue to expand capabilities through robotic systems, eco-friendly cleaning methods, and integrated subsea maintenance technologies. Regionally, North America leads the market with a 32.4% share in 2024, driven by strong offshore energy activity, rapid adoption of automation, and stringent environmental compliance requirements.
Market Insights
- Marine Growth Removal (MGR) Market was valued at USD 3.48 billion in 2024 and is projected to reach USD 4.87 billion by 2032, growing at a CAGR of 4.3% during the forecast period.
- Rising maritime traffic, escalating fuel efficiency requirements, and regulatory pressure to control biofouling drive strong adoption; biofouling remained the largest type segment with a 42.6% share in 2024.
- Key trends include rapid integration of robotic cleaning systems, eco-friendly antifouling technologies, and ultrasonic solutions, supported by increased offshore wind and oil platform maintenance needs.
- The competitive landscape features players such as Aqua Air LLC, Hydrex NV, Jotun A/S, Oceaneering International, and Schlumberger, focusing on automation, sustainability, and service expansion to strengthen market positioning.
- North America led the market with a 32.4% regional share in 2024, followed by Europe at 28.7% and Asia-Pacific at 24.1%, driven by offshore energy investments, regulatory compliance, and expanding commercial shipping activities.
Market Segmentation Analysis
By Type
The Marine Growth Removal (MGR) market by type is dominated by biofouling, accounting for 42.6% share in 2024, driven by its widespread occurrence across hulls, pipelines, subsea structures, and offshore rigs. Biofouling significantly increases fuel consumption, corrosion risks, and maintenance frequency, prompting operators to adopt frequent cleaning and growth-prevention measures. Calcareous and non-calcareous organisms collectively contribute to rising operational burdens in offshore assets, while macroalgae growth demands periodic intervention in coastal facilities. Increasing global maritime traffic, strict environmental compliance standards, and the need to maintain asset efficiency continue to strengthen demand across all type categories.
- For instance, Maersk introduced enhanced underwater cleaning protocols after documented barnacle accumulation increased drag across several fleet segments, leading to measurable CO₂ emission reductions post-cleaning.
By Method of Removal
Mechanical removal held the largest share at 47.3% in 2024, owing to its proven effectiveness, adaptability to various marine environments, and compatibility with diver-assisted and robotic cleaning systems. It remains the preferred solution for offshore rigs, FPSOs, and vessel hulls where heavy biofouling and calcareous deposits require robust intervention. Chemical treatments, biological control, ultrasonic removal, and hydrodynamic techniques are gaining adoption as operators explore non-toxic and automated alternatives. Advancements in remote-operated cleaning robots and real-time inspection technologies further boost demand for diverse and efficiency-focused removal methods.
- For instance, ECOsubsea reported a surge in global deployments of its diver-operated mechanical hull-cleaning system, which captures biofouling debris for safe disposal, aligning with IMO environmental compliance.
By End User
The end-user landscape is led by commercial shipping, capturing 39.8% share in 2024, driven by the need to reduce fuel penalties, optimize voyage efficiency, and comply with global antifouling regulations. Offshore oil and gas platforms represent a fast-growing segment as underwater infrastructure requires routine cleaning to prevent flow disruptions and equipment degradation. Marine research facilities and power generation plants also rely on MGR solutions to maintain uninterrupted operations, while yachts and private vessels increasingly adopt eco-friendly removal techniques. The rising emphasis on asset longevity and environmental performance strengthens growth across all end-user categories.
Key Growth Drivers
Rising Global Maritime Activity and Fuel Efficiency Requirements
The Marine Growth Removal (MGR) market experiences strong growth due to increasing global maritime traffic, expanding offshore infrastructure, and rising pressure to improve vessel fuel efficiency. Biofouling on ship hulls can increase fuel consumption by 20–40%, prompting operators to adopt routine cleaning solutions to reduce drag and operational costs. International Maritime Organization (IMO) guidelines on hull performance and emissions compliance further accelerate the adoption of advanced removal technologies. Offshore oil and gas platforms, subsea pipelines, and renewable energy structures such as offshore wind farms also require frequent maintenance to preserve structural integrity. As global shipping networks expand and sustainability targets tighten, demand for efficient and non-invasive MGR systems continues to rise across both commercial and defense sectors.
- For instance, the IMO reported that inadequate hull-cleaning practices increased global shipping CO₂ emissions significantly, prompting major fleets to adopt regular mechanical and robotic cleaning programs to maintain fuel efficiency.
Stringent Environmental Regulations and Compliance Standards
Strengthening environmental regulations significantly drive adoption of modern MGR solutions. Global frameworks such as IMO’s Biofouling Guidelines and regional mandates in Europe, Australia, and the U.S. require vessels and offshore operators to implement approved antifouling and cleaning strategies that mitigate marine invasive species transfer and minimize ecological disruption. These policies push the industry toward eco-friendly and non-toxic removal methods, including robotic cleaning, ultrasonic systems, and biodegradable chemical formulations. Compliance-driven modernization is particularly strong among commercial shipping fleets and offshore assets operating across multiple regulatory jurisdictions. As countries tighten enforcement and mandate documentation of hull hygiene practices, companies increasingly invest in efficient MGR technologies that ensure regulatory alignment while maintaining operational uptime and protecting marine ecosystems.
- For instance, New Zealand’s Ministry for Primary Industries (MPI) enforced stricter vessel-entry rules requiring documented biofouling management plans, leading operators to adopt compliant underwater cleaning systems before port arrival.
Technological Advancements in Robotic and Automated Cleaning Solutions
Rapid innovation in robotics, automation, sensor technologies, and real-time imaging significantly accelerates market growth. Advanced underwater drones, ROV-based cleaning units, and AI-enabled inspection tools provide safer, faster, and more precise marine growth removal compared to diver-based operations. These systems reduce downtime, minimize human risk, and deliver consistent cleaning quality for complex offshore structures and large vessels. Automated hull-cleaning robots equipped with high-pressure brushes, magnetic adhesion, and environmental containment systems are becoming mainstream in shipyards and port facilities. Additionally, innovations in ultrasonic and hydrodynamic techniques are creating non-contact, energy-efficient cleaning alternatives. As digitalization expands across maritime operations, demand for intelligent, remote-controlled, and data-driven MGR technologies continues to increase, reshaping long-term maintenance strategies.
Key Trends & Opportunities
Shift Toward Eco-Friendly and Non-Toxic Removal Technologies
A major trend transforming the MGR market is the rising adoption of environmentally responsible cleaning solutions. Operators increasingly seek methods that avoid harmful chemicals, reduce contamination, and prevent the spread of biofouling residues into marine ecosystems. This shift fuels demand for biodegradable treatment agents, water-efficient hydrodynamic systems, and zero-discharge robotic technologies. Ports and regulatory bodies are also encouraging containment-based cleaning solutions to minimize ecological disruption. Growing investment in green maritime technologies, circular maintenance practices, and ESG-driven operational frameworks creates new opportunities for manufacturers to innovate and offer sustainable alternatives. As environmental impact becomes a core decision-making factor, companies delivering low-impact, compliant MGR solutions stand to capture significant market share globally.
- For instance, the Port of Gothenburg expanded its approval of environmentally safe underwater cleaning technologies that operate with zero discharge, encouraging vessels to adopt sustainable removal practices.
Expansion of Offshore Renewable Energy Infrastructure
The rapid expansion of offshore wind farms, tidal energy installations, and subsea power transmission networks opens substantial opportunities for MGR technology providers. Marine growth accumulation on turbines, risers, cables, and support structures hampers energy output, increases hydrodynamic loads, and accelerates corrosion, necessitating regular cleaning cycles. Offshore renewable developers increasingly rely on robotic and remote-maintenance systems to minimize downtime and reduce costly manual interventions. As global governments scale up renewable energy investments and commit to offshore capacity additions, the need for continuous subsea asset maintenance becomes central to project longevity. This creates high-value opportunities for specialized MGR systems tailored to renewable infrastructure, including autonomous crawlers, precision cleaning tools, and AI-driven inspection systems.
- For instance, Equinor expanded use of remotely operated inspection systems on its floating wind projects after marine growth was found to be increasing mooring-line drag and fatigue loads, requiring periodic removal cycles.
Key Challenges
High Operational Costs and Limited Accessibility in Deepwater Environments
One of the major challenges in the MGR market is the high cost associated with underwater cleaning operations, especially in deepwater and harsh marine environments. Complex subsea structures, strong currents, visibility limitations, and corrosion-prone surfaces require specialized equipment and skilled operators, significantly increasing maintenance budgets. Deepwater fields and remote offshore platforms face additional logistical challenges, including vessel mobilization, safety risks to divers, and equipment downtime. Although robotic solutions reduce some costs, their initial investment and maintenance expenses remain high for smaller operators. These constraints often lead to deferred cleaning schedules, which further accelerates marine growth accumulation and long-term structural degradation, creating a cyclical challenge for asset owners.
Environmental and Safety Concerns Associated with Removal Techniques
Several MGR methods face scrutiny due to environmental and safety concerns, particularly chemical treatments and abrasive mechanical cleaning systems. Chemical agents risk contaminating surrounding waters and harming marine ecosystems if not properly contained. Mechanical tools, while effective, may damage protective coatings or create sediment plumes that impact visibility and local habitats. Safety risks for divers persist in hazardous underwater conditions, prompting regulators to impose stricter operational standards. Achieving compliance while balancing cleaning effectiveness remains a significant challenge. Integrating safer, low-impact alternatives such as ultrasonic and biological control methods is essential but requires technological maturity and broader market acceptance.
Regional Analysis
North America
North America holds a significant position in the Marine Growth Removal (MGR) market, accounting for 32.4% share in 2024, driven by extensive offshore oil and gas operations in the U.S. Gulf of Mexico and strong adoption of automated cleaning technologies. The region’s commercial shipping fleet, expanding offshore wind projects, and strict environmental compliance standards further accelerate demand for advanced MGR solutions. U.S. and Canadian ports continue to invest in hull cleaning, invasive species control, and robotic underwater inspection systems. Increasing focus on fuel efficiency, emissions reduction, and asset life extension solidifies ongoing market growth across maritime and offshore industries.
Europe
Europe captured 28.7% share in 2024, supported by stringent regulatory frameworks focused on biofouling management and maritime decarbonization goals. Major shipping nations—including Norway, the U.K., Germany, and the Netherlands—actively deploy eco-friendly cleaning technologies to comply with IMO guidelines and EU environmental directives. The region’s rapidly expanding offshore wind sector also drives substantial MGR demand, particularly for turbine foundations, subsea cables, and inspection tasks. Investments in autonomous underwater vehicles and sustainable hull-care technologies continue to rise. Europe’s long-standing commitment to marine ecosystem protection and operational efficiency fosters strong adoption of advanced MGR solutions.
Asia-Pacific
Asia-Pacific dominates long-term expansion potential, holding 24.1% market share in 2024 and benefiting from the world’s busiest shipping lanes, large commercial fleets, and extensive shipbuilding activities. China, Japan, South Korea, Singapore, and India lead the region’s adoption of hull cleaning, underwater inspection, and growth-prevention technologies. Rapid offshore oil and gas development, rising port congestion, and the proliferation of offshore wind farms enhance market opportunities. Government focus on maritime environmental compliance and ballast-biofouling control also boosts demand. As regional economies expand maritime trade and offshore infrastructure, Asia-Pacific emerges as a high-growth hub for technologically advanced MGR solutions.
Latin America
Latin America accounted for 8.2% share in 2024, driven by offshore exploration activities in Brazil and Mexico and increasing maintenance needs for subsea assets in deepwater fields. Growing vessel traffic along major trade routes and expanding port modernization initiatives support the adoption of MGR services. The region’s offshore oil platforms frequently require mechanical and robotic cleaning to address heavy biofouling accumulation, ensuring operational continuity. Environmental regulations are gradually strengthening, pushing operators toward safer and more efficient removal methods. Continued energy-sector investment and rising maritime logistics activity create steady demand for diversified MGR solutions across coastal nations.
Middle East & Africa
The Middle East & Africa region held 6.6% share in 2024, primarily supported by offshore oil production hubs in Saudi Arabia, the UAE, and West Africa. Extensive subsea pipelines, rigs, and FPSOs require routine marine growth management to ensure operational efficiency in harsh marine environments. Ports across the Middle East are adopting advanced hull-cleaning and inspection technologies as part of broader maritime modernization programs. Africa’s emerging offshore gas projects and growing commercial vessel traffic further contribute to market expansion. Increasing emphasis on equipment longevity, environmental protection, and cost-effective maintenance strengthens the region’s adoption of MGR technologies.
Market Segmentations
By Type
- Biofouling
- Calcareous organisms
- Non-calcareous organisms
- Macroalgae
By Method of Removal
- Mechanical removal
- Chemical treatment
- Biological control
- Ultrasonic removal
- Hydrodynamic techniques
By End user
- Commercial shipping
- Offshore oil and gas platforms
- Marine research facilities
- Power generation plants
- Yachts and private vessels
By Equipment Type
- MGR systems and machinery
- Surface preparation tools
- Detergents and emulsifiers
- Robot-assisted cleaning systems
By Geography
- North America
- U.S.
- Canada
- Mexico
- Europe
- Germany
- France
- U.K.
- Italy
- Spain
- Rest of Europe
- Asia Pacific
- China
- Japan
- India
- South Korea
- South-east Asia
- Rest of Asia Pacific
- Latin America
- Brazil
- Argentina
- Rest of Latin America
- Middle East & Africa
- GCC Countries
- South Africa
- Rest of the Middle East and Africa
Competitive Landscape
The competitive landscape of the Marine Growth Removal (MGR) market is characterized by a mix of specialized service providers, underwater technology companies, and large offshore engineering firms competing to deliver efficient, safe, and environmentally compliant cleaning solutions. Key players such as Aqua Air LLC, Tube Tech Industrial Ltd., Hydrex NV, Jotun A/S, Kongsberg Gruppen ASA, Oceaneering International, Inc., Schlumberger Limited, TotalEnergies SE, James Fisher & Sons plc, and Subsea 7 S.A. focus on expanding their portfolios through advanced robotic systems, ultrasonic cleaning technologies, biofouling-resistant coatings, and integrated inspection-maintenance platforms. Companies increasingly invest in automation, AI-based imaging, and non-invasive hydrodynamic cleaning tools to enhance safety and reduce operational downtime. Strategic partnerships with shipyards, port authorities, and offshore operators further strengthen market penetration. Growing emphasis on sustainable and regulatory-compliant solutions is encouraging players to innovate eco-friendly methods that minimize environmental impact while improving long-term asset performance.
Key Player Analysis
- TotalEnergies SE
- Hydrex NV
- Oceaneering International, Inc.
- Kongsberg Gruppen ASA
- Aqua Air LLC
- Jotun A/S
- Tube Tech Industrial Ltd.
- Schlumberger Limited
- James Fisher & Sons plc
- Subsea 7 S.A.
Recent Developments
- In May 2025, a broader hull-cleaning and repair market report which includes MGR services projected growth driven by stricter environmental regulations and rising maritime activity.
- In April 2025, the company Greensea IQ announced that its “EverClean” service was officially approved as a certified hull-grooming provider for vessels coated with GIT Coatings foul-release systems.
- In January 2025, LARABICUS GmbH introduced an AI-powered cleaning robot capable of autonomously removing marine growth, marking a technological advance in biofouling removal
Report Coverage
The research report offers an in-depth analysis based on Type, Method of Removal, End-User, Equipment Type and Geography. It details leading market players, providing an overview of their business, product offerings, investments, revenue streams, and key applications. Additionally, the report includes insights into the competitive environment, SWOT analysis, current market trends, as well as the primary drivers and constraints. Furthermore, it discusses various factors that have driven market expansion in recent years. The report also explores market dynamics, regulatory scenarios, and technological advancements that are shaping the industry. It assesses the impact of external factors and global economic changes on market growth. Lastly, it provides strategic recommendations for new entrants and established companies to navigate the complexities of the market.
Future Outlook
- The Marine Growth Removal market will see increasing adoption of robotic and autonomous cleaning systems to reduce diver dependency.
- Growing offshore wind installations will significantly boost demand for continuous subsea cleaning and inspection solutions.
- Eco-friendly and non-toxic antifouling technologies will gain traction as environmental regulations strengthen globally.
- Ports and shipyards will adopt real-time hull performance monitoring to optimize cleaning schedules and reduce fuel penalties.
- Advancements in ultrasonic and hydrodynamic cleaning methods will improve efficiency and minimize environmental impact.
- AI-driven imaging and predictive maintenance tools will enhance accuracy in detecting and removing marine growth.
- Cross-industry collaborations between energy firms, maritime service providers, and technology developers will accelerate innovation.
- Commercial shipping operators will increasingly integrate automated MGR systems to meet decarbonization targets.
- Offshore oil and gas platforms will invest heavily in frequent subsea maintenance to extend asset life and reduce downtime.
- Emerging markets in Asia-Pacific and Latin America will witness rapid growth as maritime infrastructure and offshore activities expand.
Request a Free Sample
Fill in your details and we'll send you a free sample report.
- Sample data tables & charts
- Research methodology
Need a Custom Version of This Report?
Tailor the scope, geography, or segments to your exact requirements.
- Custom geography or segment scope
- Direct access to our analyst team
Frequently Asked Questions
What is the current market size for Marine Growth Removal (MGR) market, and what is its projected size in 2032?
At what Compound Annual Growth Rate is the Marine Growth Removal (MGR) market projected to grow between 2025 and 2032?
Who are the major players in this market?
What are the primary factors fueling the growth of the Marine Growth Removal (MGR) market?
Who are the leading companies in the Marine Growth Removal (MGR) market?
Table of Content
Chapter 1. Report Introduction
- 1.1 Report Description & Purpose
- 1.1.1 Report Title & Market Definition
- 1.1.2 Unique Selling Propositions (USP) & Key Differentiators
- 1.1.3 Value Proposition for Stakeholders
- 1.2 Research Objectives
- 1.2.1 Market Sizing Objectives (Volume & Revenue)
- 1.2.2 Segmentation Objectives
- 1.2.3 Competitive Intelligence Objectives
- 1.2.4 Forecast & Scenario Objectives
- 1.3 Report Scope
- 1.3.1 Marine Growth Removal (MGR) Scope – Types & Subtypes Covered
- 1.3.2 Geographic Scope – Regions & Countries Covered
- 1.3.3 Historical Period, Base Year & Forecast Period (2024; forecast to 2032)
- 1.3.4 Inclusions & Exclusions
- 1.4 HS Code & Classification Framework
- 1.5 Currency, Units & Pricing Basis
- 1.6 Target Stakeholders
- 1.7 Limitations & Assumptions
Chapter 2. Executive Summary
- 2.1 Global Marine Growth Removal (MGR) Market Snapshot
- 2.1.1 Market Size – Historical (2024) & Forecast (2024-2032) (2024: USD 3.48 Billion → 2032: USD 4.87 Billion)
- 2.1.2 Volume & Revenue – Global Totals
- 2.1.3 Key Market Highlights – Top Five Facts
- 2.2 Marine Growth Removal (MGR) Market Segmentation Snapshot
- 2.2.1 Market Split by Region – 2024 vs. 2032
- 2.3 Competitive Snapshot
- 2.3.1 Top 10 Players by Revenue Share – 2024
- 2.3.2 Top 10 Players by Volume Share – 2024
- 2.3.3 Recent Strategic Developments (18-Month Summary)
- 2.4 Key Investment Highlights & Strategic Conclusions
Chapter 3. Marine Growth Removal (MGR) Market Dynamics & Industry Analysis
- 3.1 Market Overview & Context
- 3.1.1 Marine Growth Removal (MGR) Market Position in the Broader Automotive Value Chain
- 3.1.2 OEM vs. Replacement Market Dynamics
- 3.1.3 Market Maturity & Development Stage by Region
- 3.2 Marine Growth Removal (MGR) Market Drivers
- 3.3 Marine Growth Removal (MGR) Market Restraints & Challenges
- 3.4 Marine Growth Removal (MGR) Market Opportunities
- 3.5 Porter's Five Forces Analysis
- 3.5.1 Threat of New Entrants
- 3.5.2 Bargaining Power of Suppliers
- 3.5.3 Bargaining Power of Buyers
- 3.5.4 Threat of Substitutes
- 3.5.5 Competitive Rivalry – Intensity Assessment
- 3.6 Marine Growth Removal (MGR) Value Chain Analysis
- 3.6.1 Upstream – Raw Material/Input Suppliers
- 3.6.1.1 Raw Material/Input 1
- 3.6.1.2 Raw Material/Input 2
- 3.6.1.3 Raw Material/Input 3
- 3.6.2 Midstream – Production/Manufacturing/Service Delivery
- 3.6.2.1 Production/Process Overview
- 3.6.2.2 Key Facility Locations & Capacity by Manufacturer
- 3.6.3 Downstream – Distribution & End Consumer
- 3.6.3.1 Primary Channel – B2B/OEM
- 3.6.3.2 Secondary Channels – Dealer, Retail, Online, Direct
- 3.6.4 Value Chain Profitability Analysis
- 3.6.1 Upstream – Raw Material/Input Suppliers
- 3.7 PESTEL Analysis
- 3.7.1 Political Factors
- 3.7.2 Economic Factors
- 3.7.3 Social Factors
- 3.7.4 Technological Factors
- 3.7.5 Environmental Factors
- 3.7.6 Legal Factors
- 3.8 Marine Growth Removal (MGR) Supply Chain Analysis
- 3.8.1 Raw Material/Input Supply Risk Assessment
- 3.8.2 Manufacturing Concentration Risk (Geographic Exposure)
- 3.8.3 Trade Disruption Impact Analysis
- 3.9 Regulatory & Policy Landscape
Note: The regulatory and policy landscape section covers regulations based on their applicability to the market, Marine Growth Removal (MGR) category, geography, and scope of the study. Only regulatory frameworks with a material impact on operations, compliance, trade, sustainability, or market access are analyzed in detail.
Chapter 4. Key Investment Pockets & Opportunity Analysis
- 4.1 Marine Growth Removal (MGR) Market Attractiveness Analysis
- 4.1.1 By Region – Investment Attractiveness Matrix (Volume × CAGR)
- 4.2 Absolute Revenue Growth Opportunity
- 4.2.1 By Region – Absolute USD Growth Through 2032
- 4.3 Incremental Volume Opportunity
- 4.3.1 By Region – Incremental Volume Through 2032
- 4.3.2 Segment – Incremental Volume
- 4.4 Emerging Submarket Opportunity Deep Dive (Subject to Applicability)
- 4.5 Emerging Market Opportunity Scorecards
- 4.5.1 United States
- 4.5.2 Europe
- 4.5.3 Asia
- 4.5.4 Middle East & Africa
Note: Emerging Market Opportunity Scorecards will be included based on relevance and strategic importance. Regions listed are indicative and may vary depending on data availability and market dynamics.
Chapter 5. Marine Growth Removal (MGR) Import-Export Analysis & Trade Flows
- 5.1 Global Trade Overview
- 5.1.1 Global Export Value by Country (2024)
- 5.1.2 Global Export Volume by Country (2024)
- 5.1.3 Global Import Value by Country (2024)
- 5.1.4 Global Import Volume by Country (2024)
- 5.1.5 Net Trade Balance by Country (2024)
- 5.2 Export Analysis – Segment
- 5.2.1 Type 1 (HS Code)
- 5.2.2 Type 2 (HS Code)
- 5.2.3 Type 3 (HS Code)
- 5.2.4 Type 4 (HS Code)
- 5.2.5 Type 5 (HS Code)
- 5.3 Import Analysis – Segment
- 5.3.1 Type 1 (HS Code)
- 5.3.2 Type 2 (HS Code)
- 5.3.3 Type 3 (HS Code)
- 5.3.4 Type 4 (HS Code)
- 5.3.5 Type 5 (HS Code)
- 5.4 Average Unit Trade Prices
- 5.4.1 Average Export Price – Segment & Country
- 5.4.2 Average Import Price – Segment & Source Country
- 5.4.3 Price Trends (2024)
- 5.5 Key Trade Route Analysis
- 5.5.1 Trade Route 1
- 5.5.2 Trade Route 2
- 5.5.3 Trade Route 3
- 5.5.4 Trade Route 4
- 5.5.5 Trade Route 5
- 5.6 Trade Policy Impact Assessment
- 5.6.1 US Anti-Dumping & Section 301 Tariffs
- 5.6.2 EU Customs Union Impact
- 5.6.3 Major Free Trade Agreements
- 5.6.4 USMCA Rules of Origin
Note: Trade policy analysis will be included only where relevant to the Marine Growth Removal (MGR) market.
Chapter 6. Competitive Landscape & Company Benchmarking
- 6.1 Marine Growth Removal (MGR) Market Concentration & Structure
- 6.1.1 Herfindahl-Hirschman Index (HHI) – vs. 2024
- 6.1.2 Tier 1, Tier 2 & Tier 3 Market Structure
- 6.1.3 Global, Regional & Local Player Dynamics
- 6.2 Marine Growth Removal (MGR) Market Share Analysis – 2024
- 6.2.1 Global Revenue Share by Company
- 6.2.2 Global Volume Share by Company
- 6.2.3 Regional Revenue Share
- 6.2.4 Market Share Evolution ( vs. 2024)
- 6.2.5 OEM Segment Share by Company
- 6.2.6 Replacement Segment Share by Company
- 6.3 Production/Delivery Capacity & Facility Analysis
- 6.3.1 Global Installed Capacity
- 6.3.2 Capacity Utilization Rates
- 6.3.3 Production/Output Volume
- 6.3.4 Facility Locations & Capacity Map
- 6.3.5 Planned Capacity Additions
- 6.4 Marine Growth Removal (MGR) Competitive Benchmarking Matrix
- 6.4.1 Revenue, Volume, CAGR & Profitability Comparison
- 6.4.2 Channel Revenue Mix
- 6.4.3 Geographic Revenue Exposure
- 6.4.4 R&D Intensity
- 6.4.5 Sustainability Maturity
- 6.5 Strategic Developments in Marine Growth Removal (MGR) (Last 24 Months)
- 6.5.1 Mergers, Acquisitions & Divestments
- 6.5.2 New Marine Growth Removal (MGR) Launches
- 6.5.3 Facility Expansions
- 6.5.4 Strategic Alliances, Joint Ventures & Partnerships
- 6.5.5 Distribution Expansion & Market Entry
- 6.5.6 Sustainability & ESG Initiatives
- 6.6 Competitive Strategy Mapping
- 6.6.1 Leader, Challenger, Follower & Niche Classification
- 6.6.2 Pricing Strategy Comparison
- 6.6.3 Channel Strategy Matrix
Note: Strategic developments are included based on their materiality and the availability of reliable information.
Chapter 7. Global Marine Growth Removal (MGR) Market – By Distribution Channel
- 7.1 Segment Overview
- 7.1.1 Volume & Revenue Split by Channel (2024 & 2032)
- 7.1.2 Channel Mix Evolution (2024-2032)
Chapter 8. Regional Market Analysis – Global Overview
- 8.1 Global Regional Overview
- 8.1.1 Regional Volume Share
- 8.1.2 Regional Revenue Share
- 8.1.3 Regional Volume by Region
- 8.1.4 Regional Revenue by Region
- 8.1.5 Regional Forecast Through 2032
- 8.2 Cross-Regional Segment Analysis
- 8.2.1 By Distribution Channel
- 8.2.2 By Brand/Price Tier
Chapter 9. North America Marine Growth Removal (MGR) Market
- 9.1 United States
- 9.2 Canada
- 9.3 Mexico
Chapter 10. Europe Marine Growth Removal (MGR) Market
- 10.1 Germany
- 10.2 France
- 10.3 Italy
- 10.4 United Kingdom
- 10.5 Spain
- 10.6 Poland
- 10.7 Russia
- 10.8 Netherlands
- 10.9 Belgium
- 10.10 Sweden
- 10.11 Denmark
- 10.12 Norway
- 10.13 Rest of Europe
Chapter 11. Asia Pacific Marine Growth Removal (MGR) Market
- 11.1 China
- 11.2 India
- 11.3 Japan
- 11.4 South Korea
- 11.5 Thailand
- 11.6 Indonesia
- 11.7 Vietnam
- 11.8 Malaysia
- 11.9 Australia
- 11.10 Rest of Asia Pacific
Chapter 12. Latin America Marine Growth Removal (MGR) Market
- 12.1 Brazil
- 12.2 Argentina
- 12.3 Colombia
- 12.4 Chile
- 12.5 Rest of Latin America
Chapter 13. Middle East Marine Growth Removal (MGR) Market
- 13.1 Saudi Arabia
- 13.2 United Arab Emirates
- 13.3 Turkey
- 13.4 Israel
- 13.5 Iran
- 13.6 Rest of the Middle East
Chapter 14. Africa Marine Growth Removal (MGR) Market
- 14.1 South Africa
- 14.2 Egypt
- 14.3 Nigeria
- 14.4 Morocco
- 14.5 Rest of Africa
Chapter 15. Marine Growth Removal (MGR) Company Profiles
- 15.1 [Company 01]
- 15.1.1 Company Overview
- 15.1.2 Key Management Personnel
- 15.1.3 Products & Services Portfolio
- 15.1.4 Financial Performance
- 15.1.5 Key Market Focus & Geographic Presence
- 15.1.6 Recent Developments & Strategic Initiatives
Note: The company profile list is preliminary and may change based on research findings, market developments, data availability, and client requirements.
Chapter 16. Appendices
- Appendix A – List of Abbreviations & Acronyms
- Appendix B – Industry Classification Code Reference – Full Series
- Appendix C – Production & Capacity Data Tables
- Appendix D – End-Use & Demand Base Tables
- Appendix E – Consumption & Replacement Rate Assumptions
- Appendix F – ASP Reference Tables
- Appendix G – Manufacturing & Facility Database
- Appendix H – Import-Export Data Tables
- Appendix I – Regulatory Summary Tables
- Appendix J – Primary Research Participant List (Anonymized)
- Appendix K – Primary Research Questionnaire Framework
- Appendix L – Data Sources & Bibliography
- Appendix M – Market Size Divergence & Source Comparison
Chapter 17. Research Methodology
- 17.1 Research Framework & Philosophy
- 17.2 Secondary Research – Sources, Hierarchy & Data Extraction
- 17.3 Data Modeling – Bottom-Up & Top-Down Market Sizing
- 17.4 Primary Research – Stakeholder Framework, LOI & Sample Sizes
- 17.5 Forecast Methodology – Regression, Scenario & Sensitivity Analysis
- 17.6 Quality Control – Four-Layer Validation Framework
- 17.7 Limitations & Standard Assumptions
- 17.8 Disclaimer
