
Market Overview:
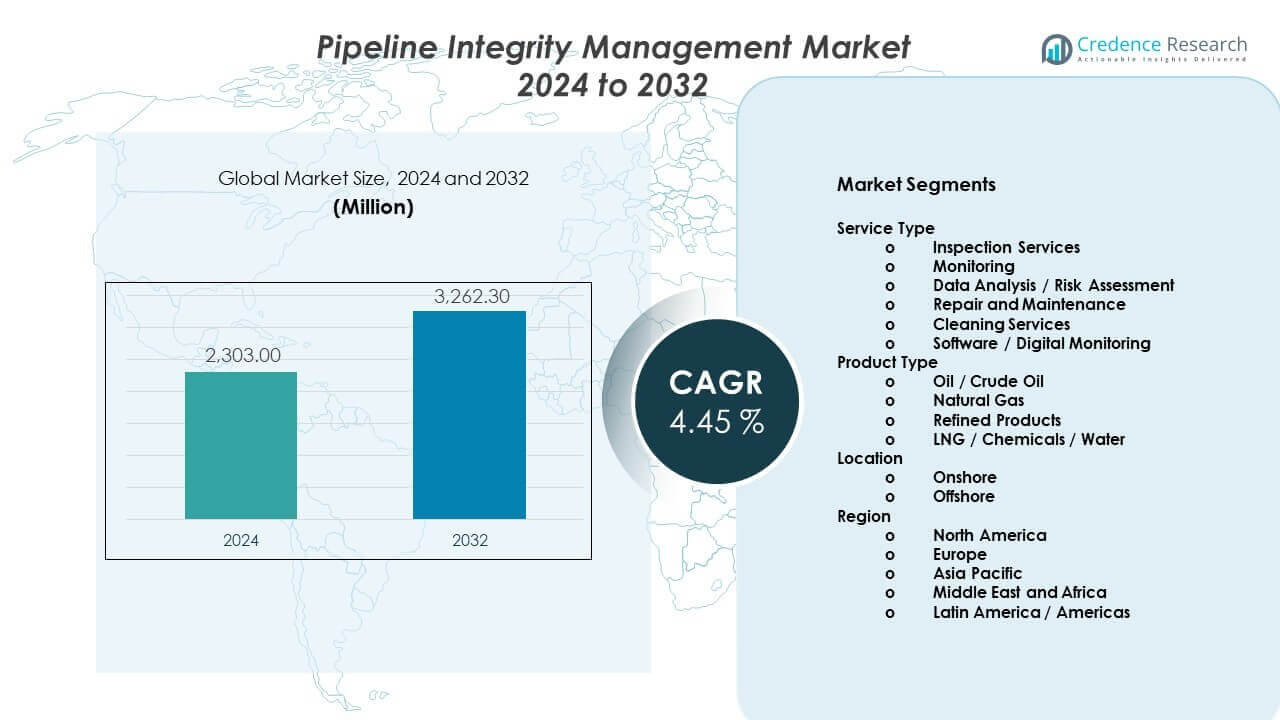
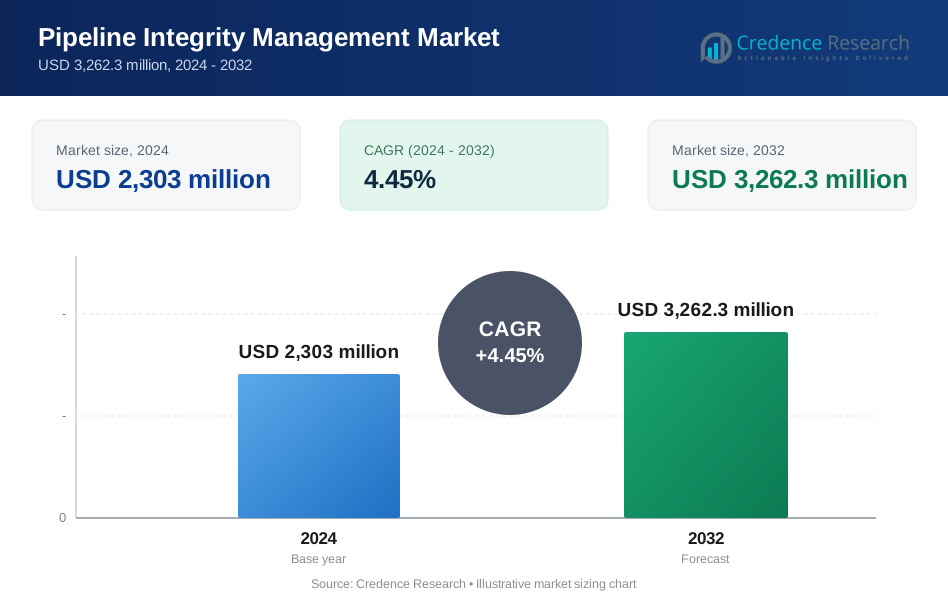
The Pipeline integrity management market is projected to grow from USD 2,303 million in 2024 to USD 3,262.3 million by 2032, registering a CAGR of 4.45% during the forecast period.
| REPORT ATTRIBUTE | DETAILS |
|---|---|
| Historical Period | 2020-2023 |
| Base Year | 2024 |
| Forecast Period | 2025-2032 |
| Pipeline Integrity Management Market Size 2024 | USD 2,303 million |
| Pipeline Integrity Management Market, CAGR | 4.45% |
| Pipeline Integrity Management Market Size 2032 | USD 3,262.3 million |
The Pipeline integrity management market expands due to aging pipelines and rising failure risks. Corrosion, mechanical stress, and third-party damage raise safety concerns. Governments enforce strict environmental and safety regulations across energy infrastructure. Operators adopt proactive integrity programs to avoid leaks and shutdowns. Inline inspection, sensors, and analytics improve defect detection and response time. Higher oil, gas, and water demand increases pipeline utilization pressure. This environment supports continuous monitoring adoption. Cost savings from risk prevention strengthen long-term investment decisions.
North America leads the Pipeline integrity management market due to extensive pipeline networks. Strong regulatory oversight drives advanced inspection and monitoring adoption. The United States shows high use of smart diagnostics and analytics tools. Europe follows with focus on safety, sustainability, and compliance. Countries such as Germany and the United Kingdom invest in digital integrity systems. Asia Pacific emerges as a high-growth region with new pipeline construction. China and India expand energy and water transport infrastructure. The Middle East sustains demand from oil and gas transmission needs.
Market Insights:
- The market overview shows growth from USD 2,303 million in 2024 to USD 3,262.3 million by 2032, expanding at a CAGR of 4.45%, supported by safety mandates and aging pipeline assets.
- North America (38%), Europe (27%), and Asia Pacific (22%) dominate due to large pipeline networks, strict regulations, and steady infrastructure investment.
- Asia Pacific, holding 22% share, is the fastest-growing region, driven by new oil, gas, and water pipeline projects in China and India.
- By service type, inspection services account for about 34% share, while monitoring and data analysis services together hold nearly 28%, reflecting preventive maintenance focus.
- By location and product mix, onshore pipelines represent around 72% share, while oil and crude oil pipelines contribute nearly 40%, driven by volume and safety risk exposure.
Market Drivers:
Rising Aging Pipeline Infrastructure Across Energy Networks
The Pipeline integrity management market gains momentum from aging pipeline assets across global energy networks. Many oil and gas pipelines operate beyond original design life. Material fatigue increases leak and rupture risks. Operators carry higher responsibility for safe operations. Integrity programs support early fault identification. Preventive inspection lowers unplanned outage risk. Asset owners focus on asset life extension. This factor sustains consistent demand.
- For instance, TC Energy reported over 90,000 km of pipelines under integrity programs using inline inspection tools to track corrosion growth trends and reduce incident frequency.
Increasing Regulatory Oversight And Compliance Requirements
The Pipeline integrity management market responds to strict regulatory oversight worldwide. Governments enforce defined inspection cycles and reporting duties. Environmental laws demand strong leak prevention controls. Non-compliance leads to penalties and operational shutdowns. Integrity frameworks support audit readiness. Documentation requirements push structured monitoring adoption. Digital compliance tools improve reporting accuracy. Regulation pressure strengthens integrity investments.
- For instance, Enbridge operates more than 28,000 km of liquids pipelines in North America under regulator-mandated integrity and inline inspection schedules.
Growing Demand For Risk Mitigation And Failure Prevention
The Pipeline integrity management market benefits from rising focus on risk control. Pipeline failures create financial and reputational damage. Operators prioritize early defect detection. Integrity tools identify corrosion and stress zones. Risk scoring improves maintenance planning. Predictive analysis guides inspection focus. Strong safety records lower insurance exposure. This driver supports stable investment.
Expansion Of Energy And Water Transmission Networks
The Pipeline integrity management market grows with expanding transmission networks. Energy demand drives new oil and gas pipelines. Water infrastructure expands in urban regions. New assets require lifecycle integrity planning. Operators deploy monitoring tools early. High utilization increases inspection needs. Cross-border pipelines require uniform safety controls. Expansion supports sustained growth.
Market Trends:
Shift Toward Data-Driven Integrity Decision Frameworks
The Pipeline integrity management market shows rising data-based decision use. Operators rely on analytics for inspection planning. Historical data improves defect growth forecasts. Dashboards enable faster risk review. Teams align actions with risk scores. Data models reduce judgment gaps. Digital twins support performance simulation. This trend improves cost control.
- For instance, ROSEN Group applies high-resolution inline inspection data exceeding 1 terabyte per run to model corrosion growth and prioritize maintenance actions.
Growing Adoption Of Remote Monitoring Technologies
The Pipeline integrity management market adopts remote monitoring solutions. Operators deploy sensors along long-distance pipelines. Real-time alerts improve response speed. Remote access reduces manual inspections. Continuous visibility supports condition awareness. Fiber and satellite sensing gain acceptance. Remote tools improve coverage in isolated areas. Efficiency gains support adoption.
- For instance, Shell uses fiber-optic sensing across offshore pipelines to detect temperature and acoustic changes over distances exceeding 50 km, enabling early leak identification.
Integration Of Integrity Management With Enterprise Systems
The Pipeline integrity management market aligns tools with enterprise platforms. Operators link integrity data with asset systems. Unified platforms improve team coordination. Maintenance and safety share common data views. Workflow automation reduces reporting delays. Integration improves resource planning. Digital ecosystems support scalability. This trend raises operational efficiency.
Rising Use Of Risk-Based Inspection Methodologies
The Pipeline integrity management market adopts risk-based inspection models. Inspection schedules shift from fixed intervals. High-risk sections receive priority focus. Low-risk assets follow optimized cycles. Risk models balance safety and cost goals. Operators allocate resources efficiently. Regulators accept structured frameworks. This trend improves flexibility.
Market Challenges Analysis:
High Implementation Costs And Budget Constraints For Operators
The Pipeline integrity management market faces cost pressure. Advanced inspection tools require high upfront spend. Small operators face capital limits. Skilled labor raises operating expenses. System integration increases project complexity. Payback periods extend over time. Budget limits delay upgrades. Cost sensitivity slows adoption.
Complexity Of Managing Large And Diverse Pipeline Networks
The Pipeline integrity management market handles operational complexity. Pipelines differ by age and material. Data standardization remains difficult. Legacy systems limit digital integration. Wide geography complicates inspection planning. Large data volumes challenge analysis. Skilled analysts remain scarce. These issues increase management burden.
Market Opportunities:
Rising Demand For Digital And Automated Integrity Solutions
The Pipeline integrity management market sees opportunity in automation. Operators seek automated inspection platforms. Software reduces manual workload. Automation improves speed and consistency. Cloud systems enable scalable access. Digital tools support predictive maintenance. Vendors expand integrated offerings. This shift drives future growth.
Emerging Markets Expanding Pipeline Infrastructure Investments
The Pipeline integrity management market benefits from emerging regions. Asia and Africa invest in pipeline infrastructure. Urban growth raises transport demand. New projects adopt early integrity planning. Governments promote safer infrastructure. Global operators bring best practices. Service providers enter new markets. These regions offer long-term opportunity.
Market Segmentation Analysis:
Service Type Analysis
The Pipeline integrity management market shows strong demand across multiple service categories. Inspection services form the foundation, supporting defect detection and condition assessment. Monitoring services enable continuous oversight of pressure, corrosion, and flow behavior. Data analysis and risk assessment support informed maintenance planning and prioritization. Repair and maintenance services address identified faults and restore system reliability. Cleaning services help remove debris and deposits that affect flow efficiency. Software and digital monitoring solutions improve data visibility and decision speed. These services together support proactive asset management.
- For instance, T.D. Williamson conducts pigging and repair services across more than 500 pipeline systems annually worldwide.
Product Type Analysis
The Pipeline integrity management market serves diverse product transport needs. Oil and crude oil pipelines dominate due to high volumes and safety risks. Natural gas pipelines require strict integrity controls due to pressure sensitivity. Refined product pipelines demand quality assurance and contamination prevention. LNG pipelines require advanced monitoring due to cryogenic conditions. Chemical and water pipelines adopt integrity programs to meet safety and purity standards. Each product type drives specific inspection and monitoring needs. Service customization supports operational reliability.
- For instance, NDT Global deploys ultrasonic inspection tools capable of detecting defects in gas pipelines operating above 100 bar pressure.
Location Analysis
The Pipeline integrity management market differs by operating environment. Onshore pipelines account for the largest share due to extensive network coverage. These assets face corrosion, third-party damage, and land-use exposure. Offshore pipelines require specialized inspection due to deepwater conditions. Marine environments increase corrosion and access challenges. Offshore operations demand advanced tools and skilled crews. Higher risk profiles raise inspection frequency needs. Location-specific strategies improve safety and asset life.
Segmentation:
By Service Type
- Inspection Services
- Monitoring
- Data Analysis / Risk Assessment
- Repair and Maintenance
- Cleaning Services
- Software / Digital Monitoring
By Product Type
- Oil / Crude Oil
- Natural Gas
- Refined Products
- LNG / Chemicals / Water
By Location
- Onshore
- Offshore
By Region
- North America
- U.S.
- Canada
- Mexico
- Europe
- Germany
- France
- U.K.
- Italy
- Spain
- Rest of Europe
- Asia Pacific
- China
- Japan
- India
- South Korea
- South-east Asia
- Rest of Asia Pacific
- Latin America
- Brazil
- Argentina
- Rest of Latin America
- Middle East & Africa
- GCC Countries
- South Africa
- Rest of the Middle East and Africa
Regional Analysis:
North America
North America commands the largest share of the Pipeline integrity management market, accounting for 38% of global demand. The United States leads due to extensive oil, gas, and refined product pipeline networks. Strict safety and environmental regulations drive consistent inspection and monitoring activity. Operators invest heavily in digital diagnostics and predictive tools. Canada supports demand through cross-border transmission systems. Mature infrastructure increases integrity spending needs. This region maintains leadership through technology adoption and regulatory enforcement.
Europe
Europe holds approximately 27% share of the Pipeline integrity management market. Countries such as Germany, the United Kingdom, and France anchor regional demand. Aging pipeline assets require structured inspection and risk assessment programs. Environmental protection policies raise compliance requirements. Operators adopt digital platforms to manage cross-country networks. Offshore activity in the North Sea supports specialized services. Regulatory alignment sustains stable market contribution.
Asia Pacific, Middle East, And Latin America
Asia Pacific accounts for nearly 22% share and shows strong growth momentum. China and India expand oil, gas, and water pipelines rapidly. New infrastructure projects integrate integrity planning from early stages. The Middle East represents about 8% share due to oil and gas transmission needs. Offshore pipelines increase demand for advanced inspection tools. Latin America holds around 5% share with modernization of existing assets. These regions support long-term market expansion.
Key Player Analysis:
- Baker Hughes
- Emerson Electric
- SGS
- D. Williamson
- Rosen
- Schneider Electric
- NDT Global
- Applus+
- IKM Gruppen
- Lin Scan
Competitive Analysis:
The Pipeline integrity management market shows a moderately consolidated competitive structure. Global service providers compete on technology depth, service coverage, and digital capability. Leading players focus on inspection accuracy, data analytics, and lifecycle support. Companies expand portfolios through software integration and advanced monitoring tools. Strategic partnerships strengthen access to long-distance and offshore projects. Service differentiation depends on reliability, response speed, and regulatory expertise. Regional players compete through cost efficiency and local compliance knowledge. The Pipeline integrity management market favors firms with strong field experience and scalable digital platforms. It rewards vendors that combine inspection, analysis, and maintenance within unified service models. Competitive intensity remains steady due to long-term contracts and high switching costs.
Recent Developments:
- In March 2025, Baker Hughes announced a strategic technology agreement with Petrobras to develop a definitive solution for stress corrosion cracking caused by CO2 (SCC-CO2) in flexible pipe systems. This partnership focuses on the development and testing of next-generation flexible pipes designed to offer an extended service life of up to 30 years in high-CO2 environments. The pre-commercial agreement also includes a purchase option for the resulting technology, which aims to improve the safety and efficiency of deep-water energy production while supporting carbon capture and storage initiatives.
- In March 2025, Emerson Electric completed its acquisition of the remaining outstanding shares of AspenTech, solidifying its full ownership of the industrial software leader. This strategic move enhances Emerson’s portfolio with advanced pipeline management and asset optimization software, enabling end-to-end automation solutions from sensors to the cloud. The integration allows Emerson to offer more comprehensive digital twin and predictive maintenance technologies to pipeline operators, driving greater operational efficiency and sustainability across the energy sector.
- In June 2024, SGS showcased its latest advancements in asset integrity management at the AIMCS Middle East conference, including the introduction of a new Magnetic Flux Leakage (MFL) Pipe Scanner. This cutting-edge tool is designed to detect corrosion and pitting in pipelines with high precision, representing a significant step forward in ensuring the longevity and safety of critical infrastructure. Additionally, the company highlighted its expanded capabilities in risk-based inspection and non-intrusive inspection methods, reinforcing its position as a leader in technical verification and integrity services.
Report Coverage:
The research report offers an in-depth analysis based on Service Type, Product Type, and Location segments. It details leading market players, providing an overview of their business, product offerings, investments, revenue streams, and key applications. Additionally, the report includes insights into the competitive environment, SWOT analysis, current market trends, as well as the primary drivers and constraints. Furthermore, it discusses various factors that have driven market expansion in recent years. The report also explores market dynamics, regulatory scenarios, and technological advancements that are shaping the industry. It assesses the impact of external factors and global economic changes on market growth. Lastly, it provides strategic recommendations for new entrants and established companies to navigate the complexities of the market.
Future Outlook:
- Digital integrity platforms will see wider adoption across pipeline operators worldwide.
- Predictive analytics will guide inspection scheduling and maintenance planning decisions.
- Remote monitoring solutions will expand across long-distance and high-risk pipelines.
- Offshore pipeline integrity services will record steady growth due to complex operating conditions.
- Regulatory compliance requirements will strengthen demand for structured integrity programs.
- Integration with enterprise asset management systems will increase across operators.
- Emerging markets will adopt integrity planning early in new pipeline projects.
- Demand for skilled technical professionals will rise with advanced diagnostic tools.
- Lifecycle-based service contracts will gain preference among pipeline owners.
- Technology-driven differentiation will continue to shape competitive strategies.
Request a Free Sample
Fill in your details and we'll send you a free sample report.
- Sample data tables & charts
- Research methodology
Need a Custom Version of This Report?
Tailor the scope, geography, or segments to your exact requirements.
- Custom geography or segment scope
- Direct access to our analyst team
Frequently Asked Questions
What is the current market size for Pipeline integrity management market, and what is its projected size in 2032?
At what Compound Annual Growth Rate is the Pipeline integrity management market projected to grow between 2025 and 2032?
Which Pipeline integrity management market segment held the largest share in 2024?
What are the primary factors fueling the growth of the Pipeline integrity management market?
Who are the leading companies in the Pipeline integrity management market?
Which region commanded the largest share of the Pipeline integrity management market in 2024?
Table of Content
Chapter 1. Report Introduction
- 1.1 Report Description & Purpose
- 1.1.1 Report Title & Market Definition
- 1.1.2 Unique Selling Propositions (USP) & Key Differentiators
- 1.1.3 Value Proposition for Stakeholders
- 1.2 Research Objectives
- 1.2.1 Market Sizing Objectives (Volume & Revenue)
- 1.2.2 Segmentation Objectives
- 1.2.3 Competitive Intelligence Objectives
- 1.2.4 Forecast & Scenario Objectives
- 1.3 Report Scope
- 1.3.1 Pipeline Integrity Management Scope – Types & Subtypes Covered
- 1.3.2 Geographic Scope – Regions & Countries Covered
- 1.3.3 Historical Period, Base Year & Forecast Period (2024; forecast to 2032)
- 1.3.4 Inclusions & Exclusions
- 1.4 HS Code & Classification Framework
- 1.5 Currency, Units & Pricing Basis
- 1.6 Target Stakeholders
- 1.7 Limitations & Assumptions
Chapter 2. Executive Summary
- 2.1 Global Pipeline Integrity Management Market Snapshot
- 2.1.1 Market Size – Historical (2024) & Forecast (2024-2032) (2024: USD 2,303 million → 2032: USD 3,262.3 million)
- 2.1.2 Volume & Revenue – Global Totals
- 2.1.3 Key Market Highlights – Top Five Facts
- 2.2 Pipeline Integrity Management Market Segmentation Snapshot
- 2.2.1 Market Split by Region – 2024 vs. 2032
- 2.3 Competitive Snapshot
- 2.3.1 Top 10 Players by Revenue Share – 2024
- 2.3.2 Top 10 Players by Volume Share – 2024
- 2.3.3 Recent Strategic Developments (18-Month Summary)
- 2.4 Key Investment Highlights & Strategic Conclusions
Chapter 3. Pipeline Integrity Management Market Dynamics & Industry Analysis
- 3.1 Market Overview & Context
- 3.1.1 Pipeline Integrity Management Market Position in the Broader Automotive Value Chain
- 3.1.2 OEM vs. Replacement Market Dynamics
- 3.1.3 Market Maturity & Development Stage by Region
- 3.2 Pipeline Integrity Management Market Drivers
- 3.3 Pipeline Integrity Management Market Restraints & Challenges
- 3.4 Pipeline Integrity Management Market Opportunities
- 3.5 Porter's Five Forces Analysis
- 3.5.1 Threat of New Entrants
- 3.5.2 Bargaining Power of Suppliers
- 3.5.3 Bargaining Power of Buyers
- 3.5.4 Threat of Substitutes
- 3.5.5 Competitive Rivalry – Intensity Assessment
- 3.6 Pipeline Integrity Management Value Chain Analysis
- 3.6.1 Upstream – Raw Material/Input Suppliers
- 3.6.1.1 Raw Material/Input 1
- 3.6.1.2 Raw Material/Input 2
- 3.6.1.3 Raw Material/Input 3
- 3.6.2 Midstream – Production/Manufacturing/Service Delivery
- 3.6.2.1 Production/Process Overview
- 3.6.2.2 Key Facility Locations & Capacity by Manufacturer
- 3.6.3 Downstream – Distribution & End Consumer
- 3.6.3.1 Primary Channel – B2B/OEM
- 3.6.3.2 Secondary Channels – Dealer, Retail, Online, Direct
- 3.6.4 Value Chain Profitability Analysis
- 3.6.1 Upstream – Raw Material/Input Suppliers
- 3.7 PESTEL Analysis
- 3.7.1 Political Factors
- 3.7.2 Economic Factors
- 3.7.3 Social Factors
- 3.7.4 Technological Factors
- 3.7.5 Environmental Factors
- 3.7.6 Legal Factors
- 3.8 Pipeline Integrity Management Supply Chain Analysis
- 3.8.1 Raw Material/Input Supply Risk Assessment
- 3.8.2 Manufacturing Concentration Risk (Geographic Exposure)
- 3.8.3 Trade Disruption Impact Analysis
- 3.9 Regulatory & Policy Landscape
Note: The regulatory and policy landscape section covers regulations based on their applicability to the market, Pipeline Integrity Management category, geography, and scope of the study. Only regulatory frameworks with a material impact on operations, compliance, trade, sustainability, or market access are analyzed in detail.
Chapter 4. Key Investment Pockets & Opportunity Analysis
- 4.1 Pipeline Integrity Management Market Attractiveness Analysis
- 4.1.1 By Region – Investment Attractiveness Matrix (Volume × CAGR)
- 4.2 Absolute Revenue Growth Opportunity
- 4.2.1 By Region – Absolute USD Growth Through 2032
- 4.3 Incremental Volume Opportunity
- 4.3.1 By Region – Incremental Volume Through 2032
- 4.3.2 Segment – Incremental Volume
- 4.4 Emerging Submarket Opportunity Deep Dive (Subject to Applicability)
- 4.5 Emerging Market Opportunity Scorecards
- 4.5.1 United States
- 4.5.2 Europe
- 4.5.3 Asia
- 4.5.4 Middle East & Africa
Note: Emerging Market Opportunity Scorecards will be included based on relevance and strategic importance. Regions listed are indicative and may vary depending on data availability and market dynamics.
Chapter 5. Pipeline Integrity Management Import-Export Analysis & Trade Flows
- 5.1 Global Trade Overview
- 5.1.1 Global Export Value by Country (2024)
- 5.1.2 Global Export Volume by Country (2024)
- 5.1.3 Global Import Value by Country (2024)
- 5.1.4 Global Import Volume by Country (2024)
- 5.1.5 Net Trade Balance by Country (2024)
- 5.2 Export Analysis – Segment
- 5.2.1 Type 1 (HS Code)
- 5.2.2 Type 2 (HS Code)
- 5.2.3 Type 3 (HS Code)
- 5.2.4 Type 4 (HS Code)
- 5.2.5 Type 5 (HS Code)
- 5.3 Import Analysis – Segment
- 5.3.1 Type 1 (HS Code)
- 5.3.2 Type 2 (HS Code)
- 5.3.3 Type 3 (HS Code)
- 5.3.4 Type 4 (HS Code)
- 5.3.5 Type 5 (HS Code)
- 5.4 Average Unit Trade Prices
- 5.4.1 Average Export Price – Segment & Country
- 5.4.2 Average Import Price – Segment & Source Country
- 5.4.3 Price Trends (2024)
- 5.5 Key Trade Route Analysis
- 5.5.1 Trade Route 1
- 5.5.2 Trade Route 2
- 5.5.3 Trade Route 3
- 5.5.4 Trade Route 4
- 5.5.5 Trade Route 5
- 5.6 Trade Policy Impact Assessment
- 5.6.1 US Anti-Dumping & Section 301 Tariffs
- 5.6.2 EU Customs Union Impact
- 5.6.3 Major Free Trade Agreements
- 5.6.4 USMCA Rules of Origin
Note: Trade policy analysis will be included only where relevant to the Pipeline Integrity Management market.
Chapter 6. Competitive Landscape & Company Benchmarking
- 6.1 Pipeline Integrity Management Market Concentration & Structure
- 6.1.1 Herfindahl-Hirschman Index (HHI) – vs. 2024
- 6.1.2 Tier 1, Tier 2 & Tier 3 Market Structure
- 6.1.3 Global, Regional & Local Player Dynamics
- 6.2 Pipeline Integrity Management Market Share Analysis – 2024
- 6.2.1 Global Revenue Share by Company
- 6.2.2 Global Volume Share by Company
- 6.2.3 Regional Revenue Share
- 6.2.4 Market Share Evolution ( vs. 2024)
- 6.2.5 OEM Segment Share by Company
- 6.2.6 Replacement Segment Share by Company
- 6.3 Production/Delivery Capacity & Facility Analysis
- 6.3.1 Global Installed Capacity
- 6.3.2 Capacity Utilization Rates
- 6.3.3 Production/Output Volume
- 6.3.4 Facility Locations & Capacity Map
- 6.3.5 Planned Capacity Additions
- 6.4 Pipeline Integrity Management Competitive Benchmarking Matrix
- 6.4.1 Revenue, Volume, CAGR & Profitability Comparison
- 6.4.2 Channel Revenue Mix
- 6.4.3 Geographic Revenue Exposure
- 6.4.4 R&D Intensity
- 6.4.5 Sustainability Maturity
- 6.5 Strategic Developments in Pipeline Integrity Management (Last 24 Months)
- 6.5.1 Mergers, Acquisitions & Divestments
- 6.5.2 New Pipeline Integrity Management Launches
- 6.5.3 Facility Expansions
- 6.5.4 Strategic Alliances, Joint Ventures & Partnerships
- 6.5.5 Distribution Expansion & Market Entry
- 6.5.6 Sustainability & ESG Initiatives
- 6.6 Competitive Strategy Mapping
- 6.6.1 Leader, Challenger, Follower & Niche Classification
- 6.6.2 Pricing Strategy Comparison
- 6.6.3 Channel Strategy Matrix
Note: Strategic developments are included based on their materiality and the availability of reliable information.
Chapter 7. Global Pipeline Integrity Management Market – By Distribution Channel
- 7.1 Segment Overview
- 7.1.1 Volume & Revenue Split by Channel (2024 & 2032)
- 7.1.2 Channel Mix Evolution (2024-2032)
Chapter 8. Regional Market Analysis – Global Overview
- 8.1 Global Regional Overview
- 8.1.1 Regional Volume Share
- 8.1.2 Regional Revenue Share
- 8.1.3 Regional Volume by Region
- 8.1.4 Regional Revenue by Region
- 8.1.5 Regional Forecast Through 2032
- 8.2 Cross-Regional Segment Analysis
- 8.2.1 By Distribution Channel
- 8.2.2 By Brand/Price Tier
Chapter 9. North America Pipeline Integrity Management Market
- 9.1 United States
- 9.2 Canada
- 9.3 Mexico
Chapter 10. Europe Pipeline Integrity Management Market
- 10.1 Germany
- 10.2 France
- 10.3 Italy
- 10.4 United Kingdom
- 10.5 Spain
- 10.6 Poland
- 10.7 Russia
- 10.8 Netherlands
- 10.9 Belgium
- 10.10 Sweden
- 10.11 Denmark
- 10.12 Norway
- 10.13 Rest of Europe
Chapter 11. Asia Pacific Pipeline Integrity Management Market
- 11.1 China
- 11.2 India
- 11.3 Japan
- 11.4 South Korea
- 11.5 Thailand
- 11.6 Indonesia
- 11.7 Vietnam
- 11.8 Malaysia
- 11.9 Australia
- 11.10 Rest of Asia Pacific
Chapter 12. Latin America Pipeline Integrity Management Market
- 12.1 Brazil
- 12.2 Argentina
- 12.3 Colombia
- 12.4 Chile
- 12.5 Rest of Latin America
Chapter 13. Middle East Pipeline Integrity Management Market
- 13.1 Saudi Arabia
- 13.2 United Arab Emirates
- 13.3 Turkey
- 13.4 Israel
- 13.5 Iran
- 13.6 Rest of the Middle East
Chapter 14. Africa Pipeline Integrity Management Market
- 14.1 South Africa
- 14.2 Egypt
- 14.3 Nigeria
- 14.4 Morocco
- 14.5 Rest of Africa
Chapter 15. Pipeline Integrity Management Company Profiles
- 15.1 [Company 01]
- 15.1.1 Company Overview
- 15.1.2 Key Management Personnel
- 15.1.3 Products & Services Portfolio
- 15.1.4 Financial Performance
- 15.1.5 Key Market Focus & Geographic Presence
- 15.1.6 Recent Developments & Strategic Initiatives
Note: The company profile list is preliminary and may change based on research findings, market developments, data availability, and client requirements.
Chapter 16. Appendices
- Appendix A – List of Abbreviations & Acronyms
- Appendix B – Industry Classification Code Reference – Full Series
- Appendix C – Production & Capacity Data Tables
- Appendix D – End-Use & Demand Base Tables
- Appendix E – Consumption & Replacement Rate Assumptions
- Appendix F – ASP Reference Tables
- Appendix G – Manufacturing & Facility Database
- Appendix H – Import-Export Data Tables
- Appendix I – Regulatory Summary Tables
- Appendix J – Primary Research Participant List (Anonymized)
- Appendix K – Primary Research Questionnaire Framework
- Appendix L – Data Sources & Bibliography
- Appendix M – Market Size Divergence & Source Comparison
Chapter 17. Research Methodology
- 17.1 Research Framework & Philosophy
- 17.2 Secondary Research – Sources, Hierarchy & Data Extraction
- 17.3 Data Modeling – Bottom-Up & Top-Down Market Sizing
- 17.4 Primary Research – Stakeholder Framework, LOI & Sample Sizes
- 17.5 Forecast Methodology – Regression, Scenario & Sensitivity Analysis
- 17.6 Quality Control – Four-Layer Validation Framework
- 17.7 Limitations & Standard Assumptions
- 17.8 Disclaimer
