Market Overview:
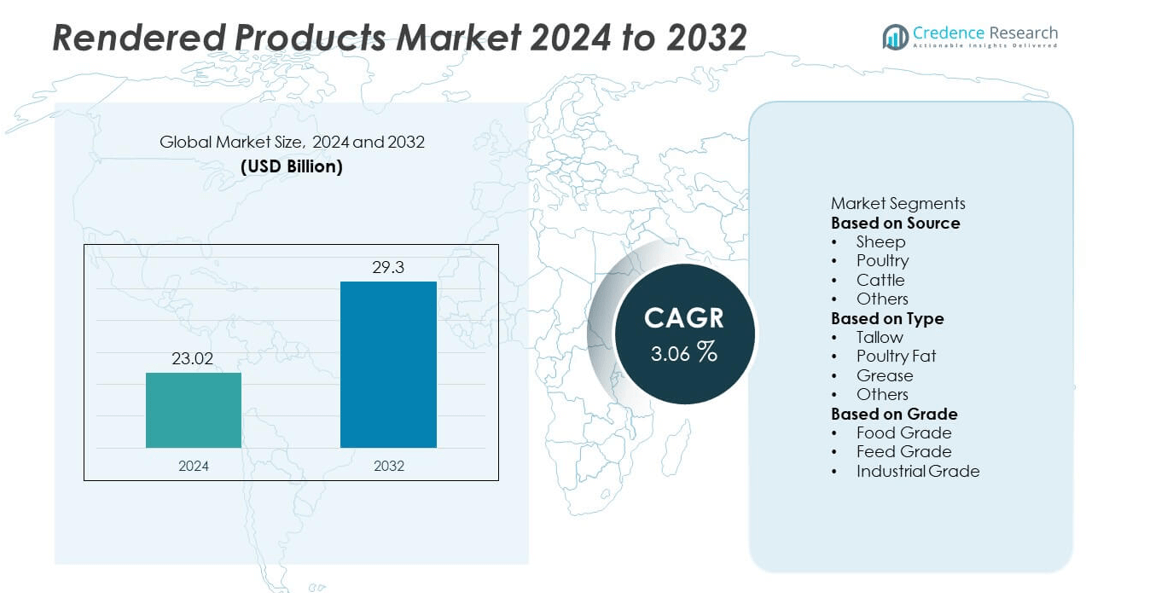
The Rendered Products Market was valued at USD 23.02 billion in 2024 and is projected to reach USD 29.3 billion by 2032, growing at a CAGR of 3.06% during the forecast period.
| REPORT ATTRIBUTE |
DETAILS |
| Historical Period |
2020-2023 |
| Base Year |
2024 |
| Forecast Period |
2025-2032 |
| Rendered Products Market Size 2024 |
USD 23.02 billion |
| Rendered Products Market, CAGR |
3.06% |
| Rendered Products Market Size 2032 |
USD 29.3 billion |
The rendered products market is led by major players such as Tyson Foods, Inc., Darling Ingredients Inc., JBS S.A., West Coast Reduction Ltd., Sanimax Industries Inc., Griffin Industries LLC, Smithfield Foods, Inc., Baker Commodities Inc., Australian Tallow Producers, and TenKate Protein Technologies. These companies dominate through advanced rendering technologies, strong supply chains, and diversified product portfolios serving feed, fuel, and oleochemical sectors. North America emerged as the leading region with a 38.2% market share in 2024, driven by large-scale meat processing facilities, high biofuel consumption, and robust rendering infrastructure. Europe followed closely, emphasizing sustainability and renewable energy applications for rendered fats and proteins.
Market Insights
- The rendered products market was valued at USD 23.02 billion in 2024 and is projected to reach USD 29.3 billion by 2032, growing at a CAGR of 3.06% during the forecast period.
- Growth is driven by rising global meat production, expanding biofuel demand, and increasing use of animal by-products in feed and oleochemical industries.
- The market trend is shifting toward sustainable and circular economy practices, with companies adopting energy-efficient rendering and waste-to-value technologies.
- Leading players such as Tyson Foods, Darling Ingredients, and JBS S.A. focus on innovation, renewable energy production, and strategic acquisitions to strengthen market positions.
- North America led with a 38.2% share in 2024, followed by Europe with 29.7%, while Asia-Pacific held 25.1% and remained the fastest-growing region; the cattle segment dominated by source with a 48.6% share, supported by strong tallow and protein meal production for feed and fuel applications.
Market Segmentation Analysis:
By Source
The cattle segment dominated the rendered products market with a 48.6% share in 2024, driven by large-scale beef production and the high availability of bovine by-products such as tallow, bone meal, and protein residues. These materials are widely used in animal feed, oleochemicals, and biodiesel manufacturing. The poultry segment is also growing steadily due to increased poultry meat consumption and efficient fat recovery processes. Rising awareness of sustainable animal waste utilization and advancements in rendering technology are further promoting growth across sheep and other animal sources.
- For instance, Tyson Foods, Inc. operates multiple rendering facilities in the U.S., which process animal by-products into valuable proteins and fats for animal feed, pet food, and biodiesel. The company has invested significantly in its rendering capabilities to support sustainability goals by recycling materials that would otherwise go to landfills.
By Type
The tallow segment held the largest share of 41.3% in 2024, attributed to its broad use in biofuel production, animal feed, and oleochemical industries. Tallow’s versatility and stability make it a preferred raw material for soap, lubricants, and biodiesel manufacturing. Poultry fat is gaining traction in feed formulations for swine and aquaculture, supported by high energy content and easy digestibility. Increasing demand for sustainable grease and protein meals in pet food and fertilizer applications is enhancing market diversity.
- For instance, Darling Ingredients Inc. refines more than 4.3 million metric tons of animal fats annually, including tallow, at its global network of rendering plants. Its Norco facility in Louisiana converts over 400,000 metric tons of tallow per year into renewable diesel feedstock, helping supply low-carbon fuel producers across North America.
By Grade
The feed grade segment accounted for a 56.7% market share in 2024, supported by growing use of rendered proteins and fats in livestock and pet feed. Feed-grade materials provide essential nutrients and help reduce feed costs for animal producers. Food-grade rendered products are expanding in edible fat applications, while industrial-grade materials find increasing use in biodiesel and oleochemical production. The strong focus on waste reduction and circular economy initiatives is encouraging rendering facilities to produce high-quality, multi-purpose ingredients across all grade categories.
Key Growth Drivers
Expanding Meat Processing Industry
Rising global meat consumption is increasing the volume of animal by-products available for rendering. Large-scale meat processing operations, particularly in North America, Europe, and Asia-Pacific, drive continuous supply for tallow, poultry fat, and protein meal production. Rendering helps processors reduce waste while creating valuable secondary products used in animal feed, biofuels, and fertilizers. The growing preference for sustainable waste management practices and improved processing efficiency is further enhancing the role of rendering in the global animal production value chain.
- For instance, Smithfield Foods, Inc. processes millions of hogs annually across its U.S. facilities. Its Tar Heel, North Carolina, plant is one of the largest pork processing facilities in the world and has the capacity to process tens of thousands of hogs per day.
Rising Demand for Biofuels and Oleochemicals
The growing use of animal fats in biodiesel and oleochemical manufacturing is a major driver for the rendered products market. Governments promoting renewable fuel mandates and low-carbon initiatives are supporting this demand. Rendered tallow and grease are key feedstocks for biodiesel production due to their high energy yield and cost-effectiveness. Expanding industrial applications, including lubricants, soaps, and surfactants, are also fueling demand for sustainable fat-based inputs derived from rendering processes.
- For instance, Australian renderers supply a significant amount of rendered tallow to the biofuel sector, with exports of over 500,000 metric tons recorded in 2024. A portion of this tallow is exported to countries like the US and Singapore for conversion into biodiesel and sustainable aviation fuel.
Growing Pet Food and Animal Feed Sector
The global pet food and livestock feed industries are increasingly adopting rendered protein meals and fats for their nutritional value and affordability. These ingredients provide essential amino acids and energy for poultry, swine, and companion animals. Expanding pet ownership and rising expenditure on premium, protein-rich pet food are key growth contributors. Feed manufacturers are also turning to sustainable rendering-derived materials as eco-friendly alternatives to synthetic additives, supporting both environmental and nutritional goals.
Key Trends & Opportunities
Shift Toward Sustainable and Circular Economy Practices
Sustainability has become a central focus for rendering operations. Companies are adopting advanced technologies to convert animal by-products into renewable energy, fertilizers, and feed components with minimal waste. This aligns with global circular economy goals, where every part of the animal is utilized efficiently. The trend supports reduced environmental impact while generating additional revenue streams from recovered fats and proteins, positioning rendered products as a key contributor to sustainable resource management.
- For instance, Darling Ingredients Inc. operates its Diamond Green Diesel joint venture, which produces approximately 1.2 billion gallons of renewable diesel annually from feedstocks including recycled animal fats, used cooking oil, and inedible corn oil.
Technological Advancements in Rendering Processes
Continuous improvements in rendering technology, such as low-temperature processing and automated separation systems, are enhancing product quality and yield. These innovations reduce energy consumption and preserve nutrient value, especially for feed-grade and food-grade materials. Automation and digital monitoring systems improve operational efficiency and traceability, aligning with strict safety and sustainability standards. This technological progress enables processors to meet growing demand while maintaining consistent quality and compliance across global markets.
- For instance, West Coast Reduction Ltd. integrated an advanced multi-effect evaporator system at its Vancouver facility. West Coast Reduction Ltd. has also implemented measures to reduce electrical energy consumption by over 2,000,000 kWh per year.
Key Challenges
Fluctuating Raw Material Supply
The rendered products market faces challenges from inconsistent supply of raw materials tied to meat production cycles. Seasonal variations and disease outbreaks, such as avian flu or swine fever, disrupt animal processing and reduce by-product availability. This affects production stability and profitability for rendering companies. To counter this, processors are diversifying sourcing strategies and investing in cold storage and logistics networks to ensure steady input flow and maintain operational continuity.
Stringent Regulatory and Environmental Standards
Strict global regulations on animal by-product handling, waste disposal, and product safety create operational challenges for renderers. Compliance with standards such as EU Animal By-Products Regulation and U.S. FDA feed safety guidelines requires significant investment in infrastructure and monitoring. Meeting these standards increases production costs and limits flexibility, especially for smaller players. However, maintaining transparency, quality assurance, and traceability has become critical for ensuring market access and sustaining long-term competitiveness.
Regional Analysis
North America
North America dominated the rendered products market with a 38.2% share in 2024, supported by well-established meat processing industries and strong biofuel demand. The U.S. leads the region with advanced rendering facilities, high pet food production, and government incentives for renewable energy. Continuous innovation in animal fat recycling and waste management enhances production efficiency. The integration of rendering by-products into sustainable agriculture and feed industries further drives market growth, reinforcing North America’s position as a major hub for rendered product exports and circular economy initiatives.
Europe
Europe accounted for a 29.7% market share in 2024, driven by strict environmental regulations and efficient rendering infrastructure. Countries such as Germany, France, and the U.K. maintain strong meat processing capabilities, ensuring a stable supply of raw materials. The region’s focus on renewable energy and biodiesel production fuels demand for rendered fats such as tallow and grease. Growing consumer awareness of sustainability and traceability also supports demand for high-quality feed and food-grade materials, positioning Europe as a global leader in environmentally responsible rendering practices.
Asia-Pacific
Asia-Pacific held a 25.1% share in 2024, emerging as the fastest-growing region due to rapid meat consumption, urbanization, and feed industry expansion. China, India, and Australia dominate production, supported by increasing livestock populations and government-backed initiatives for waste reduction. The region’s growing biofuel sector and adoption of modern rendering technologies are enhancing output efficiency. Expanding pet food and aquaculture industries further strengthen demand for rendered proteins and fats. Rising focus on sustainability and value-added animal by-products is positioning Asia-Pacific as a key growth driver in global rendering.
Latin America
Latin America captured a 4.2% market share in 2024, driven by strong meat processing activities in Brazil and Argentina. The region’s expanding livestock and poultry industries provide abundant raw materials for rendering. Demand for tallow and protein meals is rising in animal feed and biodiesel applications. However, limited technological advancement and infrastructure gaps in smaller economies constrain production efficiency. Increasing foreign investments in modern rendering plants and export-oriented operations are expected to enhance regional competitiveness over the forecast period.
Middle East & Africa
The Middle East & Africa region accounted for a 2.8% market share in 2024, driven by growing meat consumption and industrial expansion in countries such as Saudi Arabia, Egypt, and South Africa. The region’s focus on food security and animal feed production is supporting demand for rendered proteins. However, limited rendering infrastructure and reliance on imports restrict large-scale growth. Ongoing investments in meat processing facilities and adoption of energy-efficient rendering systems are expected to improve regional production capacity and create long-term growth opportunities.
Market Segmentations:
By Source
- Sheep
- Poultry
- Cattle
- Others
By Type
- Tallow
- Poultry Fat
- Grease
- Others
By Grade
- Food Grade
- Feed Grade
- Industrial Grade
By Geography
- North America
- Europe
- Germany
- France
- U.K.
- Italy
- Spain
- Rest of Europe
- Asia Pacific
- China
- Japan
- India
- South Korea
- South-east Asia
- Rest of Asia Pacific
- Latin America
- Brazil
- Argentina
- Rest of Latin America
- Middle East & Africa
- GCC Countries
- South Africa
- Rest of the Middle East and Africa
Competitive Landscape
The rendered products market is highly competitive, featuring leading companies such as Tyson Foods, Inc., Darling Ingredients Inc., JBS S.A., West Coast Reduction Ltd., Sanimax Industries Inc., Griffin Industries LLC, Smithfield Foods, Inc., Baker Commodities Inc., Australian Tallow Producers, and TenKate Protein Technologies. These players focus on sustainable rendering processes, technological innovation, and vertical integration to maximize value from animal by-products. Companies are investing in biofuel production, advanced fat recovery systems, and automation to enhance efficiency and reduce waste. Strategic mergers and partnerships help expand product portfolios and global reach, particularly in feed, oleochemical, and biodiesel sectors. Market leaders emphasize traceability, environmental compliance, and circular economy practices to strengthen brand reputation. The growing demand for renewable energy and animal nutrition products continues to drive innovation, positioning sustainability and operational excellence as key competitive differentiators in the global rendered products market.
Shape Your Report to Specific Countries or Regions & Enjoy 30% Off!
Key Player Analysis
- Tyson Foods, Inc.
- Darling Ingredients Inc.
- JBS S.A.
- West Coast Reduction Ltd.
- Sanimax Industries Inc.
- Griffin Industries LLC
- Smithfield Foods, Inc.
- Baker Commodities Inc.
- Australian Tallow Producers
- TenKate Protein Technologies
Recent Developments
- In May 2025, Darling Ingredients Inc. entered into a term sheet with Tessenderlo Group to form the joint-venture Nextida, combining about 200,000 metric tons of collagen and gelatin capacity across 23 facilities worldwide.
- In February 2025, Darling Ingredients Inc. began producing renewable natural gas (RNG) from wastewater in its Dublin, Georgia rendering facility. The unit upgrades biogas to pipeline quality and injects it into the City of Dublin’s natural-gas grid.
- In November 2024, Darling Ingredients also launched its “DarLinQ™” real-time used cooking oil (UCO) monitoring system. The technology tracks oil-level changes and theft attempts across over 200,000 U.S. restaurant collection sites..
- In October 2024, Sanimax Industries Inc. completed a major expansion project at its Sainte-Rosalie site, including installation of a 106-foot smokestack and high-performance ventilation unit to improve environmental performance in its rendering operations
Report Coverage
The research report offers an in-depth analysis based on Source, Type, Grade and Geography. It details leading market players, providing an overview of their business, product offerings, investments, revenue streams, and key applications. Additionally, the report includes insights into the competitive environment, SWOT analysis, current market trends, as well as the primary drivers and constraints. Furthermore, it discusses various factors that have driven market expansion in recent years. The report also explores market dynamics, regulatory scenarios, and technological advancements that are shaping the industry. It assesses the impact of external factors and global economic changes on market growth. Lastly, it provides strategic recommendations for new entrants and established companies to navigate the complexities of the market.
Future Outlook
- Demand for sustainable and circular rendering processes will continue to rise globally.
- Biofuel production from animal fats will become a major growth avenue for market players.
- Technological advancements will enhance product quality, efficiency, and energy recovery in rendering.
- The pet food and animal feed sectors will increasingly adopt rendered proteins for nutrition and cost efficiency.
- Regulatory focus on waste reduction and environmental safety will strengthen compliance-driven innovations.
- Asia-Pacific will emerge as the fastest-growing market due to expanding meat processing industries.
- Companies will invest more in traceability and automation to ensure process transparency.
- Partnerships and acquisitions will increase to expand global rendering capacity and market reach.
- Demand for high-grade fats and proteins in oleochemicals and cosmetics will gain momentum.
- Sustainability certifications and renewable energy integration will shape future competitive strategies.


