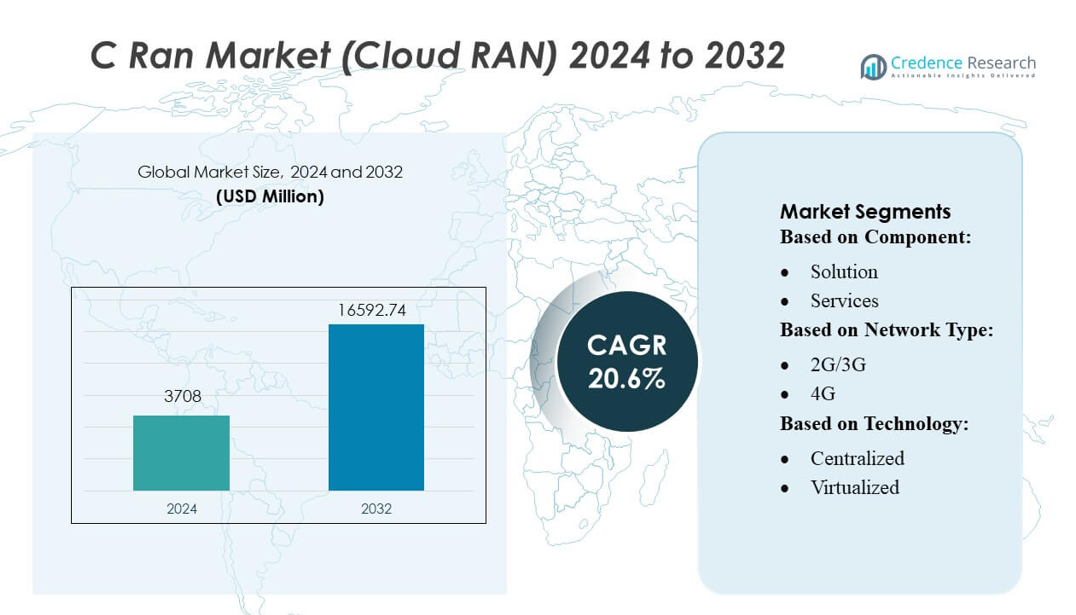
Home » Information and Communications Technology » Networking and Communications » C-RAN (Cloud Radio Access Network) Market

C-RAN (Cloud Radio Access Network) Market By Architecture Type (Centralized-RAN, Virtualized/cloud-RAN) By Component (Infrastructure, Remote radio units, Baseband units, Fronthaul, Software) By Network Type (3G, LTE & 5G) By Deployment Type (Indoor, Outdoor) – Growth, Future Prospects & Competitive Analysis, 2016 – 2028

Price: $4999

Published: | Report ID: 1595 | Report Format : PDF

About this report

The global Cloud Radio Access Network (C-RAN) market report explores the critical analysis of the C-RAN industry using key parameters. The report consists of investment strategies, the need for investments in the C-RAN industry, and the multiple benefits for the investors. Importantly, this report sets out major changes in the global technical regulations for the C-RAN industry and how economic and non-economic barriers are helping the C-RAN market grow. Moreover, the report analyzes the global, regional, and country-level historic and forecasted market size. The report also provides a comprehensive analysis of key investment propositions, demand and supply gap, competitors positioning, STAR analysis, SRC analysis, and Tornado analysis. Key technological developments and other analyses such as porter’s five forces analysis, PESTEL analysis, value chain analysis, etc.

REPORT ATTRIBUTE DETAILS
C-RAN Market by Volume Yes
C-RAN Market by Value Yes
C-RAN Market, Tornado Analysis Yes
C-RAN Market, STAR Analysis Yes
C-RAN Market, SRC Analysis Yes
C-RAN Market, Import-Export Data Yes (On Demand)
C-RAN Market Pricing Analysis Yes (On Demand)
C-RAN Market Segment Analysis By Architecture type (RAN and Virtualized/cloud-RAN)

·         By Components (infrastructure, remote radio units, baseband units, frontal, software, services, consulting, design and deployment, maintenance and support and Others)

By Network Type (3G and LTE 5G)

By Deployment Model (indoor and outdoor)

C-RAN Market, Regional Analysis North America (US and Canada)

Europe (Germany, UK, France, Italy, Spain, and the Rest of Europe)

Asia Pacific (China, India, Japan, South Korea, South East Asia, and the Rest of Asia Pacific)

Latin America (Brazil, Mexico, and the Rest of Latin America)

Middle East and Africa (GCC Countries, South Africa, and the Rest of the Middle East and Africa)

C-RAN Market Key Companies Altiostar; ASOCS Ltd; Cisco Systems, Inc.; Telefonaktiebolaget; LM Ericsson; FUJITSU; Huawei Technologies Co., Ltd; NEC Corporation; Samsung Electronics Co Ltd.; Nokia Corporation; ZTE Corporation
C-RAN Market Competitive Landscape Market Share Analysis

Competitive Benchmarking

Key Players Market Positioning

Geographical Presence Analysis

Major Strategies Adopted

Key Highlights of the report

How are the major segments performing in the C-RAN market?

  • In 2021, the centralized-RAN segment will dominate the C-RAN market’s share due to technological advancements offered for optical, wireless, and IT communications systems, which are expected to grow.
  • In 2021, the infrastructure segment dominated the Global C-RAN market due to the rapid adoption of radio technology and architecture to meet the 5G requirements.
  • In 2021, the LTE& 5G segment accounted for the largest market share due to massive data traffic growth and rigorous power consumption impact by the current network architecture.
  • In 2021, the outdoor-led deployment model segment dominating in the market due to the C-RAN deployment architecture by mobile operators in outdoor environments providing better coverage in areas including urban markets and stadiums.

Which region dominated the C-RAN market?

North America is expected to dominate the highest market share in the global Cloud Radio Access Network market. The key players in the region are introducing services for wireless mobile networks in the regional market. Such collaborations drive market growth in the North American region. Moreover, telecom operators’ high investment in R&D is expected to propel the C-RAN technology in the North American region. Furthermore, this Region has become valuable for the global C-RAN market of inventions and developments such as LTE and 5G networks.

Design Element 2

Access crucial information at unmatched prices!

Request your free sample report today & start making informed decisions powered by Credence Research!

Download Free Sample
CTA Design Element 3

How US Market is Performing in the C-RAN market?

The US market is expected to dominate the highest market share in the North American Cloud Radio Access Network market. The key players in the region are introducing services for wireless mobile networks in the regional market. Such collaborations drive market growth in the US country. Moreover, telecom operators’ high investment in R&D is expected to propel the C-RAN technology in the US area.

What is the competitive environment of the C-RAN market?

The rising demand for wireless infrastructure worldwide to enhance the communication network increases competition among the market players. In addition, market players are also expanding their businesses on the global level to expand their global reach, which supports revenue generation for the company. For instance, in March 2020, Nokia announced the acquisition of Elenion Technologies. Nokia can expand its market footprint by addressing the critical and rapidly evolving optical connectivity requirements of 5G, cloud, and enterprise networking with Elenion’s technology expertise and unique design platform and services.

Executive Summary

What technical developments are being developed in the Global C-RAN Market?

The market players are developing new software and hardware in the global C-RAN market. For instance, in February 2019, ASOCS Ltd., a pioneer in RAN virtualization, announced the launch of a 5G in-building solution. ASOCS’ solution combines 5G and edge cloud capabilities in a single software stack. The solution is intended for the in-building market and enterprise needs. Similarly, in October 2019, NEC corporation announced the launch of a smart cities platform based on FIWARE in India. The platform is built on the open-source platform of the FIWARE Foundation, which supports Next Generation Service Interfaces, a globally accepted open standard interface for data management. As a result, the new platform is ideal for seamless integration with smart city projects that collect and process data from a wide range of smart city applications.

Which are the key investments by the C-RAN market players?

The market players are investing in the urban markets due to high demand for the latest technology, improved communication networks, and others supporting the investments by market players. For instance, Verizon Wireless is moving forward with plans to deploy Cloud-RAN network architecture and continue deploying distributed antenna systems (DAS) and small cells to meet growing capacity demands in urban markets.

Some of the major players in the market are Altiostar; ASOCS Ltd; Cisco Systems, Inc.; Telefonaktiebolaget; LM Ericsson; FUJITSU; Huawei Technologies Co., Ltd; NEC Corporation; Samsung Electronics Co Ltd.; Nokia Corporation; ZTE Corporation.

What are the Major Driving Factors for the C-RAN Market?

The advancements toward fifth-generation wireless technology are major factors driving the market growth. The 5G network has the fastest growth due to the adoption of 5G has led to a large amount of mobile data traffic traversing the network. The increasing adoption of high-speed and large network coverage and technological innovation in telecommunications are expected to increase the growth. The C-RAN provides key advantages, including reduced power costs, capacity and traffic fluctuation and others. Additionally, the increasing popularity of smartphones and tablet sales across the globe is likely to increase the growth of the C-RAN market. Furthermore, the demand for 5G communication infrastructure is anticipated to rise the demand for C-RAN network

What are the Major Risks for the C-RAN Market?

The need for high initial investments is the major restraint of the C-RAN market. The requirement to follow security standards negatively impacts the C-RAN market. Additionally, the stringent government policies to follow security standards hamper the market growth. Such factors are restraining the growth of the Global C-RAN market.

Which is the key network type in the C-RAN market?

The network type outlook segment is classified into 3G, LTE & 5G. The LTE& 5G segment accounts for the largest market share due to massive data traffic growth and rigorous power consumption impact by current network architecture, resulting in high-cost burdens for network operators, which is expected to grow the C-RAN market.

How is the C-RAN market performing in regions?

North America is expected to dominate the highest market share in the global C-RAN market. The key players in the region are introducing services for wireless mobile networks in the regional market. Such collaborations drive market growth in the North American region. Moreover, telecom operators’ high investment in R&D is expected to propel the C-RAN technology in the North American region. Furthermore, this Region has become valuable for the global C-RAN market of inventions and developments such as LTE and 5G networks. These factors are expected to grow the Global C-RAN market in North American Region.

The increasing deployment of C-RAN architecture as an initiative to commercialize the 5G in such countries as China and Japan is propelling the growth of the C-RAN in the Asia-Pacific region during the forecast period. Additionally, The South Korean government is supporting these networks provider to offer commercialization of 5G technology.

What is the regulatory landscape for the C-RAN market?

The governments are supporting the deployment of C-RAN as it enhances the country’s infrastructure, which is favorable for market growth. Furthermore, the adoption of wireless technologies in various industries, including automobiles, construction, mining, and others. In addition, the C-RAN is enhancing the capabilities of the defense system of the countries. Thus, due to these factors, governments support the deployment of C-RAN.

What is the Market Size of C-RAN regarding value?

The Global C-RAN market is anticipated to grow at a substantial CAGR of 22.50% in the upcoming years. The global C-RAN market industry was estimated to be worth USD 10.5 billion in 2021 and was expected to be worth USD 35.48 billion by 2028.

Shape Your Report to Specific Countries or Regions & Enjoy 30% Off!

What are the major players planning for the future of the C-RAN market?

In the global C-RAN market, the market players are collaborating with others to develop new technologies and deploy the wireless infrastructure worldwide, which is anticipated to support the market players during the forecast period. For instance, in February 2018, Intel, Nokia, and Verizon collaborated on new ground-breaking Cloud RAN architectures to provide the flexibility required for the operator’s future services and IoT in the cloud requirements. The trial advances Nokia and Intel’s collaboration to develop the next technological step in Cloud RAN, Verizon’s vRAN 2.0 architecture, which will put everything except the radio network in the cloud.

Segmentation of Global C-RAN Market 

Global C-RAN Market – By Architecture Type

  • Centralized-RAN
  • Virtualized/cloud-RAN

Global C-RAN Market – By Component

  • Infrastructure
  • Remote radio units
  • Baseband units
  • Fronthaul
  • Software
  • Services
  • Consulting
  • Design and deployment
  • Maintenance and support
  • Others

Global C-RAN Market – By Network Type

  • 3G
  • LTE & 5G

Global C-RAN Market – By Deployment Type

  • Indoor
  • Outdoor

Global C-RAN Market – By Region

  • North America
    • US
    • Canada
  • Europe
    • Germany
    • France
    • UK.
    • Italy
    • Spain
    • Rest of Europe
  • Asia Pacific
    • China
    • Japan
    • India
    • South Korea
    • South-east Asia
    • Rest of Asia Pacific
  • Latin America
    • Brazil
    • Mexico
    • Rest of Latin America
  • Middle East & Africa
    • GCC Countries
    • South Africa
    • Rest of Middle East and Africa

1. Preface
1.1. Report Description
1.1.1. Purpose of the Report
1.1.2. Target Audience
1.1.3. USP and Key Offerings
1.2. Research Scope
1.3. Research Methodology
1.3.1. Phase I – Secondary Research
1.3.2. Phase II – Primary Research
1.3.3. Phase III – Expert Panel Review
1.3.4. Approach Adopted
1.3.4.1. Top-Down Approach
1.3.4.2. Bottom-Up Approach
1.3.5. Assumptions
1.4. Market Segmentation

2. Executive Summary
2.1. Market Snapshot: Global C-RAN Market
2.2. Global C-RAN Market, By Architecture type outlook (Revenue, USD Million, 2016-2027) outlook (Revenue, USD Million, 2016-2027)
2.3. Global C-RAN Market, By Component outlook (Revenue, USD Million, 2016-2027)
2.4. Global C-RAN Market, By Network Architecture type outlook (Revenue, USD Million, 2016-2027)
2.5. Global C-RAN Market, By Deployment model (Revenue, USD Million, 2016-2027)
2.6. Global C-RAN Market, By Region

3. Market Dynamics & Factors Analysis
3.1. Introduction
3.1.1. Global C-RAN Market Value, 2016-2028, (US$ Bn)
3.2. Market Dynamics
3.2.1. Key Growth Trends
3.2.2. Market Drivers
3.2.3. Market Restraints
3.2.4. Market Opportunities
3.2.5. Major Industry Challenges
3.3. Attractive Investment Proposition,2021
3.3.1. Architecture type outlook (Revenue, USD Million, 2016-2027)
3.3.2. Component outlook (Revenue, USD Million, 2016-2027)
3.3.3. Network type outlook (Revenue, USD Million, 2016-2027)
3.3.4. Deployment model (Revenue, USD Million, 2016-2027)
3.3.5. Geography

4. Premium Insights
4.1. STAR (Situation, Task, Action, Results) Analysis
4.2. Porter’s Five Forces Analysis
4.2.1. Threat of New Entrants
4.2.2. Bargaining Power of Buyers/Consumers
4.2.3. Bargaining Power of Suppliers
4.2.4. Threat of Substitute Architecture type outlook (Revenue, USD Million, 2016-2027) s
4.2.5. Intensity of Competitive Rivalry
4.3. Value Chain Analysis
4.4. Technology Analysis
4.5. Marketing Strategy Analysis
4.5.1. Direct Marketing
4.5.2. Indirect Marketing
4.5.3. Marketing Channel Development Trend

5. Market Positioning of Key Players, 2021
5.1. Company market share of key players, 2021
5.2. Competitive Benchmarking
5.3. Market Positioning of Key Vendors
5.4. Geographical Presence Analysis
5.5. Major Strategies Adopted By Key Players
5.5.1. Key Strategies Analysis
5.5.2. Mergers and Acquisitions
5.5.3. Partnerships
5.5.4. Product Launch
5.5.5. Geographical Expansion
5.5.6. Others

6. COVID 19 Impact Analysis
6.1. Global C-RAN Market Pre Vs Post COVID 19, 2019 – 2028
6.2. Impact on Import & Export
6.3. Impact on Demand & Supply

7. Global C-RAN Market
7.1. Global C-RAN Market, By Architecture type outlook (Revenue, USD Million, 2016-2027) , 2016-2028(US$ Bn)
7.1.1. Overview
7.1.2. Global C-RAN market, By Architecture type outlook (Revenue, USD Million, 2016-2027), 2021 vs 2028 (in%)
7.1.3. Global C-RAN Market, By Centralized-RAN, 2016-2028 (US$ Bn)
7.1.4. Global C-RAN Market, By Virtualized/cloud-RAN, 2016-2028 (US$ Bn)

1.1. Global C-RAN Market, By Component outlook (Revenue, USD Million, 2016-2027) , 2016-2028(US$ Bn)
1.1.1. Overview
1.1.2. Global C-RAN Market, By Infrastructure, 2021 vs 2028 (in%)
1.1.3. Global C-RAN Market, By Remote radio Units, 2016-2028 (US$ Bn)
1.1.4. Global C-RAN Market, By Baseband Units, 2016-2028 (US$ Bn)
1.1.5. Global C-RAN Market, By Fronthaul, 2016-2028 (US$ Bn)
1.1.6. Global C-RAN Market, By Software, 2016-2028 (US$ Bn)
1.1.7. Global C-RAN Market, By Services, 2016-2028 (US$ Bn)
1.1.8. Global C-RAN Market, By Consulting, 2016-2028 (US$ Bn)
1.1.9. Global C-RAN Market, By Design and deployment, 2016-2028 (US$ Bn)
1.1.10. Global C-RAN Market, By Maintenance and support , 2016-2028 (US$ Bn)
1.1.11.
1.1.12. Global C-RAN Market, By Others, 2016-2028 (US$ Bn)
1.1. Global C-RAN Market, By Network type outlook (Revenue, USD Million, 2016-2027)
1.1.1. Overview
1.1.2. Global C-RAN Market, By Flexible Network type outlook (Revenue, USD Million, 2016-2027) , 2021 vs 2028 (in%)
1.1.3. Global C-RAN Market, By 3G, 2016-2028 (US$ Bn)
1.1.4. Global C-RAN Market, By LTE & 5G, 2016-2028 (US$ Bn)
1.2. Global C-RAN Market, By Deployment model (Revenue, USD Million, 2016-2027) , 2016-2028(US$ Bn)
1.2.1. Overview
1.2.2. Global C-RAN Market, By Indoor, 2021 vs 2028 (in%)
1.2.3. Global C-RAN Market, By Outdoor, 2016-2028 (US$ Bn)

1. North America C-RAN Market Analysis
1.1. North America C-RAN Market By Architecture type outlook (Revenue, USD Million, 2016-2027) , 2016-2028(US$ Bn)
1.1.1. Overview
1.1.2. SRC Analysis
1.2. North America C-RAN Market By Component outlook (Revenue, USD Million, 2016-2027) , 2016-2028(US$ Bn)
1.2.1. Overview
1.1. SRC Analysis
1.2. North America C-RAN Market By Network type outlook (Revenue, USD Million, 2016-2027) , 2016-2028(US$ Bn)
1.2.1. Overview
1.1. SRC Analysis
1.2. North America C-RAN Market By Deployment model (Revenue, USD Million, 2016-2027) , 2016-2028(US$ Bn)
1.2.1. Overview
1.3. SRC Analysis
1.4. North America C-RAN Market By Country, 2016-2028 (US$ Bn)
1.4.1. U.S.
1.4.1.1. U.S. C-RAN Market Estimates and Forecast, 2016-2028 (US$ Bn)
1.4.1.2. U.S. C-RAN By Architecture type outlook (Revenue, USD Million, 2016-2027) , 2016-2028 (US$ Bn)
1.4.1.3. U.S. C-RAN By Component outlook (Revenue, USD Million, 2016-2027) , 2016-2028 (US$ Bn)
1.4.1.4. U.S. C-RAN By Network type outlook (Revenue, USD Million, 2016-2027)
1.4.1.5. U.S. C-RAN By Deployment model (Revenue, USD Million, 2016-2027) , 2016-2028 (US$ Bn)
1.4.1.6. Canada
1.4.1.7. Canada C-RAN Market Estimates and Forecast, 2016-2028 (US$ Bn)
1.4.1.8. Canada C-RAN By Architecture type outlook (Revenue, USD Million, 2016-2027) , 2016-2028 (US$ Bn)
1.4.1.9. Canada C-RAN By Component outlook (Revenue, USD Million, 2016-2027) , 2016-2028 (US$ Bn)
1.4.1.10. Canada C-RAN By Network type outlook (Revenue, USD Million, 2016-2027)
1.4.1.11. Canada C-RAN By Deployment model (Revenue, USD Million, 2016-2027) , 2016-2028 (US$ Bn)
2. Europe C-RAN Market Analysis
2.1. Europe C-RAN Market By Architecture type outlook (Revenue, USD Million, 2016-2027) , 2016-2028(US$ Bn)
2.1.1. Overview
2.1.2. SRC Analysis
2.2. Europe C-RAN Market By Component outlook (Revenue, USD Million, 2016-2027) , 2016-2028(US$ Bn)
2.2.1. Overview
1.1. SRC Analysis
1.2. Europe C-RAN Market By Network type outlook (Revenue, USD Million, 2016-2027) , 2016-2028(US$ Bn)
1.2.1. Overview
1.1. SRC Analysis
1.2. Europe C-RAN Market By Deployment model (Revenue, USD Million, 2016-2027) , 2016-2028(US$ Bn)
1.2.1. Overview
1.2.2. SRC Analysis

1.3. Europe C-RAN Market By Country, 2016-2028 (US$ Bn)
1.3.1. Germany
1.3.1.1. Germany C-RAN Market Estimates and Forecast, 2016-2028 (US$ Bn)
1.3.1.2. Germany C-RAN By Architecture type outlook (Revenue, USD Million, 2016-2027) , 2016-2028 (US$ Bn)
1.3.1.3. Germany C-RAN By Component outlook (Revenue, USD Million, 2016-2027) , 2016-2028 (US$ Bn)
1.3.1.4. Germany C-RAN By Network type outlook (Revenue, USD Million, 2016-2027)
1.3.1.5. Germany C-RAN By Deployment model (Revenue, USD Million, 2016-2027) , 2016-2028 (US$ Bn)
1.3.2. France
1.3.2.1. France C-RAN Market Estimates and Forecast, 2016-2028 (US$ Bn)
1.3.2.2. France C-RAN By Architecture type outlook (Revenue, USD Million, 2016-2027) , 2016-2028 (US$ Bn)
1.3.2.3. France C-RAN By Component outlook (Revenue, USD Million, 2016-2027) , 2016-2028 (US$ Bn)
1.3.2.4. France C-RAN By Network type outlook (Revenue, USD Million, 2016-2027)
1.3.2.5. France C-RAN By Deployment model (Revenue, USD Million, 2016-2027) , 2016-2028 (US$ Bn)
1.3.3. UK
1.3.3.1. UK C-RAN Market Estimates and Forecast, 2016-2028 (US$ Bn)
1.3.3.2. UK C-RAN By Architecture type outlook (Revenue, USD Million, 2016-2027) , 2016-2028 (US$ Bn)
1.3.3.3. UK C-RAN By Component outlook (Revenue, USD Million, 2016-2027) , 2016-2028 (US$ Bn)
1.3.3.4. UK C-RAN By Network type outlook (Revenue, USD Million, 2016-2027)
1.3.3.5. UK C-RAN By Deployment model (Revenue, USD Million, 2016-2027) , 2016-2028 (US$ Bn)
1.3.4. Italy
1.3.4.1. Italy C-RAN Market Estimates and Forecast, 2016-2028 (US$ Bn)
1.3.4.2. Italy C-RAN By Architecture type outlook (Revenue, USD Million, 2016-2027) , 2016-2028 (US$ Bn)
1.3.4.3. Italy C-RAN By Component outlook (Revenue, USD Million, 2016-2027) , 2016-2028 (US$ Bn)
1.3.4.4. Italy C-RAN By Network type outlook (Revenue, USD Million, 2016-2027)
1.3.4.5. Italy C-RAN By Deployment model (Revenue, USD Million, 2016-2027) , 2016-2028 (US$ Bn)
1.3.5. Spain
1.3.5.1. Spain C-RAN Market Estimates and Forecast, 2016-2028 (US$ Bn)
1.3.5.2. Spain C-RAN By Architecture type outlook (Revenue, USD Million, 2016-2027) , 2016-2028 (US$ Bn)
1.3.5.3. Spain C-RAN By Component outlook (Revenue, USD Million, 2016-2027) , 2016-2028 (US$ Bn)
1.3.5.4. Spain C-RAN By Network type outlook (Revenue, USD Million, 2016-2027)
1.3.5.5. Spain C-RAN By Deployment model (Revenue, USD Million, 2016-2027) , 2016-2028 (US$ Bn)
1.3.6. Rest of Europe
1.3.6.1. Rest of Europe C-RAN Market Estimates and Forecast, 2016-2028 (US$ Bn)
1.3.6.2. Rest of Europe C-RAN By Architecture type outlook (Revenue, USD Million, 2016-2027) , 2016-2028 (US$ Bn)
1.3.6.3. Rest of Europe C-RAN By Component outlook (Revenue, USD Million, 2016-2027) , 2016-2028 (US$ Bn)
1.3.6.4. Rest of Europe C-RAN By Network type outlook (Revenue, USD Million, 2016-2027)
1.3.6.5. Rest of Europe C-RAN By Deployment model (Revenue, USD Million, 2016-2027) , 2016-2028 (US$ Bn)
1.4. Asia Pacific C-RAN Market Analysis
1.5. Asia Pacific C-RAN Market By Architecture type outlook (Revenue, USD Million, 2016-2027) , 2016-2028(US$ Bn)
1.5.1. Overview
1.5.2. SRC Analysis
1.6. Asia Pacific C-RAN Market By Component outlook (Revenue, USD Million, 2016-2027) , 2016-2028(US$ Bn)
1.6.1. Overview
1.1. SRC Analysis
1.2. Asia Pacific C-RAN Market By Network type outlook (Revenue, USD Million, 2016-2027) , 2016-2028(US$ Bn)
1.2.1. Overview
1.2.2. SRC Analysis
1.3. Asia Pacific C-RAN Market By Deployment model (Revenue, USD Million, 2016-2027) , 2016-2028(US$ Bn)
1.3.1. Overview
1.3.2. SRC Analysis

1.4. Asia Pacific C-RAN Market By Country, 2016-2028 (US$ Bn)
1.4.1. China
1.4.1.1. China C-RAN Market Estimates and Forecast, 2016-2028 (US$ Bn)
1.4.1.2. China C-RAN By Architecture type outlook (Revenue, USD Million, 2016-2027) , 2016-2028 (US$ Bn)
1.4.1.3. China C-RAN By Component outlook (Revenue, USD Million, 2016-2027) , 2016-2028 (US$ Bn)
1.4.1.4. China C-RAN By Network type outlook (Revenue, USD Million, 2016-2027)
1.4.1.5. China C-RAN By Deployment model (Revenue, USD Million, 2016-2027) , 2016-2028 (US$ Bn)
1.4.2. Japan
1.4.2.1. Japan C-RAN Market Estimates and Forecast, 2016-2028 (US$ Bn)
1.4.2.2. Japan C-RAN By Architecture type outlook (Revenue, USD Million, 2016-2027) , 2016-2028 (US$ Bn)
1.4.2.3. Japan C-RAN By Component outlook (Revenue, USD Million, 2016-2027) , 2016-2028 (US$ Bn)
1.4.2.4. Japan C-RAN By Network type outlook (Revenue, USD Million, 2016-2027)
1.4.2.5. Japan C-RAN By Deployment model (Revenue, USD Million, 2016-2027) , 2016-2028 (US$ Bn)
1.4.3. India
1.4.3.1. India C-RAN Market Estimates and Forecast, 2016-2028 (US$ Bn)
1.4.3.2. India C-RAN By Architecture type outlook (Revenue, USD Million, 2016-2027) , 2016-2028 (US$ Bn)
1.4.3.3. India C-RAN By Component outlook (Revenue, USD Million, 2016-2027) , 2016-2028 (US$ Bn)
1.4.3.4. India C-RAN By Network type outlook (Revenue, USD Million, 2016-2027)
1.4.3.5. India C-RAN By Deployment model (Revenue, USD Million, 2016-2027) , 2016-2028 (US$ Bn)
1.4.4. South Korea
1.4.4.1. South Korea C-RAN Market Estimates and Forecast, 2016-2028 (US$ Bn)
1.4.4.2. South Korea C-RAN By Architecture type outlook (Revenue, USD Million, 2016-2027) , 2016-2028 (US$ Bn)
1.4.4.3. South Korea C-RAN By Component outlook (Revenue, USD Million, 2016-2027) , 2016-2028 (US$ Bn)
1.4.4.4. South Korea C-RAN By Network type outlook (Revenue, USD Million, 2016-2027)
1.4.4.5. South Korea C-RAN By Deployment model (Revenue, USD Million, 2016-2027) , 2016-2028 (US$ Bn)
1.4.5. South-East Asia
1.4.5.1. South-East Asia C-RAN Market Estimates and Forecast, 2016-2028 (US$ Bn)
1.4.5.2. South-East Asia C-RAN By Architecture type outlook (Revenue, USD Million, 2016-2027) , 2016-2028 (US$ Bn)
1.4.5.3. South-East Asia C-RAN By Component outlook (Revenue, USD Million, 2016-2027) , 2016-2028 (US$ Bn)
1.4.5.4. South-East Asia C-RAN By Network type outlook (Revenue, USD Million, 2016-2027)
1.4.5.5. South-East Asia C-RAN By Deployment model (Revenue, USD Million, 2016-2027) , 2016-2028 (US$ Bn)
1.4.6. Rest of Asia Pacific
1.4.6.1. Rest of Asia Pacific C-RAN Market Estimates and Forecast, 2016-2028 (US$ Bn)
1.4.6.2. Rest of Asia Pacific C-RAN By Architecture type outlook (Revenue, USD Million, 2016-2027) , 2016-2028 (US$ Bn)
1.4.6.3. Rest of Asia Pacific C-RAN By Component outlook (Revenue, USD Million, 2016-2027) , 2016-2028 (US$ Bn)
1.4.6.4. Rest of Asia Pacific C-RAN By Network type outlook (Revenue, USD Million, 2016-2027)
1.4.6.5. Rest of Asia Pacific C-RAN By Deployment model (Revenue, USD Million, 2016-2027) , 2016-2028 (US$ Bn)

2. Latin America C-RAN Market Analysis
2.1. Latin America C-RAN Market By Architecture type outlook (Revenue, USD Million, 2016-2027) , 2016-2028(US$ Bn)
2.1.1. Overview
2.1.2. SRC Analysis
2.2. Latin America C-RAN Market By Component outlook (Revenue, USD Million, 2016-2027) , 2016-2028(US$ Bn)
2.2.1. Overview
1.1. SRC Analysis
1.2. Latin America C-RAN Market By Network type outlook (Revenue, USD Million, 2016-2027) , 2016-2028(US$ Bn)
1.2.1. Overview
1.2.2. SRC Analysis
1.3. Latin America C-RAN Market By Deployment model (Revenue, USD Million, 2016-2027) , 2016-2028(US$ Bn)
1.3.1. Overview
1.3.2. SRC Analysis

1.4. Latin America C-RAN Market By Country, 2016-2028 (US$ Bn)
1.4.1. Brazil
1.4.1.1. Brazil C-RAN Market Estimates and Forecast, 2016-2028 (US$ Bn)
1.4.1.2. Brazil C-RAN By Architecture type outlook (Revenue, USD Million, 2016-2027) , 2016-2028 (US$ Bn)
1.4.1.3. Brazil C-RAN By Component outlook (Revenue, USD Million, 2016-2027) , 2016-2028 (US$ Bn)
1.4.1.4. Brazil C-RAN By Network type outlook (Revenue, USD Million, 2016-2027)
1.4.1.5. Brazil C-RAN By Deployment model (Revenue, USD Million, 2016-2027) , 2016-2028 (US$ Bn)
1.4.2. Mexico
1.4.2.1. Mexico C-RAN Market Estimates and Forecast, 2016-2028 (US$ Bn)
1.4.2.2. Mexico C-RAN By Architecture type outlook (Revenue, USD Million, 2016-2027) , 2016-2028 (US$ Bn)
1.4.2.3. Mexico C-RAN By Component outlook (Revenue, USD Million, 2016-2027) , 2016-2028 (US$ Bn)
1.4.2.4. Mexico C-RAN By Network type outlook (Revenue, USD Million, 2016-2027)
1.4.2.5. Mexico C-RAN By Deployment model (Revenue, USD Million, 2016-2027) , 2016-2028 (US$ Bn)
1.4.3. Rest of Latin America
1.4.3.1. Rest of Latin America C-RAN Market Estimates and Forecast, 2016-2028 (US$ Bn)
1.4.3.2. Rest of Latin America C-RAN By Architecture type outlook (Revenue, USD Million, 2016-2027) , 2016-2028 (US$ Bn)
1.4.3.3. Rest of Latin America C-RAN By Component outlook (Revenue, USD Million, 2016-2027) , 2016-2028 (US$ Bn)
1.4.3.4. Rest of Latin America C-RAN By Network type outlook (Revenue, USD Million, 2016-2027)
1.4.3.5. Rest of Latin America C-RAN By Deployment model (Revenue, USD Million, 2016-2027) , 2016-2028 (US$ Bn)
2. Middle East and Africa C-RAN Market Analysis
2.1. Middle East and Africa C-RAN Market By Architecture type outlook (Revenue, USD Million, 2016-2027) , 2016-2028(US$ Bn)
2.1.1. Overview
2.1.2. SRC Analysis
2.2. Middle East and Africa C-RAN Market By Component outlook (Revenue, USD Million, 2016-2027) , 2016-2028(US$ Bn)
2.2.1. Overview
1.1. SRC Analysis
1.2. Middle East and Africa C-RAN Market By Network type outlook (Revenue, USD Million, 2016-2027), 2016-2028(US$ Bn)
1.2.1. Overview
1.2.2. SRC Analysis
1.3. Middle East and Africa C-RAN Market By Deployment model (Revenue, USD Million, 2016-2027) , 2016-2028(US$ Bn)
1.3.1. Overview
1.3.2. SRC Analysis
1.4. Middle East and Africa C-RAN Market By Country, 2016-2028 (US$ Bn)
1.4.1. GCC Countries
1.4.1.1. GCC Countries il C-RAN Market Estimates and Forecast, 2016-2028 (US$ Bn)
1.4.1.2. GCC Countries C-RAN By Architecture type outlook (Revenue, USD Million, 2016-2027) , 2016-2028 (US$ Bn)
1.4.1.3. GCC Countries C-RAN By Component outlook (Revenue, USD Million, 2016-2027) , 2016-2028 (US$ Bn)
1.4.1.4. GCC Countries C-RAN By Network type outlook (Revenue, USD Million, 2016-2027)
1.4.1.5. GCC Countries C-RAN By Deployment model (Revenue, USD Million, 2016-2027) , 2016-2028 (US$ Bn)
1.4.2. South Africa
1.4.2.1. South Africa C-RAN Market Estimates and Forecast, 2016-2028 (US$ Bn)
1.4.2.2. South Africa C-RAN By Architecture type outlook (Revenue, USD Million, 2016-2027) , 2016-2028 (US$ Bn)
1.4.2.3. South Africa C-RAN By Component outlook (Revenue, USD Million, 2016-2027) , 2016-2028 (US$ Bn)
1.4.2.4. South Africa C-RAN By Network type outlook (Revenue, USD Million, 2016-2027)
1.4.2.5. South Africa C-RAN By Deployment model (Revenue, USD Million, 2016-2027) , 2016-2028 (US$ Bn)
1.4.3. Rest of Middle East and Africa
1.4.3.1. Rest of Middle East and Africa C-RAN Market Estimates and Forecast, 2016-2028 (US$ Bn)
1.4.3.2. Rest of Middle East and Africa C-RAN By Architecture type outlook (Revenue, USD Million, 2016-2027) , 2016-2028 (US$ Bn)
1.4.3.3. Rest of Middle East and Africa C-RAN By Component outlook (Revenue, USD Million, 2016-2027) , 2016-2028 (US$ Bn)
1.4.3.4. Rest of Middle East and Africa C-RAN By Network type outlook (Revenue, USD Million, 2016-2027)
1.4.3.5. Rest of Middle East and Africa C-RAN By Deployment model (Revenue, USD Million, 2016-2027) , 2016-2028 (US$ Bn)

2. Company Profiles
2.1. Siemens (Germany)
2.1.1. Company Overview
2.1.2. Products/Healthcare Portfolio
2.1.3. Geographical Presence
2.1.4. Financial Summary
2.1.4.1. Market Revenue and Net Profit (2019-2021)
2.1.4.2. Business Segment Revenue Analysis
2.1.4.3. Geographical Revenue Analysis
2.2. Altiostar
2.3. ASOCS Ltd.
2.4. Cisco Systems Inc.
2.5. Telefonaktiebolaget
2.6. LM Ericsson
2.7. FUJITSU
2.8. Huawei Technologies Co.
2.9. Ltd.
2.10. NEC Corporation
2.11. Samsung Electronics CO Ltd.
2.12. Nokia Corporation Ltd.
2.13. ZTE Corporation

List of Figures

FIG. 1 Global C-RAN Market: Research Methodology
FIG. 2 Market Size Estimation – Top Down & Bottom up Approach
FIG. 3 Global C-RAN Market Segmentation
FIG. 4 Global C-RAN Market, By Architecture type outlook (Revenue, USD Million, 2016-2027) , 2021 (US$ Bn)
FIG. 5 Global C-RAN Market, By Component outlook (Revenue, USD Million, 2016-2027), 2021 (US$ Bn)
FIG. 6 Global C-RAN Market, By Network type outlook (Revenue, USD Million, 2016-2027), 2021 (US$ Bn)
FIG. 7 Global C-RAN Market, By Deployment model (Revenue, USD Million, 2016-2027), 2021 (US$ Bn)
FIG. 8 Global C-RAN Market, By Geography, 2021 (US$ Bn)
FIG. 9 Attractive Investment Proposition, By Architecture type outlook (Revenue, USD Million, 2016-2027) , 2021
FIG. 10 Attractive Investment Proposition, By Component outlook (Revenue, USD Million, 2016-2027) , 2021
FIG. 11 Attractive Investment Proposition, By Network type outlook (Revenue, USD Million, 2016-2027), 2021
FIG. 12 Attractive Investment Proposition, By Deployment model (Revenue, USD Million, 2016-2027) , 2021
FIG. 13 Attractive Investment Proposition, By Geography, 2021
FIG. 14 Global Market Share Analysis of Key C-RAN Market Manufacturers, 2021
FIG. 15 Global C-RAN Market Value Contribution, By Architecture type outlook (Revenue, USD Million, 2016-2027) , 2021 & 2028 (Value %)
FIG. 16 Global C-RAN Market, By Centralized-RAN , Value, 2016-2028 (US$ Bn)
FIG. 17 Global C-RAN Market, By Virtualized/cloud-RAN, Value, 2016-2028 (US$ Bn)
FIG. 18 Global C-RAN Market Value Contribution, By Component outlook (Revenue, USD Million, 2016-2027) , 2021 & 2028 (Value %)
FIG. 19 Global C-RAN Market, By Infrastructure, Value, 2016-2028 (US$ Bn)
FIG. 20 Global C-RAN Market, By Remote radio Units, Value, 2016-2028 (US$ Bn)
FIG. 21 Global C-RAN Market, By Baseband Units, Value, 2016-2028 (US$ Bn)
FIG. 22 Global C-RAN Market, By Fronthaul, Value, 2016-2028 (US$ Bn)
FIG. 23 Global C-RAN Market, By Software, Value, 2016-2028 (US$ Bn)
FIG. 24 Global C-RAN Market, By Services, Value, 2016-2028 (US$ Bn)
FIG. 25 Global C-RAN Market, By Consulting, Value, 2016-2028 (US$ Bn)
FIG. 26 Global C-RAN Market, By Design and Deployment, Value, 2016-2028 (US$ Bn)
FIG. 27 Global C-RAN Market, By Maintenance and support, Value, 2016-2028 (US$ Bn)
FIG. 28 Global C-RAN Market, By Others, Value, 2016-2028 (US$ Bn)
FIG. 29 Global C-RAN Market Value Contribution, By Network type outlook (Revenue, USD Million, 2016-2027), 2021 & 2028 (Value %)
FIG. 30 Global C-RAN Market, By 3G, Value, 2016-2028 (US$ Bn)
FIG. 31 Global C-RAN Market, By LTE & 5G, Value, 2016-2028 (US$ Bn)
FIG. 32 Global C-RAN Market Value Contribution, By Deployment model (Revenue, USD Million, 2016-2027) , 2021 & 2028 (Value %)
FIG. 33 Global C-RAN Market, By Indoor, Value, 2016-2028 (US$ Bn)
FIG. 34 Global C-RAN Market, By Outdoor, Value, 2016-2028 (US$ Bn)
FIG. 35 U.S.C-RAN Market 2016-2028 (US$ Bn)
FIG. 36 Canada C-RAN Market 2016-2028 (US$ Bn)
FIG. 37 Germany C-RAN Market 2016-2028 (US$ Bn)
FIG. 38 France C-RAN Market 2016-2028 (US$ Bn)
FIG. 39 U.K.C-RAN Market 2016-2028 (US$ Bn)
FIG. 40 Italy C-RAN Market 2016-2028 (US$ Bn)
FIG. 41 Spain C-RAN Market 2016-2028 (US$ Bn)
FIG. 42 Rest of Europe C-RAN Market 2016-2028 (US$ Bn)
FIG. 43 China C-RAN Market 2016-2028 (US$ Bn)
FIG. 44 Japan C-RAN Market 2016-2028 (US$ Bn)
FIG. 45 India C-RAN Market 2016-2028 (US$ Bn)
FIG. 46 South Korea C-RAN Market 2016-2028 (US$ Bn)
FIG. 47 Southeast Asia C-RAN Market 2016-2028 (US$ Bn)
FIG. 48 Rest of Asia PacificC-RAN Market 2016-2028 (US$ Bn)
FIG. 49 Latin America C-RAN Market 2016-2028 (US$ Bn)
FIG. 50 Brazil C-RAN Market 2016-2028 (US$ Bn)
FIG. 51 Mexico C-RAN Market 2016-2028 (US$ Bn)
FIG. 52 Rest of Latin America C-RAN Market 2016-2028 (US$ Bn)
FIG. 53 Middle East & Africa C-RAN Market 2016-2028 (US$ Bn)
FIG. 54 GCC Countries C-RAN Market 2016-2028 (US$ Bn)
FIG. 55 South Africa C-RAN Market 2016-2028 (US$ Bn)
FIG. 56 Rest of Middle East and Africa C-RAN Market 2016-2028 (US$ Bn)

List of Tables

TABLE 1 Market Snapshot: Global C-RAN Market
TABLE 2 Global C-RAN Market, By Competitive Benchmarking, 2021
TABLE 3 Global C-RAN Market, By Geographical Presence Analysis, 2021
TABLE 4 Global C-RAN Market, By Key Strategies Analysis, 2021
TABLE 5 Global C-RAN Market, By Architecture type outlook (Revenue, USD Million, 2016-2027) , 2016-2028 (US$ Bn)
TABLE 6 Global C-RAN Market, By Component outlook (Revenue, USD Million, 2016-2027) , 2016-2028 (US$ Bn)
TABLE 7 Global C-RAN Market, By Network type outlook (Revenue, USD Million, 2016-2027)
TABLE 8 Global C-RAN Market, By Deployment model (Revenue, USD Million, 2016-2027) , 2016-2028 (US$ Bn)
TABLE 9 Global C-RAN Market, By Geography, 2016-2028 (US$ Bn)
TABLE 10 North America C-RAN Market By Architecture type outlook (Revenue, USD Million, 2016-2027) , 2016-2028 (US$ Bn)
TABLE 11 North America C-RAN Market By Component outlook (Revenue, USD Million, 2016-2027) , 2016-2028 (US$ Bn)
TABLE 12 North America C-RAN Market By Network type outlook (Revenue, USD Million, 2016-2027)
TABLE 13 North America C-RAN Market By Deployment model (Revenue, USD Million, 2016-2027) , 2016-2028 (US$ Bn)
TABLE 14 North America C-RAN Market By Country, 2016-2028 (US$ Bn)
TABLE 15 US C-RAN Market By Architecture type outlook (Revenue, USD Million, 2016-2027) , 2016-2028 (US$ Bn)
TABLE 16 US C-RAN Market By Component outlook (Revenue, USD Million, 2016-2027) , 2016-2028 (US$ Bn)
TABLE 17 US C-RAN Market By Network type outlook (Revenue, USD Million, 2016-2027)
TABLE 18 US C-RAN Market By Deployment model (Revenue, USD Million, 2016-2027) , 2016-2028 (US$ Bn)
TABLE 19 Canada C-RAN Market By Architecture type outlook (Revenue, USD Million, 2016-2027) , 2016-2028 (US$ Bn)
TABLE 20 Canada C-RAN Market By Component outlook (Revenue, USD Million, 2016-2027) , 2016-2028 (US$ Bn)
TABLE 21 Canada C-RAN Market By Network type outlook (Revenue, USD Million, 2016-2027)
TABLE 22 Canada C-RAN Market By Deployment model (Revenue, USD Million, 2016-2027) , 2016-2028 (US$ Bn)
TABLE 23 Europe C-RAN Market By Architecture type outlook (Revenue, USD Million, 2016-2027) , 2016-2028 (US$ Bn)
TABLE 24 Europe C-RAN Market By Component outlook (Revenue, USD Million, 2016-2027) , 2016-2028 (US$ Bn)
TABLE 25 Europe C-RAN Market By Network type outlook (Revenue, USD Million, 2016-2027)
TABLE 26 Europe C-RAN Market By Deployment model (Revenue, USD Million, 2016-2027) , 2016-2028 (US$ Bn)
TABLE 27 Europe C-RAN Market By Country, 2016-2028 (US$ Bn)
TABLE 28 Germany C-RAN Market By Architecture type outlook (Revenue, USD Million, 2016-2027) , 2016-2028 (US$ Bn)
TABLE 29 Germany C-RAN Market By Component outlook (Revenue, USD Million, 2016-2027) , 2016-2028 (US$ Bn)
TABLE 30 Germany C-RAN Market By Network type outlook (Revenue, USD Million, 2016-2027)
TABLE 31 Germany C-RAN Market By Deployment model (Revenue, USD Million, 2016-2027) , 2016-2028 (US$ Bn)
TABLE 32 France C-RAN Market By Architecture type outlook (Revenue, USD Million, 2016-2027) , 2016-2028 (US$ Bn)
TABLE 33 France C-RAN Market By Component outlook (Revenue, USD Million, 2016-2027) , 2016-2028 (US$ Bn)
TABLE 34 France C-RAN Market By Network type outlook (Revenue, USD Million, 2016-2027)
TABLE 35 France C-RAN Market By Deployment model (Revenue, USD Million, 2016-2027) , 2016-2028 (US$ Bn)
TABLE 36 UK C-RAN Market By Architecture type outlook (Revenue, USD Million, 2016-2027) , 2016-2028 (US$ Bn)
TABLE 37 UK C-RAN Market By Component outlook (Revenue, USD Million, 2016-2027) , 2016-2028 (US$ Bn)
TABLE 38 UK C-RAN Market By Network type outlook (Revenue, USD Million, 2016-2027)
TABLE 39 UK C-RAN Market By Deployment model (Revenue, USD Million, 2016-2027) , 2016-2028 (US$ Bn)
TABLE 40 Italy C-RAN Market By Architecture type outlook (Revenue, USD Million, 2016-2027) , 2016-2028 (US$ Bn)
TABLE 41 Italy C-RAN Market By Component outlook (Revenue, USD Million, 2016-2027) , 2016-2028 (US$ Bn)
TABLE 42 Italy C-RAN Market By Network type outlook (Revenue, USD Million, 2016-2027)
TABLE 43 Italy C-RAN Market By Deployment model (Revenue, USD Million, 2016-2027) , 2016-2028 (US$ Bn)
TABLE 44 Spain C-RAN Market By Architecture type outlook (Revenue, USD Million, 2016-2027) , 2016-2028 (US$ Bn)
TABLE 45 Spain C-RAN Market By Component outlook (Revenue, USD Million, 2016-2027) , 2016-2028 (US$ Bn)
TABLE 46 Spain C-RAN Market By Network type outlook (Revenue, USD Million, 2016-2027)
TABLE 47 Spain C-RAN Market By Deployment model (Revenue, USD Million, 2016-2027) , 2016-2028 (US$ Bn)
TABLE 48 Rest of Europe C-RAN Market By Architecture type outlook (Revenue, USD Million, 2016-2027) , 2016-2028 (US$ Bn)
TABLE 49 Rest of Europe C-RAN Market By Component outlook (Revenue, USD Million, 2016-2027) , 2016-2028 (US$ Bn)
TABLE 50 Rest of Europe C-RAN Market By Network type outlook (Revenue, USD Million, 2016-2027)
TABLE 51 Rest of Europe C-RAN Market By Deployment model (Revenue, USD Million, 2016-2027) , 2016-2028 (US$ Bn)
TABLE 52 Asia Pacific C-RAN Market By Architecture type outlook (Revenue, USD Million, 2016-2027) , 2016-2028 (US$ Bn)
TABLE 53 Asia Pacific C-RAN Market By Component outlook (Revenue, USD Million, 2016-2027) , 2016-2028 (US$ Bn)
TABLE 54 Asia Pacific C-RAN Market By Network type outlook (Revenue, USD Million, 2016-2027)
TABLE 55 Asia Pacific C-RAN Market By Deployment model (Revenue, USD Million, 2016-2027) , 2016-2028 (US$ Bn)
TABLE 56 Asia Pacific C-RAN Market By Country, 2016-2028 (US$ Bn)
TABLE 57 China C-RAN Market By Architecture type outlook (Revenue, USD Million, 2016-2027) , 2016-2028 (US$ Bn)
TABLE 58 China C-RAN Market By Component outlook (Revenue, USD Million, 2016-2027) , 2016-2028 (US$ Bn)
TABLE 59 China C-RAN Market By Network type outlook (Revenue, USD Million, 2016-2027)
TABLE 60 China C-RAN Market By Deployment model (Revenue, USD Million, 2016-2027) , 2016-2028 (US$ Bn)
TABLE 61 Japan C-RAN Market By Architecture type outlook (Revenue, USD Million, 2016-2027) , 2016-2028 (US$ Bn)
TABLE 62 Japan C-RAN Market By Component outlook (Revenue, USD Million, 2016-2027) , 2016-2028 (US$ Bn)
TABLE 63 Japan C-RAN Market By Network type outlook (Revenue, USD Million, 2016-2027)
TABLE 64 Japan C-RAN Market By Deployment model (Revenue, USD Million, 2016-2027) , 2016-2028 (US$ Bn)
TABLE 65 India C-RAN Market By Architecture type outlook (Revenue, USD Million, 2016-2027) , 2016-2028 (US$ Bn)
TABLE 66 India C-RAN Market By Component outlook (Revenue, USD Million, 2016-2027) , 2016-2028 (US$ Bn)
TABLE 67 India C-RAN Market By Network type outlook (Revenue, USD Million, 2016-2027)
TABLE 68 India C-RAN Market By Deployment model (Revenue, USD Million, 2016-2027) , 2016-2028 (US$ Bn)
TABLE 69 South Korea C-RAN Market By Architecture type outlook (Revenue, USD Million, 2016-2027) , 2016-2028 (US$ Bn)
TABLE 70 South Korea C-RAN Market By Component outlook (Revenue, USD Million, 2016-2027) , 2016-2028 (US$ Bn)
TABLE 71 South Korea C-RAN Market By Network type outlook (Revenue, USD Million, 2016-2027)
TABLE 72 South Korea C-RAN Market By Deployment model (Revenue, USD Million, 2016-2027) , 2016-2028 (US$ Bn)
TABLE 73 South East Asia C-RAN Market By Architecture type outlook (Revenue, USD Million, 2016-2027) , 2016-2028 (US$ Bn)
TABLE 74 South East Asia C-RAN Market By Component outlook (Revenue, USD Million, 2016-2027) , 2016-2028 (US$ Bn)
TABLE 75 South East Asia C-RAN Market By Network type outlook (Revenue, USD Million, 2016-2027)
TABLE 76 South East Asia C-RAN Market By Deployment model (Revenue, USD Million, 2016-2027) , 2016-2028 (US$ Bn)
TABLE 77 Rest of Asia Pacific C-RAN Market By Architecture type outlook (Revenue, USD Million, 2016-2027) , 2016-2028 (US$ Bn)
TABLE 78 Rest of Asia Pacific C-RAN Market By Component outlook (Revenue, USD Million, 2016-2027) , 2016-2028 (US$ Bn)
TABLE 79 Rest of Asia Pacific C-RAN Market By Network type outlook (Revenue, USD Million, 2016-2027)
TABLE 80 Rest of Asia Pacific C-RAN Market By Deployment model (Revenue, USD Million, 2016-2027) , 2016-2028 (US$ Bn)
TABLE 81 Latin America C-RAN Market By Architecture type outlook (Revenue, USD Million, 2016-2027) , 2016-2028 (US$ Bn)
TABLE 82 Latin America C-RAN Market By Component outlook (Revenue, USD Million, 2016-2027) , 2016-2028 (US$ Bn)
TABLE 83 Latin America C-RAN Market By Network type outlook (Revenue, USD Million, 2016-2027)
TABLE 84 Latin America C-RAN Market By Deployment model (Revenue, USD Million, 2016-2027) , 2016-2028 (US$ Bn)
TABLE 85 Latin America C-RAN Market By Country, 2016-2028 (US$ Bn)
TABLE 86 Brazil C-RAN Market By Architecture type outlook (Revenue, USD Million, 2016-2027) , 2016-2028 (US$ Bn)
TABLE 87 Brazil C-RAN Market By Component outlook (Revenue, USD Million, 2016-2027) , 2016-2028 (US$ Bn)
TABLE 88 Brazil C-RAN Market By Network type outlook (Revenue, USD Million, 2016-2027)
TABLE 89 Brazil C-RAN Market By Deployment model (Revenue, USD Million, 2016-2027) , 2016-2028 (US$ Bn)
TABLE 90 Mexico C-RAN Market By Architecture type outlook (Revenue, USD Million, 2016-2027) , 2016-2028 (US$ Bn)
TABLE 91 Mexico C-RAN Market By Component outlook (Revenue, USD Million, 2016-2027) , 2016-2028 (US$ Bn)
TABLE 92 Mexico C-RAN Market By Network type outlook (Revenue, USD Million, 2016-2027)
TABLE 93 Mexico C-RAN Market By Deployment model (Revenue, USD Million, 2016-2027) , 2016-2028 (US$ Bn)
TABLE 94 Rest of Latin America C-RAN Market By Architecture type outlook (Revenue, USD Million, 2016-2027) , 2016-2028 (US$ Bn)
TABLE 95 Rest of Latin America C-RAN Market By Component outlook (Revenue, USD Million, 2016-2027) , 2016-2028 (US$ Bn)
TABLE 96 Rest of Latin America C-RAN Market By Network type outlook (Revenue, USD Million, 2016-2027)
TABLE 97 Rest of Latin America C-RAN Market By Deployment model (Revenue, USD Million, 2016-2027) , 2016-2028 (US$ Bn)
TABLE 98 Middle East and Africa C-RAN Market By Architecture type outlook (Revenue, USD Million, 2016-2027) , 2016-2028 (US$ Bn)
TABLE 99 Middle East and Africa C-RAN Market By Component outlook (Revenue, USD Million, 2016-2027) , 2016-2028 (US$ Bn)
TABLE 100 Middle East and Africa C-RAN Market By Network type outlook (Revenue, USD Million, 2016-2027)
TABLE 101 Middle East and Africa C-RAN Market By Deployment model (Revenue, USD Million, 2016-2027) , 2016-2028 (US$ Bn)
TABLE 102 Middle East and Africa C-RAN Market By Country, 2016-2028 (US$ Bn)
TABLE 103 GCC Countries C-RAN Market By Architecture type outlook (Revenue, USD Million, 2016-2027) , 2016-2028 (US$ Bn)
TABLE 104 GCC Countries C-RAN Market By Component outlook (Revenue, USD Million, 2016-2027) , 2016-2028 (US$ Bn)
TABLE 105 GCC Countries C-RAN Market By Network Architecture type outlook (Revenue, USD Million, 2016-2027), 2016-2028 (US$ Bn)
TABLE 106 GCC Countries C-RAN Market By Deployment model (Revenue, USD Million, 2016-2027) , 2016-2028 (US$ Bn)
TABLE 107 South Africa C-RAN Market By Architecture type outlook (Revenue, USD Million, 2016-2027) , 2016-2028 (US$ Bn)
TABLE 108 South Africa C-RAN Market By Component outlook (Revenue, USD Million, 2016-2027) , 2016-2028 (US$ Bn)
TABLE 109 South Africa C-RAN Market By Network type outlook (Revenue, USD Million, 2016-2027)
TABLE 110 South Africa C-RAN Market By Deployment model (Revenue, USD Million, 2016-2027) , 2016-2028 (US$ Bn)
TABLE 111 Rest of Middle East and Africa C-RAN Market By Architecture type outlook (Revenue, USD Million, 2016-2027) , 2016-2028 (US$ Bn)
TABLE 112 Rest of Middle East and Africa C-RAN Market By Component outlook (Revenue, USD Million, 2016-2027) , 2016-2028 (US$ Bn)
TABLE 113 Rest of Middle East and Africa C-RAN Market By Network type outlook (Revenue, USD Million, 2016-2027)
TABLE 114 Rest of Middle East and Africa C-RAN Market By Deployment model (Revenue, USD Million, 2016-2027) , 2016-2028 (US$ Bn)

Frequently Asked Question

Which key factors will influence the C-RAN market growth over 2022-2028?

The advancements toward fifth-generation wireless technology are major factors driving the market growth. The 5G network has the fastest growth due to the adoption of 5G has led to a large amount of mobile data traffic traversing the network. The increasing adoption of high-speed and large network coverage and technological innovation in telecommunications are expected to increase the growth. The C-RAN provides key advantages, including reduced power costs, capacity and traffic fluctuation

What will be the value of the C-RAN market during 2022-2028?

The Global C-RAN market is anticipated to grow at a substantial CAGR of 22.50% in the upcoming years. The global C-RAN market industry was estimated to be worth USD 10.5 billion in 2021 and was expected to be worth USD 35.48 billion by 2028.

Which region will contribute notably towards the C-RAN market value?

North America is expected to dominate the highest market share in the global C-RAN market. The key players in the region are introducing services for wireless mobile networks in the regional market. Such collaborations drive market growth in the North American region. Moreover, telecom operators’ high investment in R&D is expected to propel the C-RAN technology in the North American region. Furthermore, this Region has become valuable for the global C-RAN market of inventions and developments

Which are the significant players leveraging the C-RAN market growth?

Some of the major players in the market are Altiostar; ASOCS Ltd; Cisco Systems, Inc.; Telefonaktiebolaget; LM Ericsson; FUJITSU; Huawei Technologies Co., Ltd; NEC Corporation; Samsung Electronics Co Ltd.; Nokia Corporation; ZTE Corporation.

Which is the major type segment in the C-RAN market?

In 2021, the centralized-RAN segment will dominate the C-RAN market’s share due to technological advancements offered for optical, wireless, and IT communications systems, which are expected to grow.

China Wifi Chipset Market

Published:
Report ID: 35900

Communications Platform as a Service CPaaS Market

Published:
Report ID: 19346

WiFi Chipset Market

Published:
Report ID: 12058

Remote Sensing Services Market

Published:
Report ID: 16016

Industrial Multiprotocol Gateways Market

Published:
Report ID: 7612

Network Analyzer Market

Published:
Report ID: 14479

Home Wifi Router And Extender Market

Published:
Report ID: 7016

Peripheral Component Interconnect Express Market

Published:
Report ID: 9196

IP Intercom Market

Published:
Report ID: 7337

Wireless Communication Module Market

Published:
Report ID: 12126

Fusion Splicer Market

Published:
Report ID: 5872

Fiber Optical Interconnects Market

Published:
Report ID: 6421

Purchase Options

$2999
Delivery Format: Excel.
$4999
Designed for the individual purchaser.
$6999
Users located at a single corporate site or regional office.
$7999
Allowed for unlimited sharing globally within one company.
Smallform of Sample request

Have a question?

User Profile

Don’t settle for less – trust Mitul to help you find the best solution.

Report delivery within 24 to 48 hours

– Other Info –

What people say?-

User Review

I am very impressed with the information in this report. The author clearly did their research when they came up with this product and it has already given me a lot of ideas.

Jana Schmidt
CEDAR CX Technologies

– Connect with us –

Phone

+91 6232 49 3207


support

24/7 Research Support


sales@credenceresearch.com

– Research Methodology –

Going beyond the basics: advanced techniques in research methodology

– Trusted By –

Pepshi, LG, Nestle
Motorola, Honeywell, Johnson and johnson
LG Chem, SIEMENS, Pfizer
Unilever, Samsonite, QIAGEN