
Market Overview
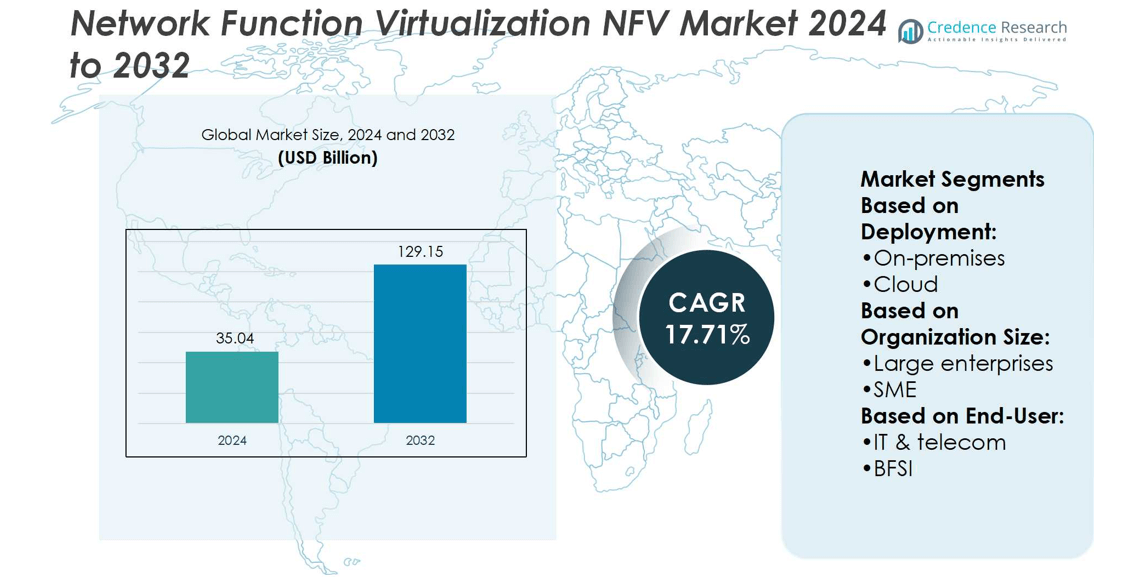
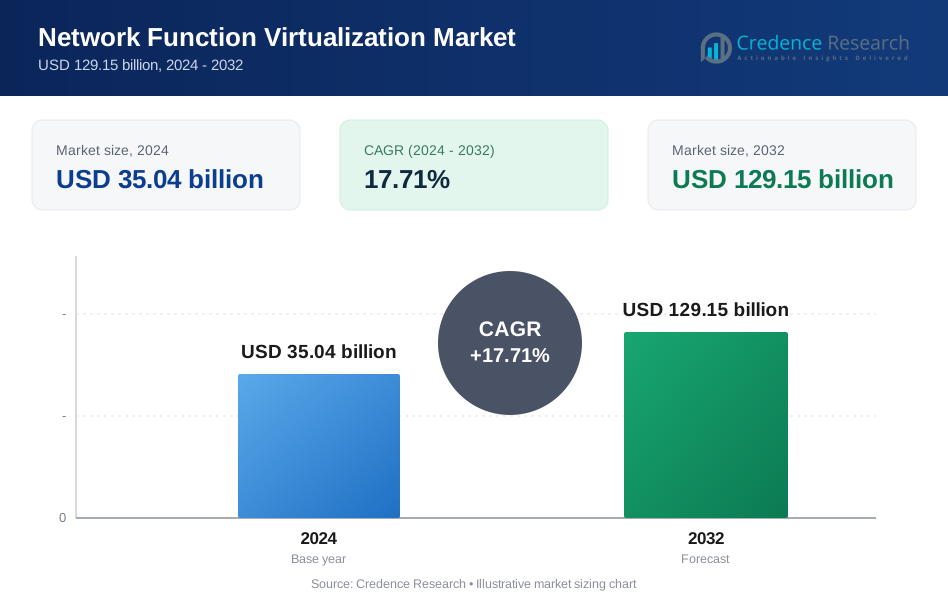
Network Function Virtualization NFV Market size was valued at USD 35.04 billion in 2024 and is anticipated to reach USD 129.15 billion by 2032, at a CAGR of 17.71% during the forecast period.
| REPORT ATTRIBUTE | DETAILS |
|---|---|
| Historical Period | 2020-2023 |
| Base Year | 2024 |
| Forecast Period | 2025-2032 |
| Network Function Virtualization (NFV) Market Size 2024 | USD 35.04 billion |
| Network Function Virtualization (NFV) Market CAGR | 17.71% |
| Network Function Virtualization (NFV) Market Size 2032 | USD 129.15 billion |
The Network Function Virtualization NFV Market grows through strong demand for flexible, cost-efficient networking solutions and the rapid expansion of 5G infrastructure. Enterprises adopt NFV to reduce hardware dependence, improve scalability, and optimize resource utilization. Rising data traffic and digital transformation initiatives accelerate deployment across telecom, BFSI, and government sectors. Key trends include adoption of cloud-native NFV, integration with edge computing, and use of AI-driven orchestration to enhance automation and service delivery. Interoperability through open standards and growing reliance on multi-vendor ecosystems further shape the market, reinforcing NFV’s role in enabling agile, secure, and future-ready network environments.
The Network Function Virtualization NFV Market shows strong geographical presence, with North America leading through advanced telecom infrastructure, followed by Europe’s emphasis on open standards and Asia-Pacific’s rapid growth from 5G and IoT adoption. Latin America and the Middle East & Africa display steady expansion supported by digital transformation initiatives. Key players influencing the market include Cisco Systems, Huawei Technologies, IBM, Broadcom, Hewlett Packard Enterprise (HPE), Check Point Software Technologies Ltd., Nokia Corporation, Riverbed Technology, Juniper Networks, and BMC Software.
Market Insights
- The Network Function Virtualization NFV Market was valued at USD 35.04 billion in 2024 and is projected to reach USD 129.15 billion by 2032, at a CAGR of 17.71%.
- Strong demand for flexible and cost-efficient networking solutions drives adoption across telecom and enterprise sectors.
- Key trends include cloud-native NFV, edge computing integration, and AI-driven orchestration for automation.
- Competition is intense, with companies focusing on cloud-native platforms, interoperability, and security-driven virtualization.
- Market restraints include deployment complexity, interoperability challenges, and concerns over security and reliability.
- North America leads the market, Europe emphasizes open standards, and Asia-Pacific records the fastest growth with 5G and IoT adoption.
- Latin America and the Middle East & Africa expand steadily with digital transformation, supported by key players such as Cisco Systems, Huawei Technologies, IBM, Broadcom, HPE, Check Point Software Technologies Ltd., Nokia Corporation, Riverbed Technology, Juniper Networks, and BMC Software.
Market Drivers
Rising Demand for Flexible Network Infrastructure Across Enterprises
The Network Function Virtualization NFV Market grows with enterprises seeking agility and cost savings. Traditional hardware-based solutions limit scalability and create higher operational expenses. NFV enables businesses to deploy network services through software, reducing dependence on physical devices. Telecom providers benefit from its flexibility to roll out services quickly. Enterprises adopt NFV to manage dynamic workloads and handle growing data traffic. It supports efficiency by improving resource utilization and lowering infrastructure costs.
- For instance, Riverbed Technology deployed its SteelHead WAN optimization solution in over 30,000 organizations worldwide. Later, the company incorporated SD-WAN capabilities into the product, resulting in the SteelHead SD.
Strong Push From 5G Deployment and Mobile Network Expansion
5G rollout drives adoption of NFV across telecom networks worldwide. Operators use NFV to manage complex traffic patterns and support diverse 5G applications. It enhances service quality by enabling dynamic scaling of network functions. Mobile operators leverage NFV for faster delivery of services like IoT connectivity and edge computing. The technology provides virtualized cores that integrate seamlessly with 5G architecture. Growing mobile broadband subscriptions push operators to adopt NFV solutions for reliability and speed.
- For instance, Nokia customers using Intel® Xeon 6 with E-cores saw 150% increase in compute performance and 60% smaller server footprint deployed in their 5G core test environments.
Focus on Reducing Capital Expenditure and Operating Costs
The Network Function Virtualization NFV Market gains traction as enterprises prioritize cost reduction. NFV allows consolidation of multiple network functions on standard hardware, lowering capital investments. It reduces the need for specialized devices, decreasing maintenance and procurement costs. Service providers adopt NFV to optimize resource usage and automate processes. It improves energy efficiency by consolidating workloads onto fewer servers. Cost benefits remain a primary driver behind large-scale deployments.
Growing Adoption of Cloud-Based Solutions and Virtualized Platforms
Cloud integration strengthens NFV deployment across industries. Enterprises rely on cloud-native NFV to achieve scalability and faster innovation. It enables organizations to deliver services on-demand and adapt to fluctuating workloads. Virtualized platforms support seamless migration from hardware-based systems. NFV aligns with digital transformation initiatives by offering automation and centralized management. Increasing cloud adoption ensures continued growth and relevance of NFV in global networks.
Market Trends
Expansion of NFV in Edge Computing and 5G Network Ecosystems
The Network Function Virtualization NFV Market shows strong alignment with edge computing and 5G adoption. Telecom operators deploy NFV at the network edge to reduce latency and enhance real-time applications. It improves service delivery for use cases like autonomous vehicles, AR/VR, and industrial automation. Integration with 5G core networks enables agile deployment of virtualized functions. Edge-based NFV platforms support bandwidth-heavy services with greater efficiency. This trend accelerates demand for scalable and distributed NFV solutions.
- For instance, BMC Helix Edge deployments are designed to run at industrial scale, with each edge worker node requiring 4 multi-core processors 16 GB of RAM is required per worker node.
Shift Toward Cloud-Native NFV Architectures for Greater Agility
Cloud-native frameworks are reshaping NFV deployments across enterprises and service providers. The Network Function Virtualization NFV Market benefits from container-based solutions that replace traditional virtual machines. It allows faster service rollouts and simpler orchestration. Cloud-native NFV supports microservices that improve flexibility and scalability of network functions. Service providers adopt Kubernetes-based platforms to streamline operations. The shift reflects growing demand for high automation and reduced deployment complexity.
- For instance, Huawei’s VXLAN technology supports up to 16 million unique VXLAN segments using 24-bit VXLAN Network Identifiers (VNIs), compared to a maximum of 4,096 VLANs in traditional setups.
Integration of Artificial Intelligence and Machine Learning in NFV Platforms
AI and ML play a central role in advancing NFV operations. The Network Function Virtualization NFV Market embraces predictive analytics to enhance resource allocation and fault management. It improves automation of network monitoring and anomaly detection. AI-driven orchestration optimizes traffic routing and improves quality of service. Machine learning tools enable adaptive scaling of virtualized functions. Service providers rely on these technologies to achieve operational efficiency and minimize downtime.
Rising Demand for Multi-Vendor Interoperability and Open Standards
Interoperability emerges as a critical trend within NFV adoption. The Network Function Virtualization NFV Market advances through open-source projects and industry-wide collaborations. It promotes flexibility by allowing integration of solutions from multiple vendors. Open standards reduce vendor lock-in and increase innovation across the ecosystem. Service providers seek interoperable platforms to enhance agility and reduce costs. This trend strengthens the role of collaborative frameworks such as ETSI NFV specifications.
Market Challenges Analysis
Complexity in Deployment and Integration Across Diverse Network Environments
The Network Function Virtualization NFV Market faces significant hurdles due to the complexity of integration with legacy infrastructure. Many service providers still operate on hardware-centric models that are difficult to transition into software-defined systems. It requires extensive planning, skilled resources, and strong coordination to align virtual functions with existing hardware and protocols. Interoperability across multi-vendor platforms adds further technical barriers, slowing adoption rates. The absence of unified deployment standards increases deployment risks and operational inefficiencies. These challenges create delays in achieving full-scale NFV implementation and limit its short-term scalability.
Concerns Over Security, Reliability, and High Operational Costs
Security and reliability remain ongoing challenges in NFV adoption. The Network Function Virtualization NFV Market experiences risk exposure from software vulnerabilities that can compromise critical network functions. It raises concerns for telecom operators and enterprises that manage sensitive data and services. Virtualized environments require continuous monitoring, patching, and robust threat detection systems. Operational costs also rise due to frequent upgrades, staff training, and maintenance of complex virtual networks. Limited expertise in managing large-scale NFV platforms further slows deployment efficiency. These challenges highlight the pressing need for standardized frameworks and stronger security practices across the NFV ecosystem.
Market Opportunities
Expansion Potential in 5G, IoT, and Edge Deployments
The Network Function Virtualization NFV Market holds significant opportunities through integration with 5G and IoT ecosystems. Telecom providers use NFV to support low-latency services at the network edge. It creates value for industries relying on real-time applications, including healthcare, automotive, and manufacturing. NFV platforms enable operators to deliver scalable services tailored to different verticals. The surge of connected devices in IoT demands flexible and programmable network functions. This opportunity reinforces NFV as a critical enabler of next-generation digital infrastructure.
Growth in Cloud-Native Solutions and Enterprise Digital Transformation
Rising enterprise investments in digital transformation create a favorable market landscape for NFV adoption. The Network Function Virtualization NFV Market benefits from cloud-native platforms that offer agility and automation. It supports enterprises shifting toward flexible IT models that reduce reliance on legacy hardware. Cloud-native NFV also enhances service orchestration, improving delivery speed and operational efficiency. Enterprises view NFV as an opportunity to streamline operations and strengthen competitive advantage. Expanding use cases across financial services, retail, and government further accelerate its adoption potential.
Market Segmentation Analysis:
By Deployment
The Network Function Virtualization NFV Market demonstrates steady growth across on-premises and cloud deployments. On-premises deployment remains important for organizations requiring full control over network infrastructure, data privacy, and regulatory compliance. It supports industries with strict governance such as defense and government. Cloud deployment continues to expand rapidly, driven by the demand for agility and cost efficiency. Enterprises adopt cloud-based NFV to scale services quickly and reduce reliance on physical hardware. This model provides flexibility for dynamic workloads and supports faster service launches across global operations. The shift toward hybrid approaches indicates a balanced adoption of both deployment models.
- For instance, Cisco’s NFV Infrastructure (NFVI) delivers 20 Gbit/s Ethernet switching and 2.5 Gbit/s virtual routing throughput per Haswell or Sandy Bridge core—ensuring carrier-grade performance even with single-core deployment.
By Organization Size
Large enterprises dominate NFV adoption due to their ability to invest in advanced infrastructure and automation. The Network Function Virtualization NFV Market benefits from their focus on scalability and service innovation. It allows large enterprises to optimize resources, reduce operational costs, and support digital transformation initiatives. Small and medium enterprises (SMEs) increasingly embrace NFV through cloud-based offerings. Cloud deployment lowers entry barriers for SMEs by reducing upfront costs and infrastructure complexity. This adoption improves network performance and enables SMEs to compete with larger players. Growing awareness of NFV’s role in enhancing operational efficiency drives uptake across smaller organizations.
- For instance, AT&T’s Universal Customer Premises Equipment (uCPE) models support up to 12 virtual network functions (VNFs) on the largest form factor device, which offers 32 virtual CPUs, 128 GB RAM, and up to 1.6 TB SSD storage allocated for VNFs.
By End-User
IT and telecom remain the leading end-user segment, accounting for the largest share of NFV adoption. The Network Function Virtualization NFV Market strengthens its presence here through support for high data traffic, 5G networks, and edge services. It enhances service delivery by enabling network automation and flexible deployment. The BFSI sector adopts NFV to secure digital platforms, streamline operations, and deliver scalable financial services. It supports cloud-based banking solutions, mobile transactions, and secure data handling. Government agencies adopt NFV to modernize networks, improve efficiency, and strengthen data security. Their demand for reliable and cost-effective solutions continues to shape adoption trends within the market.
Segments:
Based on Deployment:
- On-premises
- Cloud
Based on Organization Size:
- Large enterprises
- SME
Based on End-User:
- IT & telecom
- BFSI
Based on the Geography:
- North America
- U.S.
- Canada
- Mexico
- Europe
- UK
- France
- Germany
- Italy
- Spain
- Russia
- Belgium
- Netherlands
- Austria
- Sweden
- Poland
- Denmark
- Switzerland
- Rest of Europe
- Asia Pacific
- China
- Japan
- South Korea
- India
- Australia
- Thailand
- Indonesia
- Vietnam
- Malaysia
- Philippines
- Taiwan
- Rest of Asia Pacific
- Latin America
- Brazil
- Argentina
- Peru
- Chile
- Colombia
- Rest of Latin America
- Middle East
- UAE
- KSA
- Israel
- Turkey
- Iran
- Rest of Middle East
- Africa
- Egypt
- Nigeria
- Algeria
- Morocco
- Rest of Africa
Regional Analysis
North America
North America holds the largest share of the Network Function Virtualization NFV Market, accounting for 34% of global revenue in 2024. The region benefits from advanced telecom infrastructure, early adoption of 5G, and strong investments in digital transformation. It leads in NFV integration across IT and telecom operators, with major players such as AT&T, Verizon, and Cisco actively deploying virtualized platforms. Enterprises across sectors including BFSI and government adopt NFV to strengthen scalability, automate services, and optimize costs. It is also supported by a favorable regulatory framework encouraging virtualization, cloud adoption, and security compliance. Continuous research and development in cloud-native NFV and AI-driven orchestration further strengthen the region’s leadership. North America is expected to maintain steady growth supported by ongoing 5G rollouts and rising enterprise investments in advanced virtualized solutions.
Europe
Europe represents 27% of the Network Function Virtualization NFV Market share in 2024, driven by strong emphasis on digitalization and regulatory compliance. Telecom operators across Germany, the UK, and France deploy NFV to enhance service flexibility and support edge computing for 5G networks. The region places strong focus on open standards and interoperability, supported by European Telecommunications Standards Institute (ETSI) frameworks. Enterprises in the BFSI and government sectors drive adoption to ensure secure and compliant services. It also benefits from large-scale adoption of cloud-native solutions supported by local data center infrastructure. Growth in Europe remains consistent, supported by rising IoT adoption and government-led initiatives to strengthen digital ecosystems. Continued focus on sustainability and energy efficiency in NFV solutions also influences deployment trends across the region.
Asia-Pacific
Asia-Pacific holds 24% of the Network Function Virtualization NFV Market share in 2024, and it represents the fastest-growing regional market. Rapid industrialization, widespread 5G rollouts, and rising smartphone penetration create strong demand for NFV platforms. Telecom operators in China, Japan, South Korea, and India actively deploy NFV to manage high data volumes and deliver cost-effective services. It supports IoT integration, mobile broadband expansion, and digital enterprise services across industries. Enterprises also adopt NFV solutions to modernize infrastructure and accelerate cloud-based operations. It is strongly influenced by investments from both global vendors and regional players seeking scalable digital solutions. Asia-Pacific is expected to expand rapidly due to increasing demand for automation, cloud-native solutions, and digital transformation across multiple verticals.
Latin America
Latin America accounts for 8% of the Network Function Virtualization NFV Market share in 2024, with steady growth driven by telecom modernization and enterprise digital initiatives. Countries such as Brazil and Mexico lead adoption, supported by investments in cloud-based networks and 5G deployment. It faces challenges from limited infrastructure and high deployment costs, yet regional telecom operators invest in NFV to enhance service flexibility and efficiency. Enterprises across BFSI and government sectors adopt NFV to strengthen security and improve operational agility. The region demonstrates potential as cloud adoption accelerates and SMEs embrace cost-effective virtualization solutions. Future growth depends on expanding telecom infrastructure and regional collaborations for technology advancement.
Middle East & Africa
The Middle East & Africa contribute 7% of the Network Function Virtualization NFV Market share in 2024, reflecting gradual but promising adoption. Telecom operators in the UAE, Saudi Arabia, and South Africa lead regional NFV deployment, driven by investments in 5G and digital transformation projects. It is increasingly adopted in government modernization programs to improve efficiency and secure service delivery. Enterprises across financial services and IT adopt NFV to manage growing digital demands. Limited infrastructure and budgetary constraints remain key challenges, yet rising cloud adoption and smart city initiatives create new opportunities. The region is expected to expand steadily as governments and enterprises push for digitalization and connectivity improvements.
Key Player Analysis
- Riverbed Technology
- Juniper Networks
- Nokia Corporation
- BMC Software
- Huawei Technologies
- Check Point Software Technologies Ltd.
- Hewlett Packard Enterprise (HPE)
- IBM
- Cisco Systems
- Broadcom
Competitive Analysis
The Network Function Virtualization NFV Market players including Cisco Systems, Huawei Technologies, IBM, Broadcom, Hewlett Packard Enterprise (HPE), Check Point Software Technologies Ltd., Nokia Corporation, Riverbed Technology, Juniper Networks, and BMC Software. The Network Function Virtualization NFV Market remains highly competitive, driven by rapid technological advancements and increasing demand for flexible, cost-efficient networking solutions. Companies focus on expanding their portfolios with cloud-native platforms, AI-enabled orchestration, and automation to address diverse customer needs. Strategic collaborations with telecom operators, cloud providers, and enterprises strengthen market presence while ensuring interoperability across multi-vendor environments. Innovation in security virtualization, performance optimization, and hybrid deployment models plays a critical role in shaping competitive differentiation. The market continues to evolve around scalability, service agility, and reduced operational costs, pushing vendors to invest heavily in research, development, and ecosystem partnerships.Top of Form
Recent Developments
- In January 2025, HCLTech issued a white paper detailing OSS transformation blueprints that align NFV and SDN domains to improve cross-layer visibility and data accuracy.
- In August 2024, HPE Aruba introduced new behavioral analytics capabilities to enhance its network detection and response (NDR) platform, aimed at identifying and mitigating network threats, particularly from Internet of Things (IoT) devices. This development is part of a broader strategy to strengthen enterprise security through AI-driven solutions.
- In June 2023, Alcatel-Lucent Enterprise recently enhanced its network management capabilities with the release of OmniVista Cirrus 10, a cloud-based Software-as-a-Service (SaaS) solution designed to provide advanced management for network infrastructure.
- In February 2023, D-Link launched two versions of its new D-View 8 Network Management System, the Enterprise Edition (DV-800E) and the Standard Edition (DV-800S). These powerful software solutions are dedicated to comprehensive network management and provide high-precision network monitoring and traffic management.
Report Coverage
The research report offers an in-depth analysis based on Deployment, Organization Size, End-User and Geography. It details leading market players, providing an overview of their business, product offerings, investments, revenue streams, and key applications. Additionally, the report includes insights into the competitive environment, SWOT analysis, current market trends, as well as the primary drivers and constraints. Furthermore, it discusses various factors that have driven market expansion in recent years. The report also explores market dynamics, regulatory scenarios, and technological advancements that are shaping the industry. It assesses the impact of external factors and global economic changes on market growth. Lastly, it provides strategic recommendations for new entrants and established companies to navigate the complexities of the market.
Future Outlook
- The Network Function Virtualization NFV Market will expand with stronger integration of 5G and edge services.
- Cloud-native NFV adoption will grow as enterprises demand agility and faster service delivery.
- AI-driven orchestration will enhance automation, predictive maintenance, and resource optimization in NFV platforms.
- Multi-vendor interoperability will strengthen through open standards and collaborative frameworks.
- Security-focused NFV solutions will gain traction to address rising cyber threats in virtualized networks.
- Telecom operators will continue to invest in NFV to reduce costs and improve scalability.
- SMEs will adopt cloud-based NFV to gain enterprise-grade services at lower infrastructure costs.
- IoT growth will accelerate NFV demand to manage massive device connectivity and low-latency services.
- Governments will support NFV adoption through digital transformation initiatives and policy frameworks.
- The market will witness increasing partnerships between vendors and cloud providers to expand NFV ecosystems.
Request a Free Sample
Fill in your details and we'll send you a free sample report.
- Sample data tables & charts
- Research methodology
Need a Custom Version of This Report?
Tailor the scope, geography, or segments to your exact requirements.
- Custom geography or segment scope
- Direct access to our analyst team
Frequently Asked Questions
What is the projected growth of the NFV market?
What are the key drivers of NFV market growth?
Which regions are leading in NFV adoption?
What challenges does the NFV market face?
Table of Content
Chapter 1. Report Introduction
- 1.1 Report Description & Purpose
- 1.1.1 Report Title & Market Definition
- 1.1.2 Unique Selling Propositions (USP) & Key Differentiators
- 1.1.3 Value Proposition for Stakeholders
- 1.2 Research Objectives
- 1.2.1 Market Sizing Objectives (Volume & Revenue)
- 1.2.2 Segmentation Objectives
- 1.2.3 Competitive Intelligence Objectives
- 1.2.4 Forecast & Scenario Objectives
- 1.3 Report Scope
- 1.3.1 Network Function Virtualization Scope – Types & Subtypes Covered
- 1.3.2 Geographic Scope – Regions & Countries Covered
- 1.3.3 Historical Period, Base Year & Forecast Period (2024; forecast to 2032)
- 1.3.4 Inclusions & Exclusions
- 1.4 HS Code & Classification Framework
- 1.5 Currency, Units & Pricing Basis
- 1.6 Target Stakeholders
- 1.7 Limitations & Assumptions
Chapter 2. Executive Summary
- 2.1 Global Network Function Virtualization Market Snapshot
- 2.1.1 Market Size – Historical (2024) & Forecast (2024-2032) (2024: USD 35.04 billion → 2032: USD 129.15 billion)
- 2.1.2 Volume & Revenue – Global Totals
- 2.1.3 Key Market Highlights – Top Five Facts
- 2.2 Network Function Virtualization Market Segmentation Snapshot
- 2.2.1 Market Split by Region – 2024 vs. 2032
- 2.3 Competitive Snapshot
- 2.3.1 Top 10 Players by Revenue Share – 2024
- 2.3.2 Top 10 Players by Volume Share – 2024
- 2.3.3 Recent Strategic Developments (18-Month Summary)
- 2.4 Key Investment Highlights & Strategic Conclusions
Chapter 3. Network Function Virtualization Market Dynamics & Industry Analysis
- 3.1 Market Overview & Context
- 3.1.1 Network Function Virtualization Market Position in the Broader Automotive Value Chain
- 3.1.2 OEM vs. Replacement Market Dynamics
- 3.1.3 Market Maturity & Development Stage by Region
- 3.2 Network Function Virtualization Market Drivers
- 3.3 Network Function Virtualization Market Restraints & Challenges
- 3.4 Network Function Virtualization Market Opportunities
- 3.5 Porter's Five Forces Analysis
- 3.5.1 Threat of New Entrants
- 3.5.2 Bargaining Power of Suppliers
- 3.5.3 Bargaining Power of Buyers
- 3.5.4 Threat of Substitutes
- 3.5.5 Competitive Rivalry – Intensity Assessment
- 3.6 Network Function Virtualization Value Chain Analysis
- 3.6.1 Upstream – Raw Material/Input Suppliers
- 3.6.1.1 Raw Material/Input 1
- 3.6.1.2 Raw Material/Input 2
- 3.6.1.3 Raw Material/Input 3
- 3.6.2 Midstream – Production/Manufacturing/Service Delivery
- 3.6.2.1 Production/Process Overview
- 3.6.2.2 Key Facility Locations & Capacity by Manufacturer
- 3.6.3 Downstream – Distribution & End Consumer
- 3.6.3.1 Primary Channel – B2B/OEM
- 3.6.3.2 Secondary Channels – Dealer, Retail, Online, Direct
- 3.6.4 Value Chain Profitability Analysis
- 3.6.1 Upstream – Raw Material/Input Suppliers
- 3.7 PESTEL Analysis
- 3.7.1 Political Factors
- 3.7.2 Economic Factors
- 3.7.3 Social Factors
- 3.7.4 Technological Factors
- 3.7.5 Environmental Factors
- 3.7.6 Legal Factors
- 3.8 Network Function Virtualization Supply Chain Analysis
- 3.8.1 Raw Material/Input Supply Risk Assessment
- 3.8.2 Manufacturing Concentration Risk (Geographic Exposure)
- 3.8.3 Trade Disruption Impact Analysis
- 3.9 Regulatory & Policy Landscape
Note: The regulatory and policy landscape section covers regulations based on their applicability to the market, Network Function Virtualization category, geography, and scope of the study. Only regulatory frameworks with a material impact on operations, compliance, trade, sustainability, or market access are analyzed in detail.
Chapter 4. Key Investment Pockets & Opportunity Analysis
- 4.1 Network Function Virtualization Market Attractiveness Analysis
- 4.1.1 By Region – Investment Attractiveness Matrix (Volume × CAGR)
- 4.2 Absolute Revenue Growth Opportunity
- 4.2.1 By Region – Absolute USD Growth Through 2032
- 4.3 Incremental Volume Opportunity
- 4.3.1 By Region – Incremental Volume Through 2032
- 4.3.2 Segment – Incremental Volume
- 4.4 Emerging Submarket Opportunity Deep Dive (Subject to Applicability)
- 4.5 Emerging Market Opportunity Scorecards
- 4.5.1 United States
- 4.5.2 Europe
- 4.5.3 Asia
- 4.5.4 Middle East & Africa
Note: Emerging Market Opportunity Scorecards will be included based on relevance and strategic importance. Regions listed are indicative and may vary depending on data availability and market dynamics.
Chapter 5. Network Function Virtualization Import-Export Analysis & Trade Flows
- 5.1 Global Trade Overview
- 5.1.1 Global Export Value by Country (2024)
- 5.1.2 Global Export Volume by Country (2024)
- 5.1.3 Global Import Value by Country (2024)
- 5.1.4 Global Import Volume by Country (2024)
- 5.1.5 Net Trade Balance by Country (2024)
- 5.2 Export Analysis – Segment
- 5.2.1 Type 1 (HS Code)
- 5.2.2 Type 2 (HS Code)
- 5.2.3 Type 3 (HS Code)
- 5.2.4 Type 4 (HS Code)
- 5.2.5 Type 5 (HS Code)
- 5.3 Import Analysis – Segment
- 5.3.1 Type 1 (HS Code)
- 5.3.2 Type 2 (HS Code)
- 5.3.3 Type 3 (HS Code)
- 5.3.4 Type 4 (HS Code)
- 5.3.5 Type 5 (HS Code)
- 5.4 Average Unit Trade Prices
- 5.4.1 Average Export Price – Segment & Country
- 5.4.2 Average Import Price – Segment & Source Country
- 5.4.3 Price Trends (2024)
- 5.5 Key Trade Route Analysis
- 5.5.1 Trade Route 1
- 5.5.2 Trade Route 2
- 5.5.3 Trade Route 3
- 5.5.4 Trade Route 4
- 5.5.5 Trade Route 5
- 5.6 Trade Policy Impact Assessment
- 5.6.1 US Anti-Dumping & Section 301 Tariffs
- 5.6.2 EU Customs Union Impact
- 5.6.3 Major Free Trade Agreements
- 5.6.4 USMCA Rules of Origin
Note: Trade policy analysis will be included only where relevant to the Network Function Virtualization market.
Chapter 6. Competitive Landscape & Company Benchmarking
- 6.1 Network Function Virtualization Market Concentration & Structure
- 6.1.1 Herfindahl-Hirschman Index (HHI) – vs. 2024
- 6.1.2 Tier 1, Tier 2 & Tier 3 Market Structure
- 6.1.3 Global, Regional & Local Player Dynamics
- 6.2 Network Function Virtualization Market Share Analysis – 2024
- 6.2.1 Global Revenue Share by Company
- 6.2.2 Global Volume Share by Company
- 6.2.3 Regional Revenue Share
- 6.2.4 Market Share Evolution ( vs. 2024)
- 6.2.5 OEM Segment Share by Company
- 6.2.6 Replacement Segment Share by Company
- 6.3 Production/Delivery Capacity & Facility Analysis
- 6.3.1 Global Installed Capacity
- 6.3.2 Capacity Utilization Rates
- 6.3.3 Production/Output Volume
- 6.3.4 Facility Locations & Capacity Map
- 6.3.5 Planned Capacity Additions
- 6.4 Network Function Virtualization Competitive Benchmarking Matrix
- 6.4.1 Revenue, Volume, CAGR & Profitability Comparison
- 6.4.2 Channel Revenue Mix
- 6.4.3 Geographic Revenue Exposure
- 6.4.4 R&D Intensity
- 6.4.5 Sustainability Maturity
- 6.5 Strategic Developments in Network Function Virtualization (Last 24 Months)
- 6.5.1 Mergers, Acquisitions & Divestments
- 6.5.2 New Network Function Virtualization Launches
- 6.5.3 Facility Expansions
- 6.5.4 Strategic Alliances, Joint Ventures & Partnerships
- 6.5.5 Distribution Expansion & Market Entry
- 6.5.6 Sustainability & ESG Initiatives
- 6.6 Competitive Strategy Mapping
- 6.6.1 Leader, Challenger, Follower & Niche Classification
- 6.6.2 Pricing Strategy Comparison
- 6.6.3 Channel Strategy Matrix
Note: Strategic developments are included based on their materiality and the availability of reliable information.
Chapter 7. Global Network Function Virtualization Market – By Distribution Channel
- 7.1 Segment Overview
- 7.1.1 Volume & Revenue Split by Channel (2024 & 2032)
- 7.1.2 Channel Mix Evolution (2024-2032)
Chapter 8. Regional Market Analysis – Global Overview
- 8.1 Global Regional Overview
- 8.1.1 Regional Volume Share
- 8.1.2 Regional Revenue Share
- 8.1.3 Regional Volume by Region
- 8.1.4 Regional Revenue by Region
- 8.1.5 Regional Forecast Through 2032
- 8.2 Cross-Regional Segment Analysis
- 8.2.1 By Distribution Channel
- 8.2.2 By Brand/Price Tier
Chapter 9. North America Network Function Virtualization Market
- 9.1 United States
- 9.2 Canada
- 9.3 Mexico
Chapter 10. Europe Network Function Virtualization Market
- 10.1 Germany
- 10.2 France
- 10.3 Italy
- 10.4 United Kingdom
- 10.5 Spain
- 10.6 Poland
- 10.7 Russia
- 10.8 Netherlands
- 10.9 Belgium
- 10.10 Sweden
- 10.11 Denmark
- 10.12 Norway
- 10.13 Rest of Europe
Chapter 11. Asia Pacific Network Function Virtualization Market
- 11.1 China
- 11.2 India
- 11.3 Japan
- 11.4 South Korea
- 11.5 Thailand
- 11.6 Indonesia
- 11.7 Vietnam
- 11.8 Malaysia
- 11.9 Australia
- 11.10 Rest of Asia Pacific
Chapter 12. Latin America Network Function Virtualization Market
- 12.1 Brazil
- 12.2 Argentina
- 12.3 Colombia
- 12.4 Chile
- 12.5 Rest of Latin America
Chapter 13. Middle East Network Function Virtualization Market
- 13.1 Saudi Arabia
- 13.2 United Arab Emirates
- 13.3 Turkey
- 13.4 Israel
- 13.5 Iran
- 13.6 Rest of the Middle East
Chapter 14. Africa Network Function Virtualization Market
- 14.1 South Africa
- 14.2 Egypt
- 14.3 Nigeria
- 14.4 Morocco
- 14.5 Rest of Africa
Chapter 15. Network Function Virtualization Company Profiles
- 15.1 [Company 01]
- 15.1.1 Company Overview
- 15.1.2 Key Management Personnel
- 15.1.3 Products & Services Portfolio
- 15.1.4 Financial Performance
- 15.1.5 Key Market Focus & Geographic Presence
- 15.1.6 Recent Developments & Strategic Initiatives
Note: The company profile list is preliminary and may change based on research findings, market developments, data availability, and client requirements.
Chapter 16. Appendices
- Appendix A – List of Abbreviations & Acronyms
- Appendix B – Industry Classification Code Reference – Full Series
- Appendix C – Production & Capacity Data Tables
- Appendix D – End-Use & Demand Base Tables
- Appendix E – Consumption & Replacement Rate Assumptions
- Appendix F – ASP Reference Tables
- Appendix G – Manufacturing & Facility Database
- Appendix H – Import-Export Data Tables
- Appendix I – Regulatory Summary Tables
- Appendix J – Primary Research Participant List (Anonymized)
- Appendix K – Primary Research Questionnaire Framework
- Appendix L – Data Sources & Bibliography
- Appendix M – Market Size Divergence & Source Comparison
Chapter 17. Research Methodology
- 17.1 Research Framework & Philosophy
- 17.2 Secondary Research – Sources, Hierarchy & Data Extraction
- 17.3 Data Modeling – Bottom-Up & Top-Down Market Sizing
- 17.4 Primary Research – Stakeholder Framework, LOI & Sample Sizes
- 17.5 Forecast Methodology – Regression, Scenario & Sensitivity Analysis
- 17.6 Quality Control – Four-Layer Validation Framework
- 17.7 Limitations & Standard Assumptions
- 17.8 Disclaimer
