Market Overview
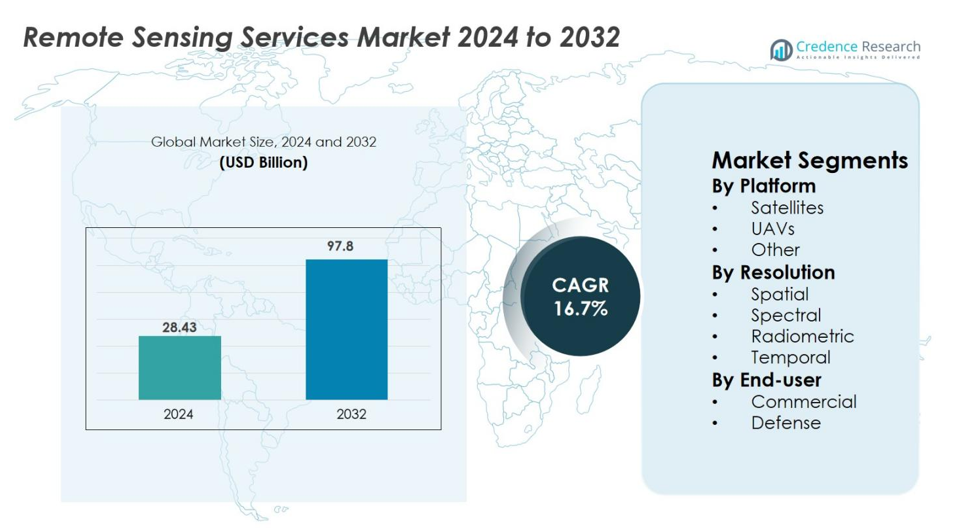
Remote Sensing Services Market size was valued at USD 28.43 Billion in 2024 and is anticipated to reach USD 97.8 Billion by 2032, at a CAGR of 16.7% during the forecast period.
| REPORT ATTRIBUTE |
DETAILS |
| Historical Period |
2020-2023 |
| Base Year |
2024 |
| Forecast Period |
2025-2032 |
| Remote Sensing Services Market Size 2024 |
USD 28.43 Billion |
| Remote Sensing Services Market, CAGR |
16.7% |
| Remote Sensing Services Market Size 2032 |
USD 97.8 Billion |
Remote Sensing Services market is characterized by strong participation from leading companies such as Maxar Technologies, Planet Labs, Airbus, DigitalGlobe, Antrix Corporation, Remote Sensing Solutions, Satellite Imaging Corporation, EKOFASTBA, Geo Sense, and Mallon Technology. These players enhance market growth through high-resolution satellite imagery, UAV-based data acquisition, and advanced geospatial analytics. North America leads the global market with a 36.8% share in 2024, supported by extensive adoption across defense, agriculture, and environmental monitoring. Europe follows with 27.5% driven by climate initiatives and smart infrastructure projects, while Asia-Pacific holds 24.3% due to strong investment in satellite programs and precision agriculture.
Market Insights
- Remote Sensing Services market was valued at USD 28.43 Billion in 2024 and is projected to reach USD 97.8 Billion by 2032, growing at a CAGR of 16.7%.
- Market growth is driven by rising adoption across agriculture, defense, energy, and environmental monitoring, supported by increasing demand for high-resolution imagery, UAV-based data collection, and AI-enabled geospatial analytics.
- Key trends include rapid expansion of low-earth-orbit satellite constellations, multi-sensor integration, and growing use of hyperspectral, LiDAR, and SAR technologies for advanced mapping and predictive insights.
- The market features strong participation from Maxar Technologies, Planet Labs, Airbus, DigitalGlobe, Antrix Corporation, Remote Sensing Solutions, Satellite Imaging Corporation, EKOFASTBA, Geo Sense, and Mallon Technology, all expanding capabilities through innovation and strategic partnerships.
- North America leads with 36.8% share, followed by Europe with 27.5% and Asia-Pacific with 24.3%; by platform, satellites dominate with 62.4% share, while spatial resolution leads the resolution segment with 48.7% share.
Access crucial information at unmatched prices!
Request your sample report today & start making informed decisions powered by Credence Research Inc.!
Download Sample
Market Segmentation Analysis
By Platform
The Remote Sensing Services market is led by the Satellites segment, which accounted for 62.4% share in 2024, driven by its extensive coverage, high-resolution imaging capabilities, and suitability for large-scale environmental, agricultural, and defense applications. Satellites enable continuous monitoring and long-term data collection, supporting climate analysis, resource mapping, and disaster management. UAVs follow with rapid growth due to their flexibility, low operational costs, and suitability for localized, high-frequency data capture. The “Other” category, including manned aircraft and ground-based systems, serves niche applications requiring specialized sensors and high-precision mapping.
- For instance, Planet’s Dove satellites capture imagery at 3–5-meter resolution, enabling daily monitoring of forests and croplands across multiple countries.
By Resolution
The Spatial Resolution segment dominated the Remote Sensing Services market with a 48.7% share in 2024, supported by rising demand for detailed imagery in urban planning, precision farming, and infrastructure monitoring. High-spatial-resolution data enables accurate mapping, land-use classification, and asset inspection, making it essential for commercial and governmental users. Spectral Resolution is growing steadily as multi- and hyperspectral sensors help analyze crop health, mineral composition, and environmental changes. Radiometric and Temporal resolutions also contribute significantly by enhancing image clarity, change detection accuracy, and monitoring frequency across dynamic landscapes.
- For instance, Maxar’s WorldView-3 delivers 31-cm panchromatic imagery, which city authorities use for road-network updates and building footprint extraction.
By End-user
The Commercial segment held the leading position in the Remote Sensing Services market with a 57.9% share in 2024, propelled by expanding adoption across agriculture, energy, mining, construction, and environmental monitoring. Businesses increasingly rely on remote sensing for operational optimization, risk assessment, and real-time decision-making, supported by technological advances and falling sensor costs. The Defense segment remains crucial, leveraging remote sensing for surveillance, border security, reconnaissance, and mission planning. Growing investments in high-resolution imaging, radar-based sensing, and geospatial analytics continue to strengthen demand across both commercial and defense applications.
Key Growth Drivers
Expanding Applications Across Commercial and Government Sectors
The Remote Sensing Services market is experiencing strong growth as commercial and government sectors increasingly utilize high-resolution geospatial data for critical decision-making. Industries such as agriculture, energy, construction, mining, and environmental management depend on satellite and UAV-based imagery to improve operational efficiency, monitor assets, and reduce risks. Governments use remote sensing for land-use planning, infrastructure development, climate modeling, and disaster management. The ability to collect large-scale, real-time, and historical data enhances forecasting accuracy and resource allocation. Additionally, sustainability mandates and climate action programs drive wider adoption of remote sensing to track deforestation, emissions, and natural resource depletion. As geospatial intelligence becomes essential for modernization efforts and digital transformation, demand from both public and private sectors accelerates, reinforcing remote sensing as a strategic tool for advanced analytics and long-term planning.
- For instance, the European Space Agency’s Sentinel-2 imagery is actively used in the Copernicus Land Monitoring Service to support land-use planning, vegetation analysis, and infrastructure development.
Accelerating Demand for Precision Agriculture and Environmental Monitoring
Precision agriculture has become a major growth catalyst for the Remote Sensing Services market, driven by rising pressure to increase food productivity, optimize resource usage, and manage climate-related risks. Remote sensing enables farmers to assess crop health, monitor soil moisture, detect pest infestations, and forecast yields with greater accuracy. High-resolution imagery combined with multispectral and hyperspectral data improves precision farming decisions, helping reduce input costs and enhance sustainability. Additionally, increasing environmental concerns such as deforestation, droughts, pollution, and biodiversity loss are prompting governments and global agencies to invest in remote-sensing-based monitoring systems. These systems support early-warning alerts, restoration planning, and regulatory compliance. As climate change intensifies, the need for continuous environmental surveillance strengthens the market’s outlook, pushing organizations to adopt more sophisticated remote sensing tools to support sustainable land and water management.
- For instance, John Deere’s Operations Center integrates satellite and drone imagery to guide variable-rate fertilization and irrigation decisions, improving field-level efficiency.
Technological Advancements in Sensors, AI, and Data Processing
Technological innovation plays a central role in expanding the Remote Sensing Services market. Advancements in sensor technology including hyperspectral, LiDAR, SAR, and thermal imaging are significantly improving the accuracy and scope of remote sensing applications. These sensors enable round-the-clock monitoring, cloud penetration, and detection of subtle environmental and structural changes. AI and machine learning further enhance the value of remote sensing by automating image classification, anomaly detection, and predictive modeling. Faster data processing through cloud platforms allows near-real-time analytics, making remote sensing highly valuable for disaster response, infrastructure assessment, and mission-critical operations. Miniaturization of sensors and the declining cost of UAV platforms also increase accessibility, enabling smaller enterprises to adopt remote-sensing solutions. Together, these advancements improve data quality, reduce processing time, and expand new use cases, strengthening overall market adoption.
Key Trends & Opportunities
Rising Adoption of AI-Driven Geospatial Analytics
AI-driven geospatial analytics is reshaping the Remote Sensing Services market by enabling faster, more accurate interpretation of massive datasets. Machine learning models enhance land-use classification, environmental forecasting, terrain mapping, and automated object detection. Industries such as agriculture, defense, energy, and urban planning increasingly deploy AI-powered platforms to derive actionable insights and improve predictive decision-making. Data fusion combining satellite, UAV, IoT, and terrestrial data provides a multidimensional understanding of landscapes and assets. Cloud-based geospatial intelligence platforms support scalable processing and collaborative workflows. As AI capabilities advance, new opportunities emerge in real-time monitoring, automated reporting, digital twins, and early-warning systems, making remote sensing indispensable for complex, data-driven operations.
- For instance, Google’s Earth Engine integrates AI algorithms to classify land cover and detect environmental changes using petabyte-scale satellite archives, supporting global conservation and planning initiatives.
Expansion of Low-Earth-Orbit (LEO) Constellations and UAV Ecosystems
The expansion of LEO satellite constellations and the rapid growth of UAV ecosystems are creating transformative opportunities in the Remote Sensing Services market. LEO satellites offer faster image updates, improved resolution, and higher revisit frequencies, enabling continuous monitoring of land, oceans, weather systems, and security environments. Companies deploying small-satellite networks are making remote sensing more affordable and accessible. Meanwhile, UAV adoption is accelerating due to regulatory support, enhanced battery efficiency, and advanced sensor payloads. UAVs deliver ultra-localized, high-frequency data ideal for precision agriculture, infrastructure inspection, disaster assessment, and urban development. Together, LEO constellations and UAVs create a hybrid sensing model that combines global coverage with precision-level intelligence, opening new commercial and scientific applications.
- For instance, the ICEYE SAR constellation offers multiple daily revisits, enabling flood mapping, vessel tracking, and natural disaster assessment through all-weather imaging. UAV adoption is also accelerating with regulatory advancements and improved sensor payloads
Key Challenges
High Operational Costs and Data Management Complexity
High operational costs and the complexity of managing massive datasets remain significant barriers in the Remote Sensing Services market. Satellite development, launch operations, and maintenance require substantial capital investment, limiting competition and slowing market entry, especially in developing economies. UAV operations also involve costs for advanced sensors, skilled pilots, regulatory compliance, and ongoing maintenance. Additionally, the vast volume of data generated by modern sensors demands sophisticated cloud infrastructure, robust cybersecurity, and advanced processing capabilities. Organizations face challenges in integrating multi-source datasets, validating accuracy, and achieving real-time insights. These financial and operational constraints often hinder scalability and slow adoption across sectors with limited digital infrastructure.
Regulatory Restrictions, Privacy Concerns, and Lack of Standardization
Regulatory complexities pose a substantial challenge to the Remote Sensing Services market. Many countries enforce strict rules on aerial imaging, satellite data resolution, cross-border data transfers, and UAV flight operations, often limiting data availability and operational flexibility. Privacy concerns further complicate the landscape, especially in high-resolution imaging of populated areas and sensitive sites. Additionally, the absence of universal standards for geospatial data formatting, radiometric calibration, and quality assessment makes interoperability difficult across platforms and regions. These regulatory and standardization gaps restrict international collaborations, delay project approvals, and create uncertainties for commercial operators. Evolving compliance norms and data governance policies continue to influence how remote sensing technologies are deployed globally.
Regional Analysis
North America
North America dominated the Remote Sensing Services market with a 36.8% share in 2024, driven by strong investments in satellite technologies, defense surveillance systems, and advanced geospatial analytics. The United States leads demand due to extensive adoption across agriculture, energy, environmental monitoring, and emergency response applications. Growing use of UAVs for precision mapping, infrastructure inspection, and climate resilience initiatives further strengthens market expansion. Government programs supporting Earth observation, combined with a mature ecosystem of service providers and technology innovators, continue to position North America as the leading hub for remote sensing advancements and commercial deployment.
Europe
Europe accounted for a 27.5% share of the Remote Sensing Services market in 2024, supported by extensive environmental monitoring programs, smart city development, and defense modernization efforts. The region benefits from strong government-backed initiatives such as Copernicus, which accelerates access to high-quality Earth observation data for climate research, agriculture, and disaster response. Countries including Germany, France, and the U.K. increasingly utilize remote sensing for energy grid management, urban planning, and biodiversity assessment. The adoption of UAV-based services continues to rise, driven by supportive regulations and industrial automation, reinforcing Europe’s position as a key market for geospatial intelligence solutions.
Asia-Pacific
Asia-Pacific captured a 24.3% share in the Remote Sensing Services market in 2024, emerging as the fastest-growing region due to rapid urbanization, expanding agricultural activities, and increasing investments in satellite infrastructure. China, India, Japan, and South Korea lead demand with extensive programs for environmental monitoring, smart infrastructure, and defense applications. The region’s large agricultural base drives significant adoption of UAV and satellite imagery for precision farming. Governments are prioritizing climate resilience, disaster management, and water-resource monitoring, further accelerating market growth. Rising private-sector participation and expanding small-satellite missions strengthen Asia-Pacific’s long-term remote sensing capabilities.
Latin America
Latin America held a 6.1% share of the Remote Sensing Services market in 2024, driven by rising demand for environmental monitoring, agriculture optimization, and natural resource management. Countries such as Brazil, Mexico, and Chile increasingly deploy remote sensing solutions for deforestation tracking, wildfire detection, mining operations, and water management. Expanding use of UAVs and multispectral imaging supports precision farming in large agricultural economies. Government-led sustainability initiatives and international collaborations for climate monitoring continue to enhance adoption. While infrastructure limitations persist, growing digitalization and increased access to satellite data are gradually strengthening the region’s role in the global market.
Middle East & Africa
Middle East & Africa accounted for a 5.3% share of the Remote Sensing Services market in 2024, supported by rising applications in oil & gas monitoring, water-resource management, agriculture, and defense surveillance. Countries in the Gulf region utilize remote sensing for infrastructure planning, climate adaptation, and environmental assessment, while African nations adopt satellite imagery for drought monitoring, crop forecasting, and wildlife conservation. Investments in UAV technologies and international Earth observation partnerships are expanding regional capabilities. Although adoption varies by country, growing emphasis on sustainability, security, and resource optimization continues to drive the need for advanced remote sensing services.
Shape Your Report to Specific Countries or Regions & Enjoy 30% Off!
Market Segmentations
By Platform
By Resolution
- Spatial
- Spectral
- Radiometric
- Temporal
By End-user
By Geography
- North America
- Europe
- Germany
- France
- U.K.
- Italy
- Spain
- Rest of Europe
- Asia Pacific
- China
- Japan
- India
- South Korea
- South-east Asia
- Rest of Asia Pacific
- Latin America
- Brazil
- Argentina
- Rest of Latin America
- Middle East & Africa
- GCC Countries
- South Africa
- Rest of the Middle East and Africa
Competitive Landscape
The Remote Sensing Services market features a diverse and expanding competitive landscape, shaped by global satellite operators, geospatial intelligence companies, UAV service providers, and analytics firms. Leading players such as Maxar Technologies, Planet Labs, Airbus, DigitalGlobe, Antrix Corporation, Remote Sensing Solutions, Satellite Imaging Corporation, EKOFASTBA, Geo Sense, and Mallon Technology drive market growth through high-resolution imaging, multi-sensor data offerings, and advanced analytics platforms. These companies focus on expanding satellite constellations, improving revisit rates, and integrating AI-based processing tools to deliver faster and more accurate insights. Partnerships with government agencies, defense organizations, and commercial enterprises remain central to strengthening service portfolios and global coverage. Increasing competition is also fueled by the rise of small-satellite operators, cloud-based geospatial platforms, and UAV-based service providers offering localized, cost-effective data acquisition. As demand grows across agriculture, energy, environment, and security sectors, companies continuously invest in innovation, sensor upgrades, and strategic collaborations to maintain market leadership and expand global presence.
Key Player Analysis
Recent Developments
- In October 2025, ICEYE and IHI Corporation signed an agreement to build an Earth-observation satellite constellation, expanding future SAR-based remote sensing capabilities.
- In August 2025, Neo Space Group (NSG) launched Saudi Arabia’s first Earth-Observation marketplace platform leveraging the recently acquired UP42 platform to deliver cloud-based EO data access and analytics.
- In July 2025, Neo Space Group (NSG) completed the acquisition of UP42 (from Airbus Defence and Space), integrating UP42’s Earth-Observation / geospatial services into NSG.
Report Coverage
The research report offers an in-depth analysis based on Platform, Resolution, End-User and Geography. It details leading market players, providing an overview of their business, product offerings, investments, revenue streams, and key applications. Additionally, the report includes insights into the competitive environment, SWOT analysis, current market trends, as well as the primary drivers and constraints. Furthermore, it discusses various factors that have driven market expansion in recent years. The report also explores market dynamics, regulatory scenarios, and technological advancements that are shaping the industry. It assesses the impact of external factors and global economic changes on market growth. Lastly, it provides strategic recommendations for new entrants and established companies to navigate the complexities of the market.
Future Outlook
- The market will experience sustained growth as demand for real-time, high-resolution geospatial intelligence increases across commercial and government sectors.
- Advancements in satellite miniaturization and low-earth-orbit constellations will significantly improve revisit rates and global coverage.
- UAV-based remote sensing will expand rapidly due to lower operational costs and rising adoption in agriculture, infrastructure, and disaster management.
- AI-driven analytics will play a central role in automating image processing, anomaly detection, and predictive modeling.
- Integration of multisensor technologies such as hyperspectral, LiDAR, and SAR will support advanced environmental and industrial applications.
- Climate resilience initiatives will drive higher usage of remote sensing for monitoring deforestation, water scarcity, pollution, and natural hazards.
- Defense and security agencies will increasingly invest in high-precision geospatial intelligence for surveillance and mission planning.
- Cloud-based geospatial platforms will grow as organizations seek scalable, collaborative, and faster data processing solutions.
- Private-sector participation in satellite launches and data services will intensify competition and innovation.
- Emerging economies will accelerate adoption as digital infrastructure, regulatory frameworks, and investment in Earth observation technologies strengthen.


