
Flight hardware and device traces drive printed RF demand
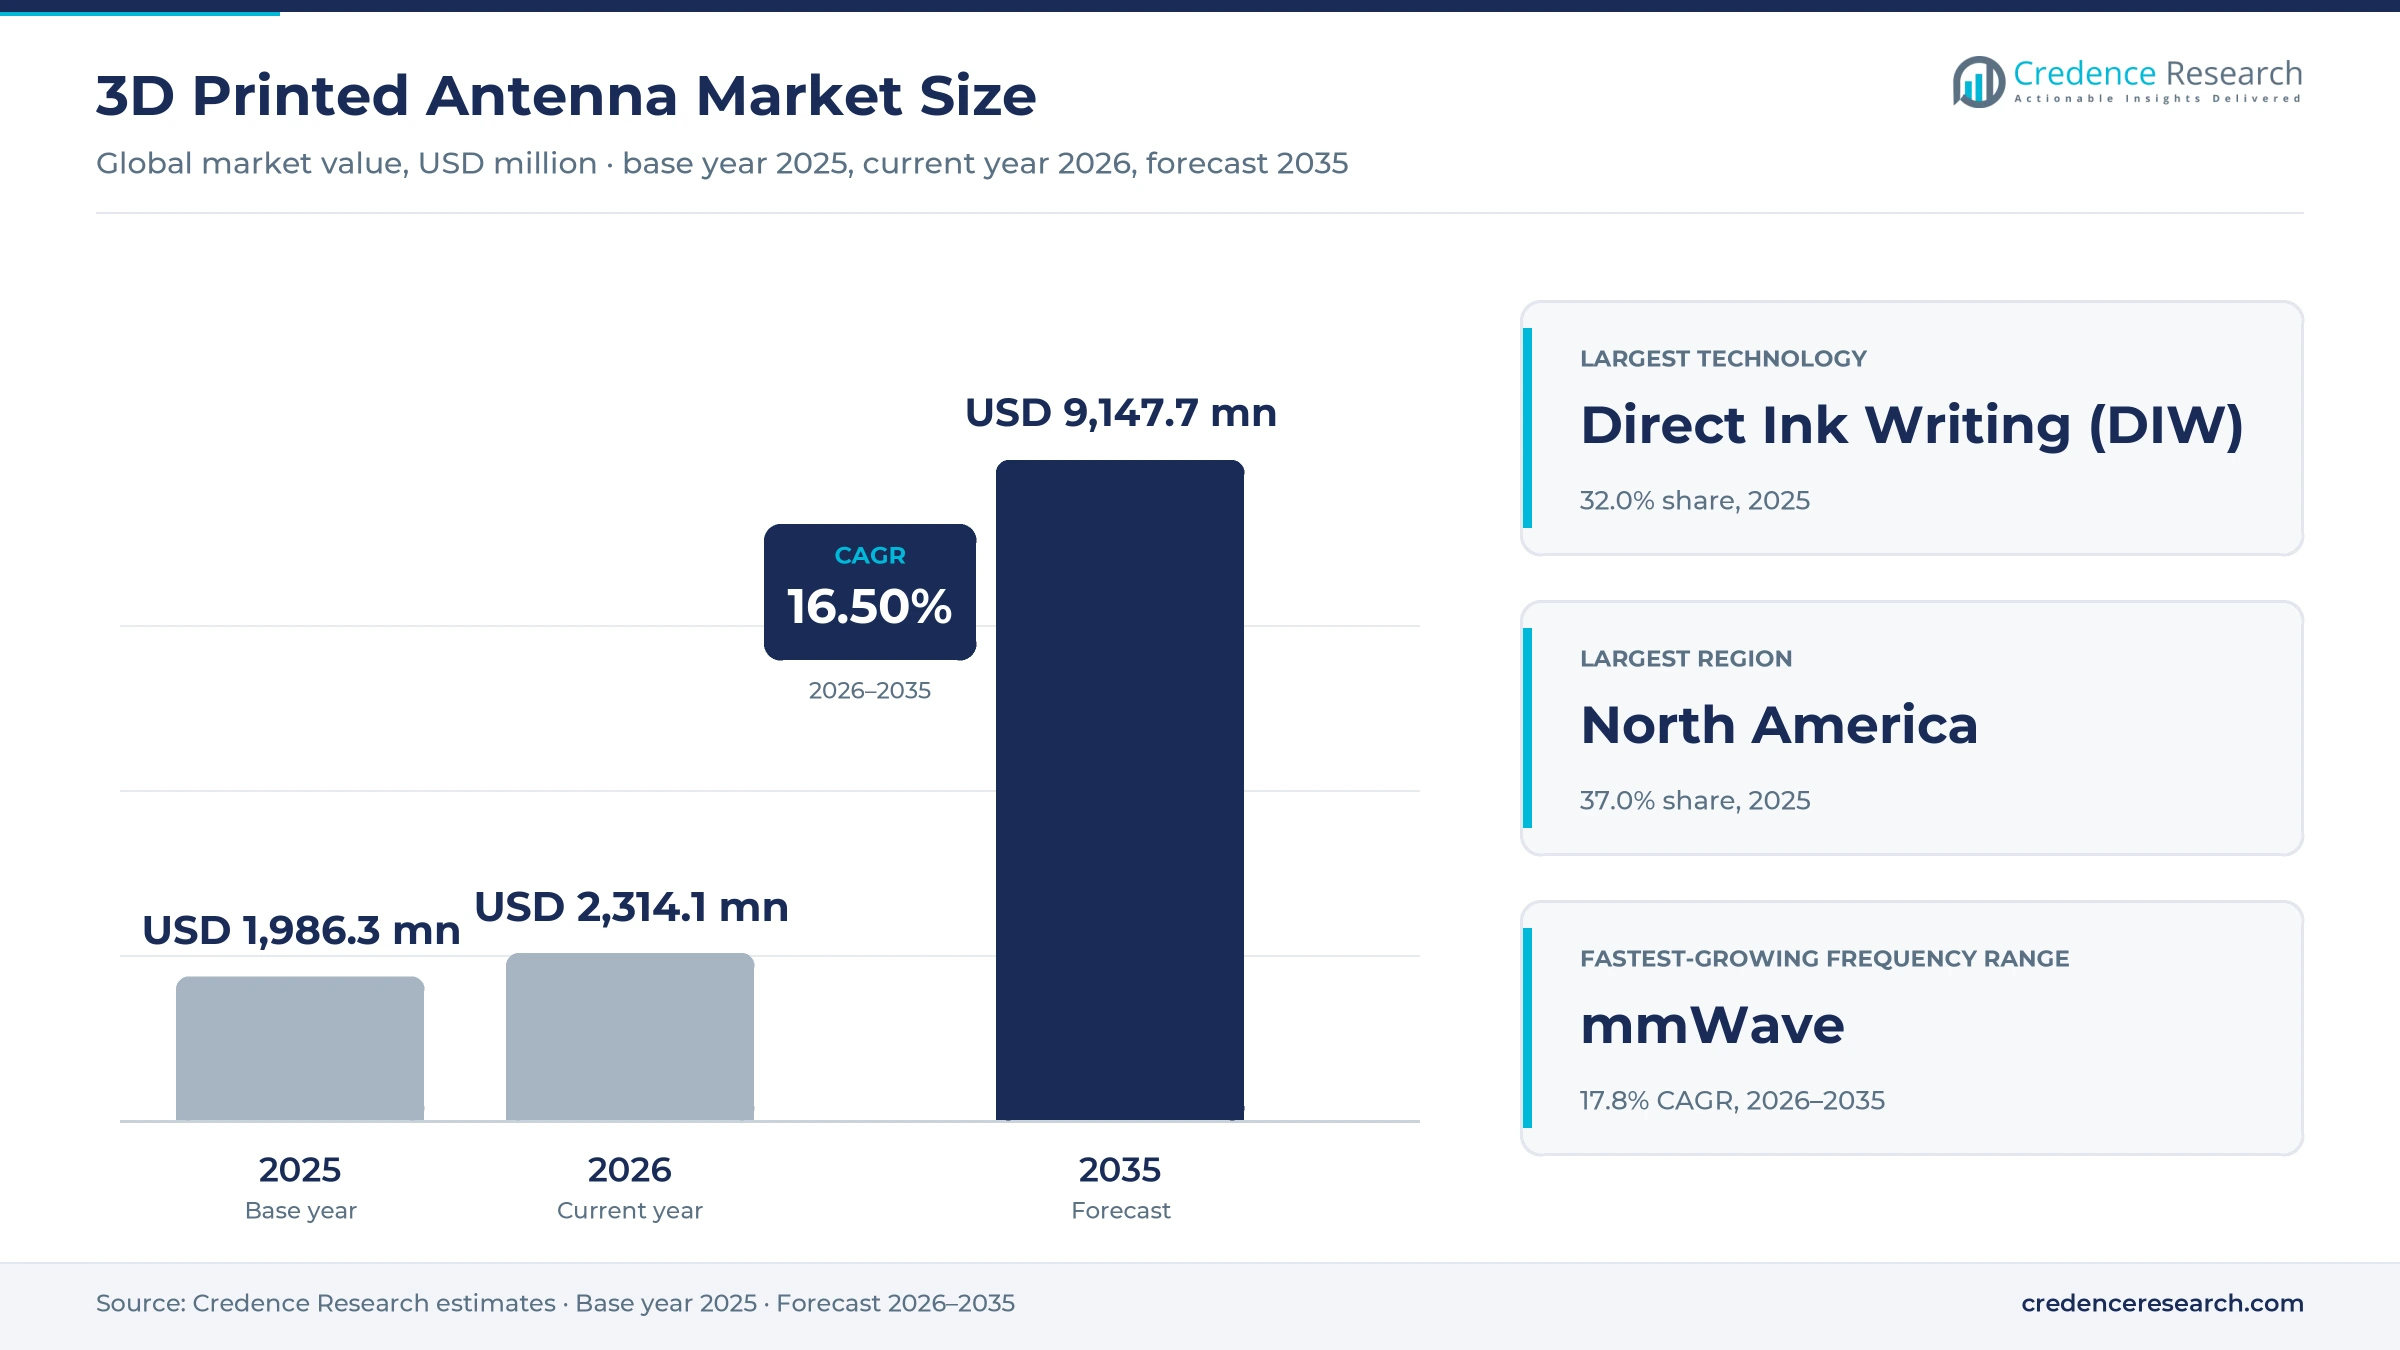
The global 3D printed antenna market was valued at USD 1.99 billion in 2025 and is projected to increase from USD 2.31 billion in 2026 to USD 9.15 billion by 2035, registering a CAGR of 16.50% during 2026–2035. Demand comes from satellite builders, defense electronics primes, telecom equipment makers and device brands that need RF parts with fewer joints, lower mass or shapes that machining cannot reach. North America held the largest regional share, 37.0% in 2025, because GPS, missile and military satellite programs buy flight-qualified printed hardware. Asia Pacific is the fastest-growing region at 17.4% a year, as Japanese and Korean defense programs place orders and Chinese plants assemble most of the world's handsets. The main commercial change is the move from qualification units to series production, with printed RF chains now flying on commercial and military satellites. Long flight qualification cycles and dielectric losses at higher frequencies remain the main restraints on wider use.
Which printed RF hardware does the estimate count?
The estimate counts antennas and antenna RF hardware whose radiating, guiding or lensing structure is built by an additive process, including metal horns and feed chains, phased-array elements, dielectric lenses and conductive antenna traces written directly onto molded parts. It values them at the price the antenna maker receives, or at transfer value when a satellite or defense prime prints them in-house.
Printers, metal powders, resins and inks sold on their own sit outside the estimate, although they make up the upstream supply chain. Space and defense buyers mostly purchase qualified flight units under program contracts, while device brands buy printed antenna traces from contract manufacturers as part of a housing or module.
3D Printed Antenna Market Insights
- The market is valued at USD 1.99 billion in 2025 and should reach USD 9.15 billion by 2035, growing at a 16.50% CAGR as printed RF parts enter series production.
- North America led with 37.0% of 2025 value, supported by GPS, missile defense and military satellite programs that buy flight-qualified printed hardware.
- Direct Ink Writing (DIW) held 32.0% of 2025 value, because conductive traces written onto housings ship in device volumes rather than in satellite volumes.
- The final GPS III satellite reached orbit in April 2026 with a printed omni antenna, the U.S. Space Force said, a sign that printed RF parts now fly on military constellations.
- SWISSto12 reported more than USD 500 million in contracted orders in July 2026, the clearest public backlog among specialist suppliers of printed RF hardware.
Direct-written traces lead while laser-sintered metal gains
Why do direct-written traces lead while laser-sintered metal grows fastest?
Based on technology, the market is categorized into fused deposition modeling, stereolithography, selective laser sintering, electron beam melting and direct ink writing. Direct Ink Writing (DIW) led with 32.0% of 2025 value, because traces written onto housings follow handset and IoT module volumes rather than satellite builds, although public data on these lines are scarce, so this share is a Credence Research estimate with a wide error range. Selective Laser Sintering (SLS) grows fastest at 17.6% a year as satellite makers print RF networks in aluminum, with Airbus building 500 such parts for two Eutelsat satellites. The estimate places laser powder bed fusion of metals in this group.
Why does sub-6 GHz lead while millimeter-wave bands grow fastest?
Based on frequency range, the market is categorized into sub-6 GHz, mmWave and other frequency ranges. Sub-6 GHz held 46.0% of 2025 value, because mid-band 5G, navigation and IoT links set most device and network antenna designs, and Ericsson reported mid-band 5G population coverage above 90% in North America and 95% in India at the end of 2024. mmWave grows fastest at 17.8% a year as Ka-band terminals scale, with SES selecting SWISSto12 in March 2025 to build electronically steered terminal arrays for its O3b mPOWER constellation. Printed parts gain most at these bands, where tolerances are tight.
Why does IT and telecom lead while aerospace and defense grows fastest?
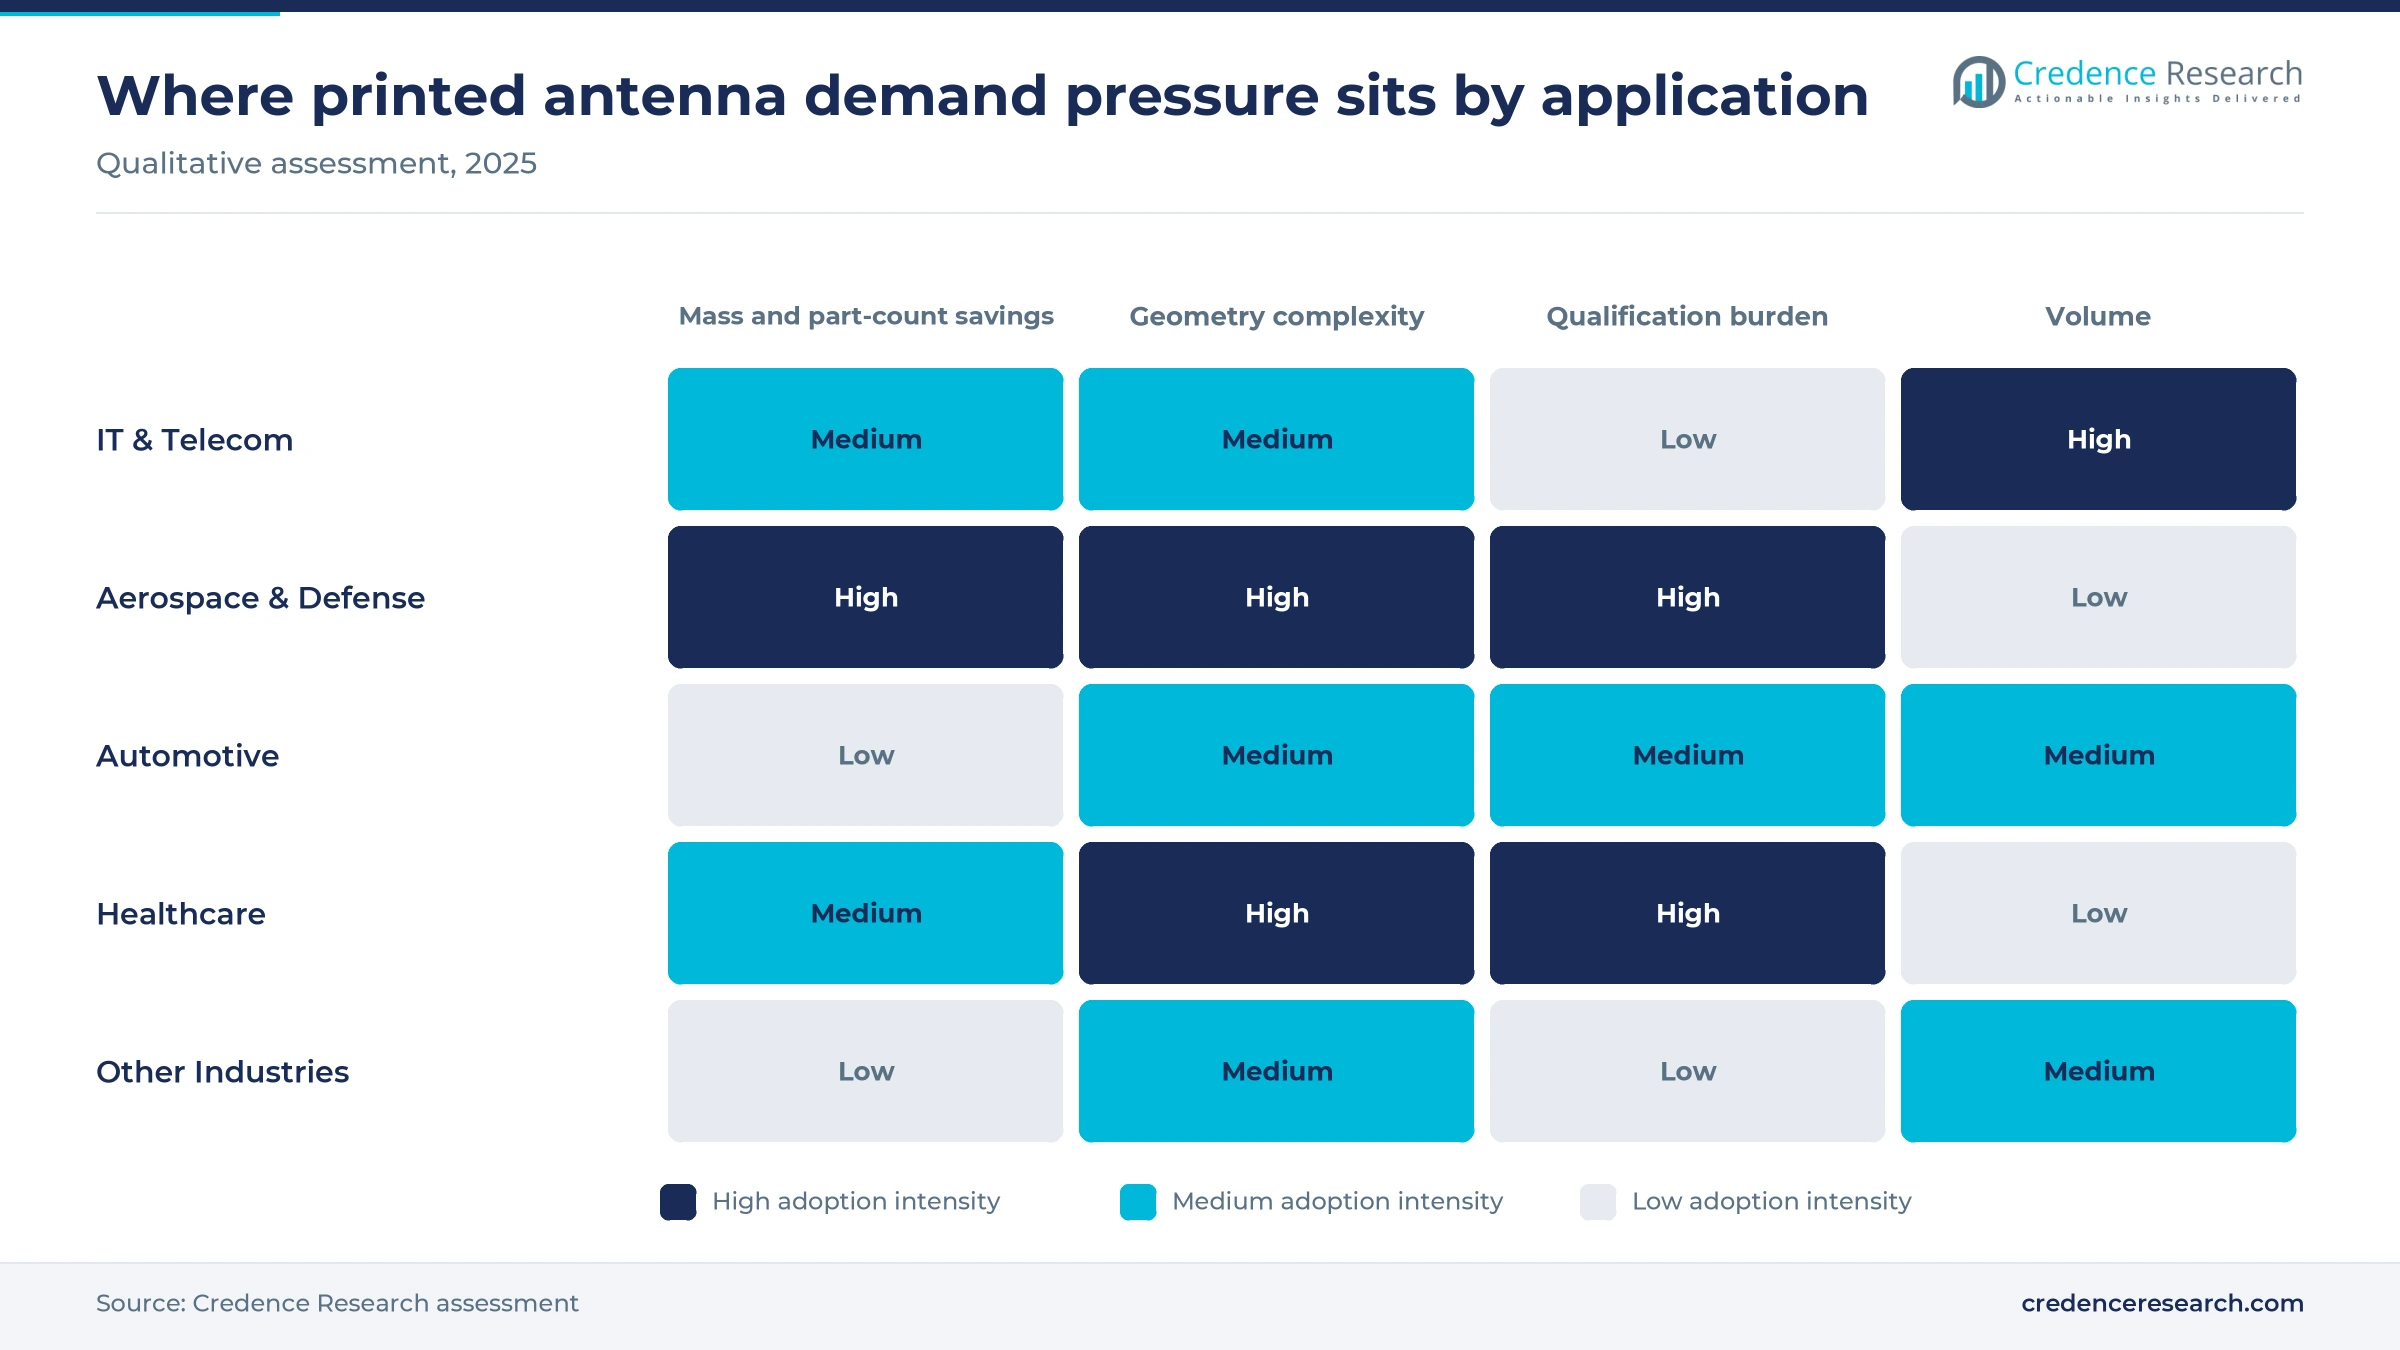
Based on application, the market is categorized into IT and telecom, aerospace and defense, automotive, healthcare and other industries. IT & Telecom led with 38.0% of 2025 value, because handsets, base station elements and fixed wireless units ship in the largest numbers, and Ericsson expects fixed wireless connections to reach 350 million by 2030. Aerospace & Defense grows fastest at 17.5% a year as governments order secure satellite payloads, including the phased array antenna products that Mitsubishi Electric ordered from SWISSto12 in September 2026 for Japan's GEO secure communications program. Healthcare use remains largely at research stage, and no public statistic sizes it.
| Segment Group | Leading Sub-segment | Share, 2025 | Fastest-growing Sub-segment | CAGR, 2026–2035 |
|---|---|---|---|---|
| By Technology | Direct Ink Writing (DIW) | 32.0% | Selective Laser Sintering (SLS) | 17.6% |
| By Frequency Range | Sub-6 GHz | 46.0% | mmWave | 17.8% |
| By Application | IT & Telecom | 38.0% | Aerospace & Defense | 17.5% |
Flight savings, not unit price, set printed RF value
Pricing splits sharply between flight hardware buyers and device brands. Flight hardware is sold per qualified unit under program contracts, and suppliers rarely publish prices, so value rests on what the printed part saves in assembly, mass and test time. The U.S. Space Force credits the printed GPS III omni antenna with cutting production time and cost by nearly 60 percent. At the other end, laboratory mmWave antennas printed from silver nanoparticles cost a few pounds each. Suppliers with flight heritage therefore hold premiums, while device trace printers compete on cycle time and yield.
| Product or reference | Typical price or fee | Basis |
|---|---|---|
| Printed omni antenna, GPS III satellite | Nearly 60% lower production time and cost than the conventional build | U.S. Space Force, April 2026 |
| Laboratory mmWave antenna tested to 48 GHz, silver nanoparticle print | A few pounds per unit, against GBP 100s for conventional antennas | University of Sheffield research release |
| Metal-printed RF feed chain or horn, flight unit | About USD 20,000–150,000 per unit | Credence Research estimate from program scope and machining comparisons |
| Direct-written antenna trace on a device housing | About USD 0.30–1.50 per antenna | Credence Research estimate from ink use and machine throughput |
Request a Free Sample
Fill in your details and we'll send you a free sample report.
- Sample data tables & charts
- Research methodology
Satellite volumes, flight savings and 5G spread lift demand
Record satellite launches widen the pool of RF payloads
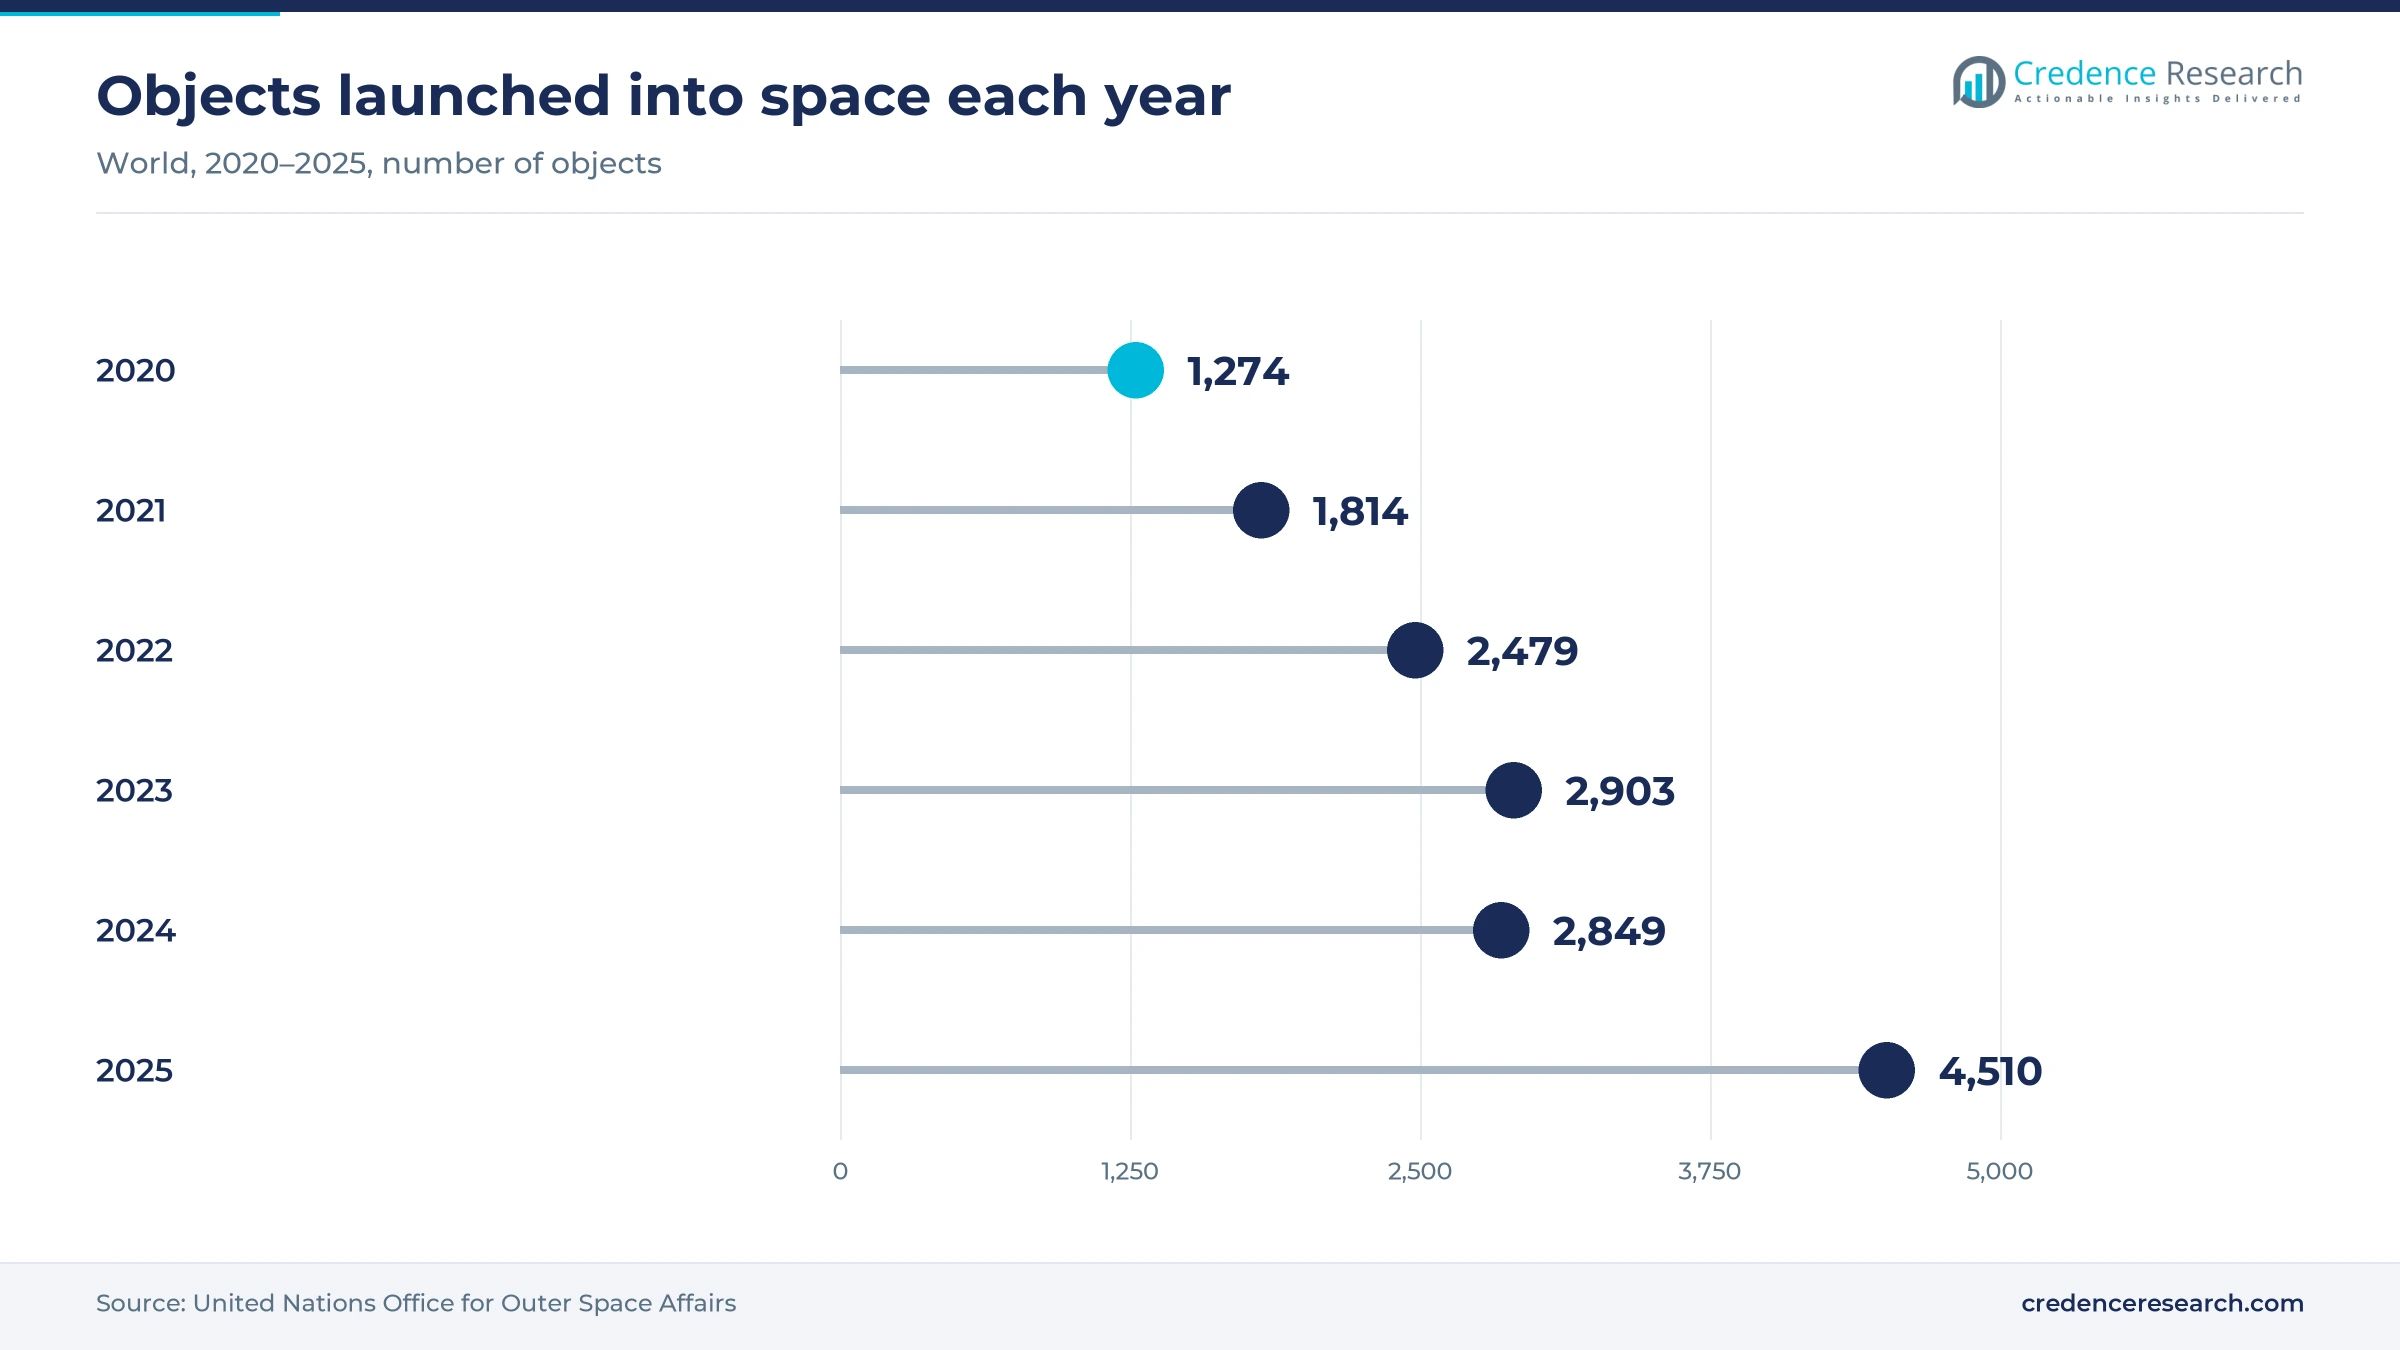
The number of spacecraft reaching orbit now sets the ceiling for printed feed chains, horns and waveguide networks, because each telecom or navigation satellite carries dozens of such parts. Humans launched a record 4,510 objects into space in 2025, against 2,849 in 2024, according to United Nations data. SWISSto12 says more than 2,000 of its printed RF products are operating in orbit. Northrop Grumman qualified monolithic SWISSto12 feed chains for its GEOStar-3 satellites in May 2024, with each chain merging diplexers, filters, polarizers and horns into one printed piece. Suppliers with qualified designs gain repeat orders as constellations replenish, while machined-part vendors lose content per satellite.
Flight-proven cost savings pull printing into prime programs
Satellite primes now print antennas because qualified parts cut assembly labor and remove brazed or soldered joints that fail in vibration testing. The final GPS III satellite, launched on April 21, 2026, carried the program's first printed omni antenna, which cut production time and cost by nearly 60 percent, the U.S. Space Force said. Lockheed Martin built the teardrop-shaped part in one piece from an aluminum 6061-based alloy and plans to use it on all GPS IIIF satellites. Airbus reported in February 2021 that printing roughly halved waveguide production time for its Eurostar Neo satellites. Primes that own qualified processes capture these savings internally, which caps demand for outside suppliers.
5G and fixed wireless growth raise demand for shaped RF parts
Wider 5G use lifts demand for printed lenses, radomes and array elements, because higher bands need precise geometries that molding and machining make slowly or at high cost. Ericsson expects 5G subscriptions to exceed 2.9 billion at the end of 2025 and reach 6.4 billion by 2031, about two-thirds of mobile subscriptions. The same November 2025 report counted 159 providers offering fixed wireless access over 5G. Ericsson also forecasts 180 million 6G subscriptions by 2031, which pushes antenna design toward higher bands. Equipment makers that prototype array elements by printing shorten design cycles, while volume radios still use molded parts until printed costs fall.
Defense research programs fund printed lens and array designs
Defense agencies are paying for printed antenna prototypes because tactical radios, drones and radars need low-mass, conformal apertures that conventional parts cannot easily match. In April 2025, the U.S. Army selected Fortify, with RTX and the University of Notre Dame, to prototype a gradient-index lens antenna for tactical 5G networks, 3D Printing Industry reported. Fortify had already shown a 13-inch Radix lens working from 3 to 18 GHz, Additive Manufacturing magazine reported. In October 2025, Washington State University and Boeing researchers reported AFRL-funded flexible printed arrays. Optisys signed a memorandum with Korea's LIG Nex1 in September 2022 to co-develop metal-printed antennas. These programs seed production orders for suppliers that qualify first.
RF specialists add capacity while printer owners consolidate
RF specialists are shifting from job shops to series capacity
Specialist suppliers are shifting from prototype work to series production lines, which changes how primes source printed RF hardware. SWISSto12 bought four MetalFabG2 metal printers from Additive Industries in November 2024 to make larger monolithic RF parts, and it opened a production and research site in Madrid in September 2025. The company closed a USD 70 million Series C round in July 2026 and cited more than USD 500 million in contracted orders, according to 3DPrint.com. Demand for metal additive manufacturing capacity in RF work therefore concentrates in a few suppliers. Primes gain second sources, while smaller shops without flight heritage face tougher price competition.
Defense electronics groups are absorbing printed RF know-how
Large defense and industrial groups are shifting printed RF capability inside their own portfolios, which narrows the field of independent suppliers. Honeywell completed its USD 1.9 billion purchase of CAES on Sept. 4, 2024, adding a radio frequency business that Lockheed Martin had selected in March 2022 to print phased array antennas at its Exeter, New Hampshire, lab. Nano Dimension completed its merger with Markforged on April 25, 2025, and its 2025 annual report still listed the DragonFly additively manufactured electronics line before the sale noted in the challenges. Buyers gain suppliers with deeper balance sheets and security clearances, but face fewer independent sources and longer contract negotiations.
Phased array satellite terminals offer a volume opening
Ground and onboard phased array terminals offer printed RF suppliers a step from tens of flight units to thousands of terminal apertures. ESA member states committed EUR 73 million in January 2026 to SWISSto12's HummingSat partnership project, which funds manufacturing scale-up and phased array antennas for LEO, MEO and GEO satellites and ground terminals. SES selected SWISSto12 in March 2025 to build Ka-band terminal arrays for O3b mPOWER, as noted in the frequency segment. Makers of satellite communication terminals need low-profile apertures for ships, aircraft and remote sites. Suppliers that cut unit cost through printed array tiles can win share in maritime and airborne connectivity contracts.
Low-cost millimeter-wave printing creates an opening for rural networks
Cheap printed mmWave antennas create room for suppliers in rural 5G and future 6G links, where operators need many small, low-cost apertures. Researchers at the University of Sheffield printed antennas from silver nanoparticles that tested at frequencies up to 48 GHz and cost a few pounds to make, against hundreds of pounds for conventional parts. The work was funded by the U.K. Defence and Security Accelerator and remains at laboratory stage. Operators and small radio makers stand to gain most, provided suppliers can match laboratory performance at production yields. The 6G forecast noted in the drivers points the same way, since higher bands need more and smaller antenna elements per site.
Qualification time, platform exits and resin losses restrain
Long flight qualification delays revenue for new suppliers
Qualification time is the main barrier for new suppliers, because satellite buyers accept printed RF parts only after process, alloy, thermal and vibration testing. Lockheed Martin produced its first printed omni antenna prototype in fall 2015, and the part reached orbit only in April 2026, roughly a decade later. Start-ups without flight heritage are most exposed, since they carry printer and testing costs for years before series orders arrive. Partnering with qualified primes on joint test campaigns shortens that path.
Printer platform exits leave antenna makers with orphan processes
Supply risk rises for antenna makers when a printer platform or material changes hands. Tethon 3D bought Fortify's RF dielectric materials intellectual property in March 2026, after Fortify had gone quiet, 3DPrint.com said. Fortify had won the Army lens prototype described above, and the sale leaves it unclear who will carry that design toward production. Nano Dimension also sold its additively manufactured electronics and Fabrica product lines to Inspira Technologies in April 2026, Digital Engineering 24/7 reported. Defense contractors with parts qualified on those platforms are most exposed.
A softer handset market slows device trace volumes
Device antenna traces written onto phone housings follow handset build volumes closely. A memory chip shortage raised handset build costs from late 2025, and fewer phone builds mean fewer molded housings carrying written antenna traces. Contract manufacturers running aerosol jet and ink writing lines are most exposed, since their machines sit idle when brands trim builds. Network demand offers partial relief, as Ericsson reported 20% growth in mobile data traffic between the third quarters of 2024 and 2025. Suppliers that diversify into IoT modules and vehicle telematics reduce that dependence.
Dielectric losses in printed resins limit high-band efficiency
Printed dielectric lenses and substrates lose more signal as frequency rises, which limits their use in efficient mmWave apertures. Rogers reported in March 2022 that its Radix printable resin has a dielectric constant of 2.8 and a dissipation factor of 0.0043 at 10 GHz, rising to 0.0046 at 24 GHz. Designers of high-gain mmWave arrays are most exposed, and molded metallized plastic waveguide antennas, such as a design Freudenberg Sealing Technologies has qualified for automotive radar, compete for volume programs.
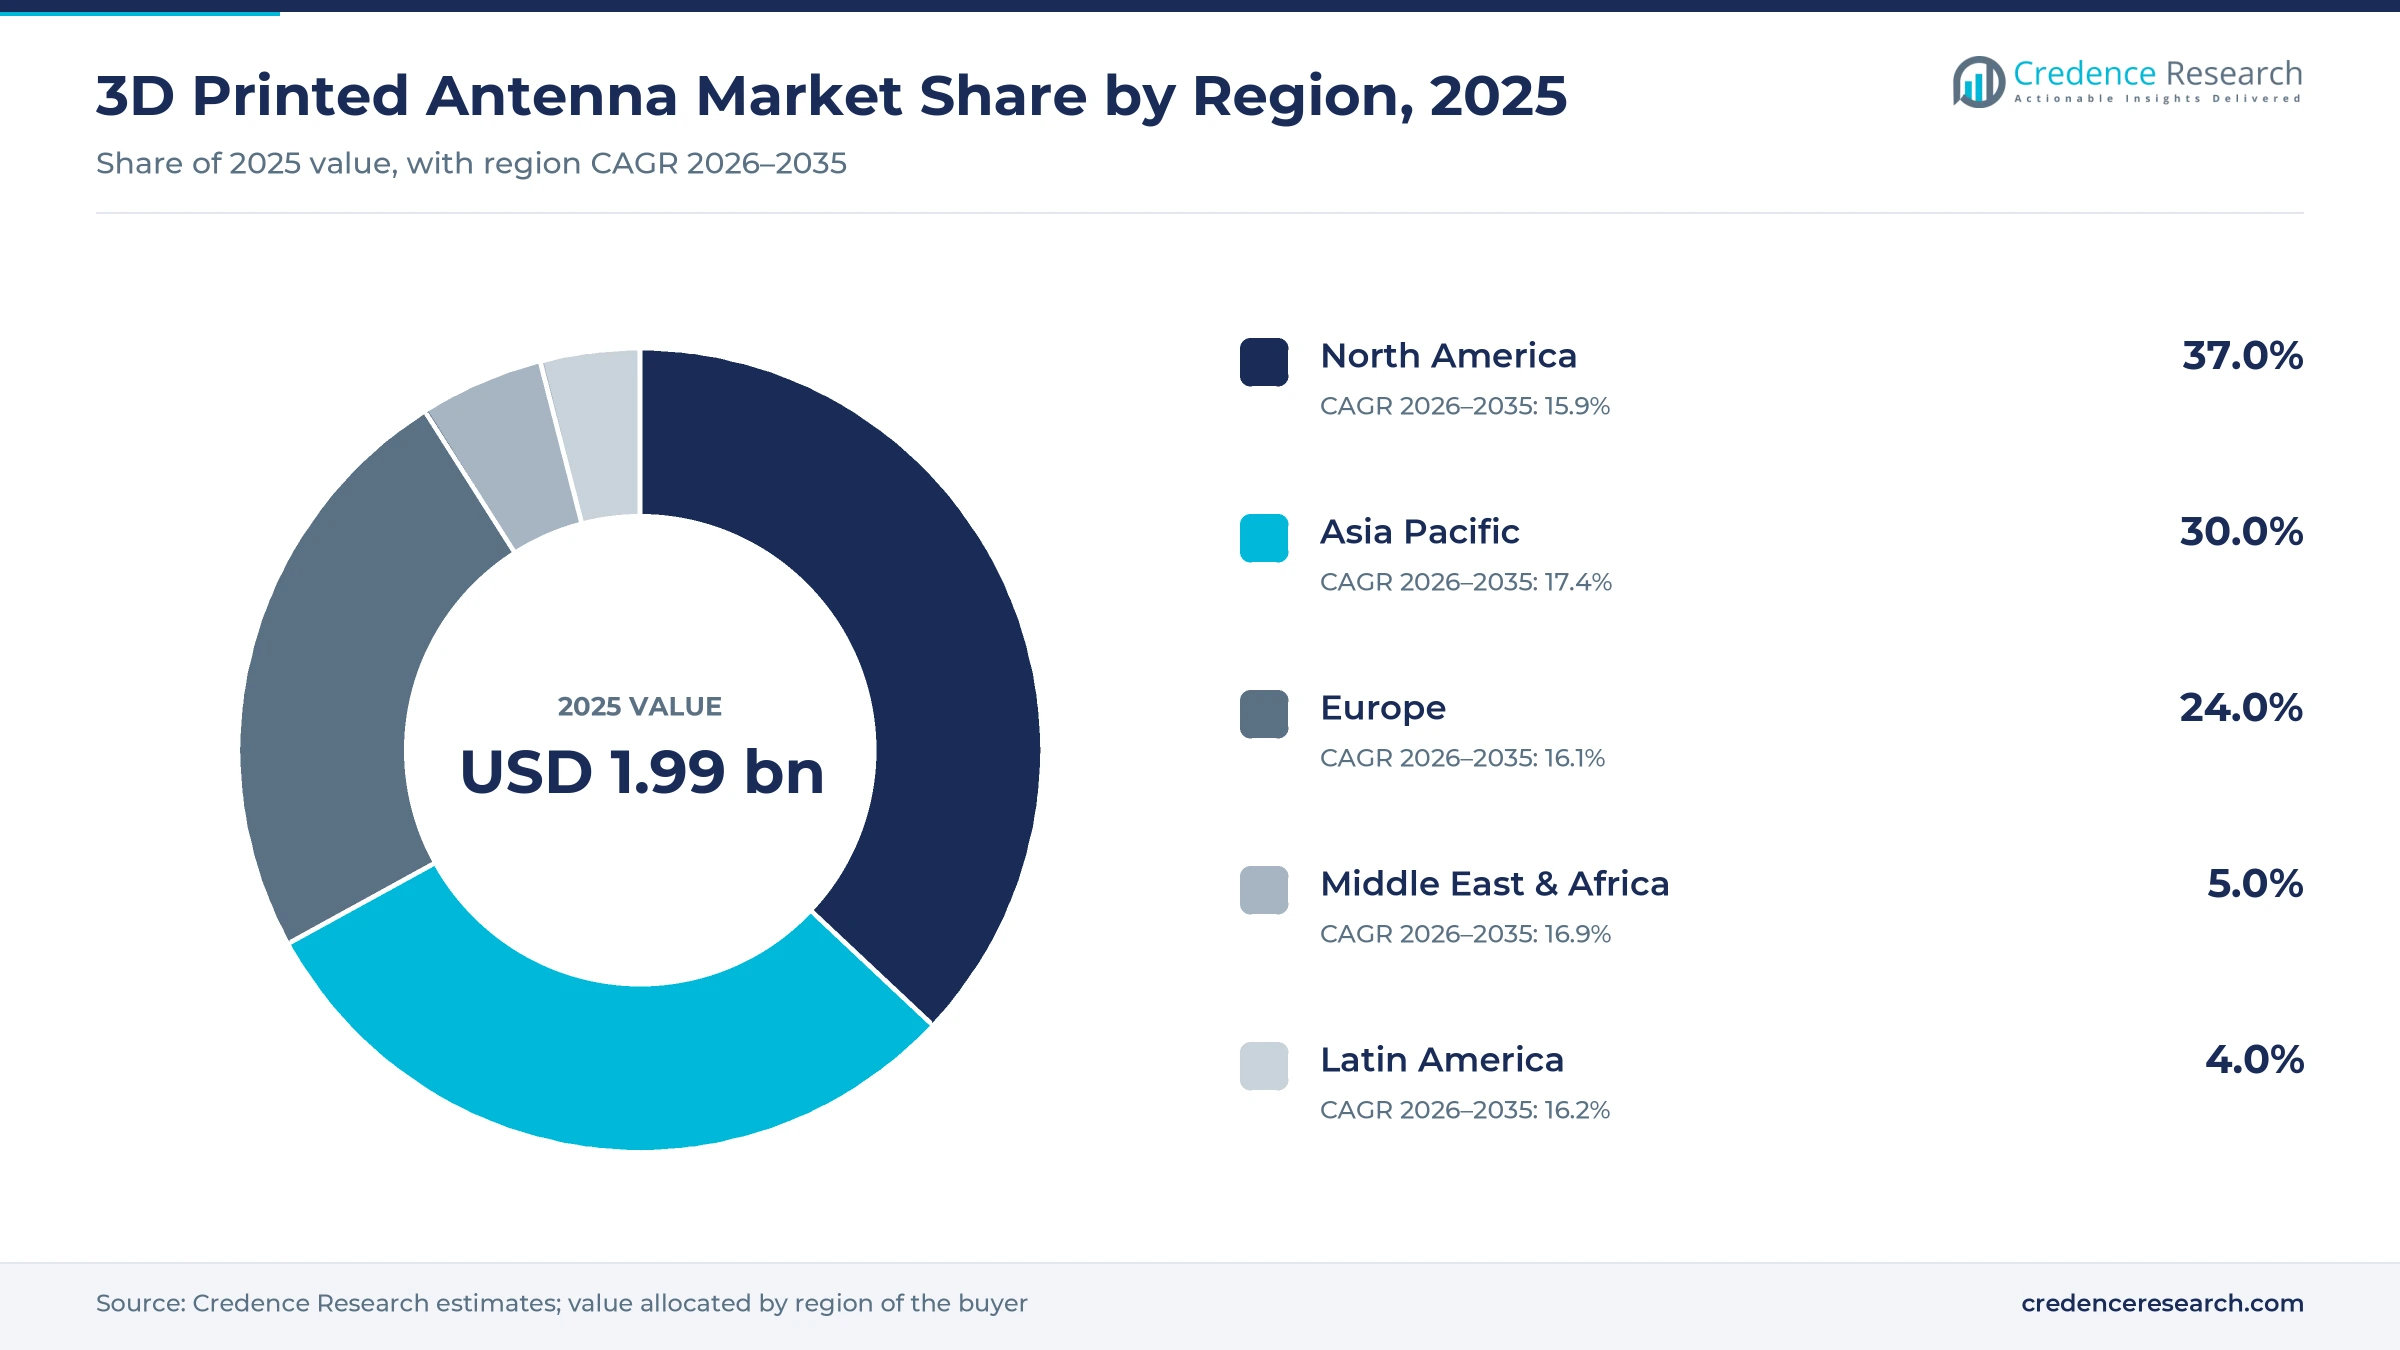
North America leads on GPS and defense programs
| Region | Value, 2025 (USD billion) | Share, 2025 | CAGR, 2026–2035 |
|---|---|---|---|
| North America | 0.73 | 37.0% | 15.9% |
| Asia Pacific | 0.60 | 30.0% | 17.4% |
| Europe | 0.48 | 24.0% | 16.1% |
| Middle East & Africa | 0.10 | 5.0% | 16.9% |
| Latin America | 0.08 | 4.0% | 16.2% |
North America leads on GPS and defense programs
North America held 37.0% of 2025 value and grows at 15.9% a year. The lead rests on military programs that buy flight-qualified printed hardware in volume. The GPS III omni antenna described above now flies on the constellation, and Lockheed Martin will carry the design onto GPS IIIF. Honeywell's CAES unit adds a domestic phased array printing lab, while the Army and Air Force Research Laboratory fund lens and flexible array work. Export controls keep much of this supply inside the region, which protects local suppliers but limits exports.
Asia Pacific grows fastest on Japanese and Korean defense orders
Asia Pacific held 30.0% of 2025 value and grows fastest at 17.4% a year. Japan's GEO secure communications program, supplied through Mitsubishi Electric as noted in the application segment, shows regional governments buying printed phased array hardware. Korea's LIG Nex1 has worked with Optisys on metal-printed antennas since 2022. Device demand adds volume, since China assembles most of the world's handsets and India reached 95% mid-band 5G coverage by the end of 2024. Local printing lines remain thinner than in North America, so imports fill flight demand.
Europe builds on ESA funding and satellite prime lines
Europe held 24.0% of 2025 value and grows at 16.1% a year. European satellite primes print RF hardware at scale, and Thales Alenia Space says all of its telecom satellites use printed antenna supports and reflector fittings. Airbus prints waveguide networks for Eurostar Neo platforms, and the ESA HummingSat funding discussed above supports SWISSto12's Swiss and Spanish sites. Buyers of waveguide components in the region can source printed parts locally. Slower commercial 6G timing, which Ericsson expects in Europe about a year after other regions, tempers telecom demand.
Middle East & Africa gains from Gulf network and defense spending
Middle East & Africa held 5.0% of 2025 value and grows at 16.9% a year. Ericsson lists some Gulf Cooperation Council countries among the front-runner markets for first 6G launches, which favors early high-band antenna trials. Gulf defense buyers also procure satellite and radar systems that carry printed RF parts, although no public source counts that content. Most supply is imported from North American and European primes, so local value stays low until regional assembly or offset programs add printing lines.
Latin America remains an import market for printed RF parts
Latin America held 4.0% of 2025 value and grows at 16.2% a year. The region has no publicly identified qualified line for printed flight antennas, so demand arrives inside imported satellites, radios and handsets. Satellite broadband for remote areas and maritime users is the most likely route for printed terminal arrays, although public data do not separate their antenna content. Regional shares are therefore a Credence Research estimate with a wide margin, and buyers depend on foreign suppliers for qualification and repair.
Contracts, launches and deals shaped 2024 to 2026
| Development | Status and market relevance |
|---|---|
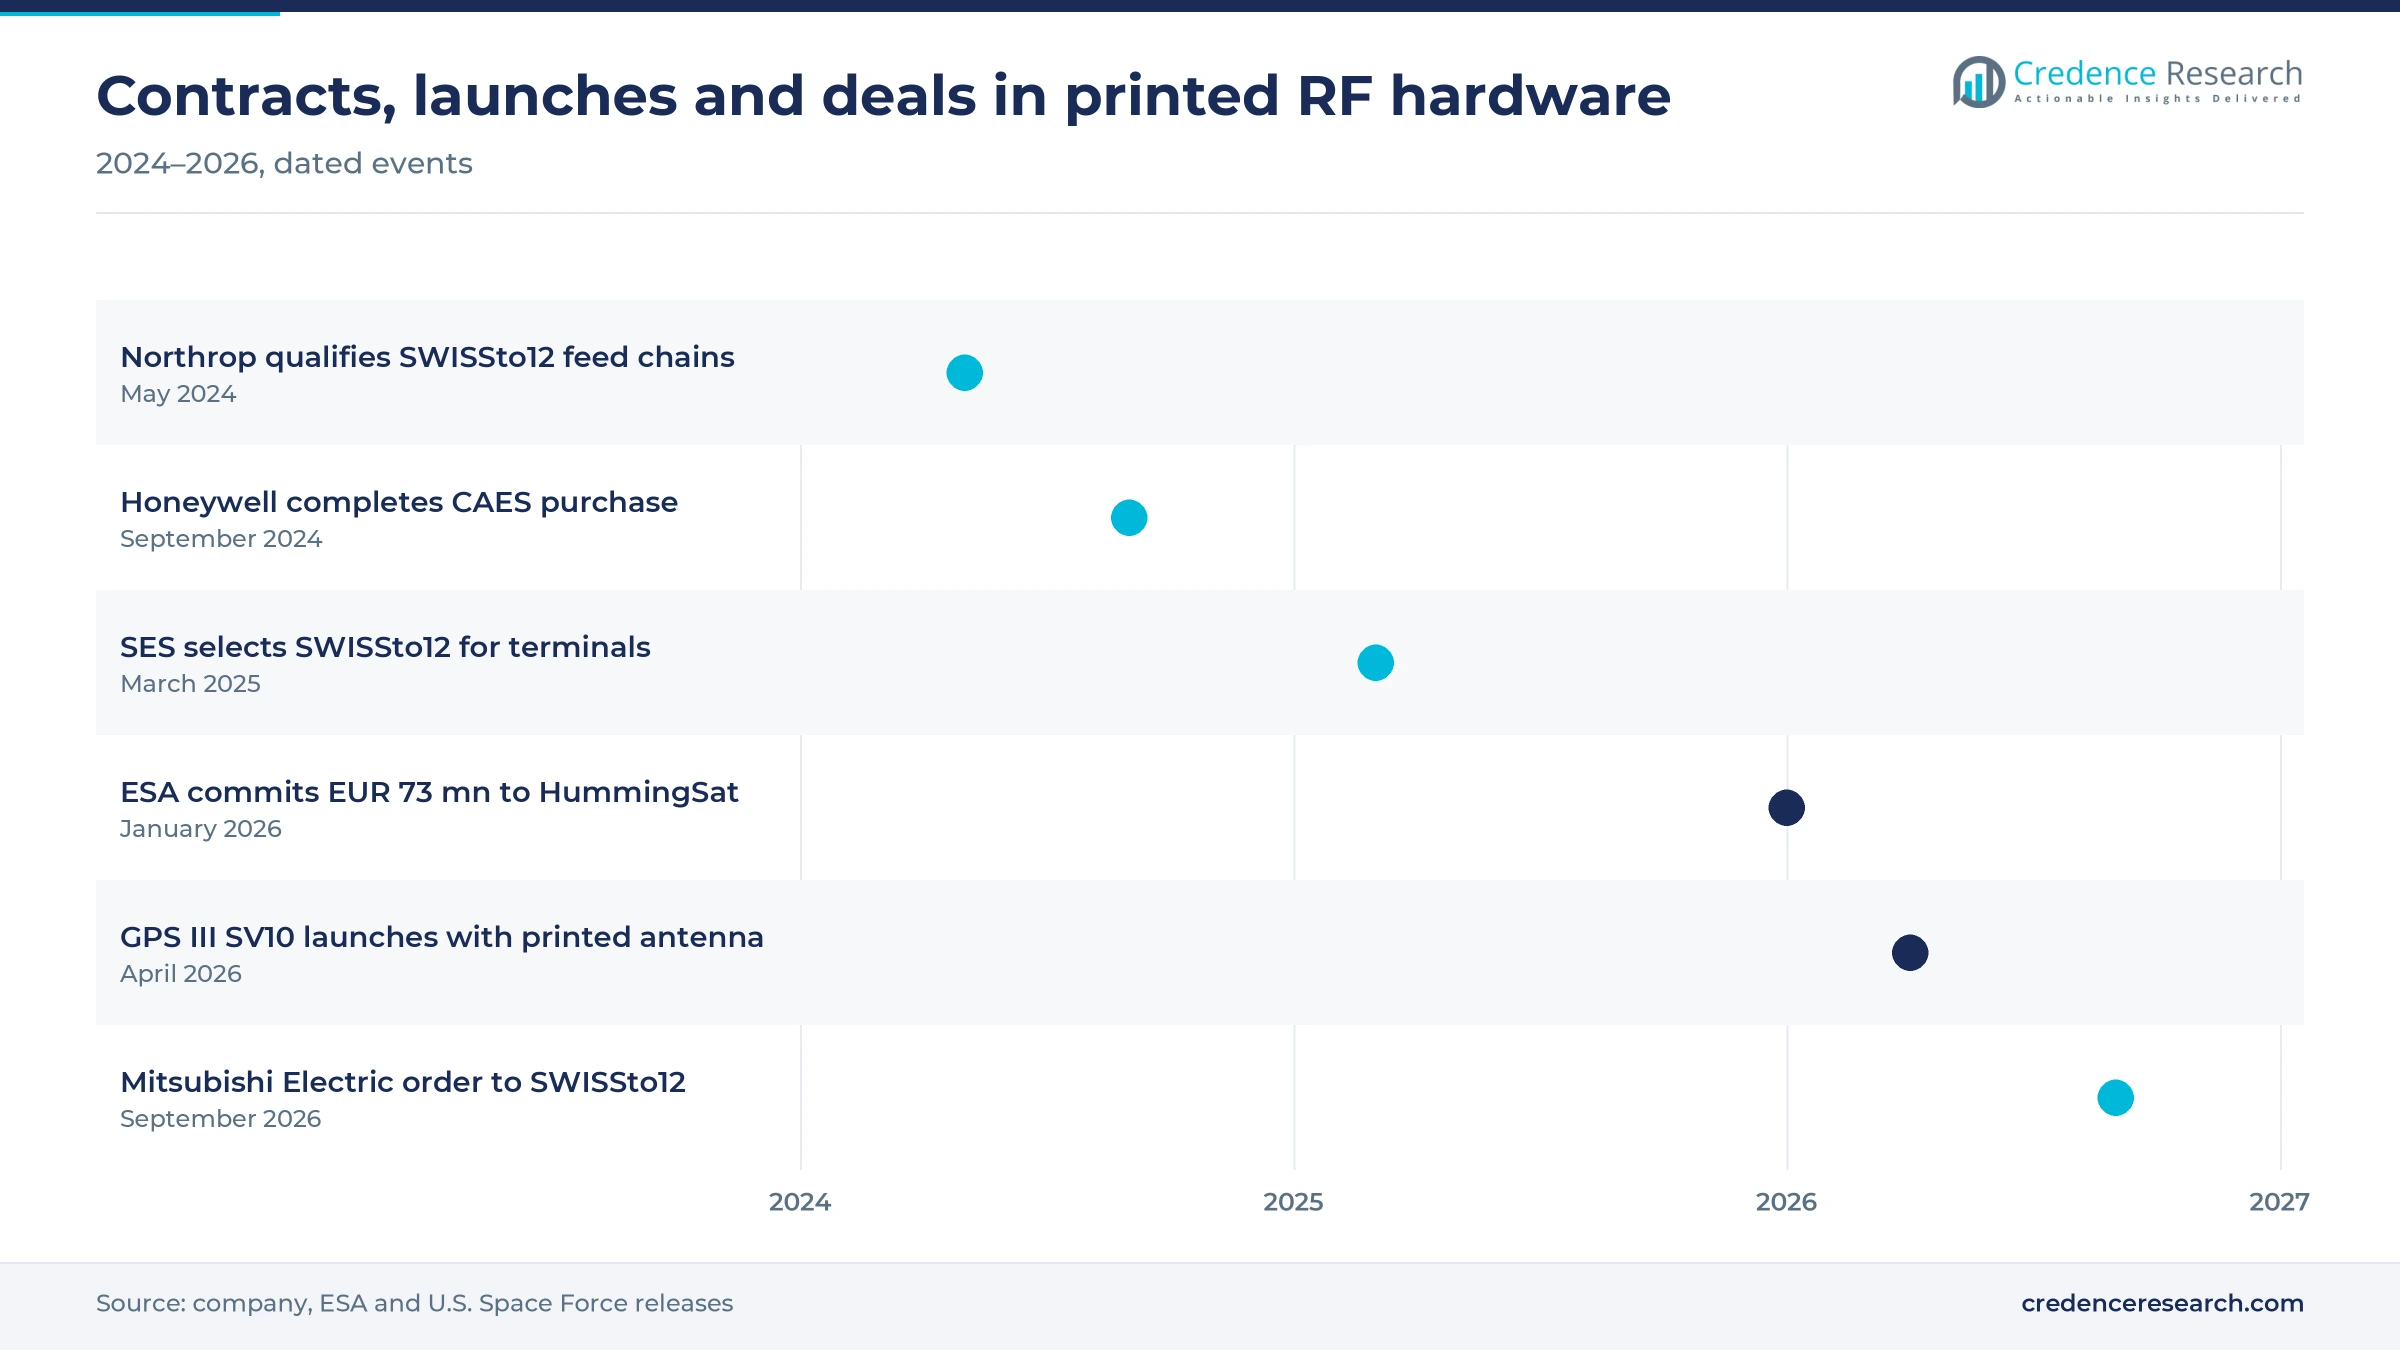
| In May 2024, Northrop Grumman qualified SWISSto12's monolithic printed RF feed chains for its GEOStar-3 satellites after the first three chains shipped. | Qualification completed; the supplier moved from development to flight hardware deliveries for a commercial geostationary platform. |
| In September 2024, Honeywell completed its USD 1.9 billion acquisition of CAES, a radio frequency supplier that prints phased array antennas for Lockheed Martin satellites. | Acquisition completed; printed RF capability now sits inside a large aerospace group. |
| In January 2026, ESA member states committed EUR 73 million to SWISSto12's HummingSat partnership project, including phased array antennas for satellites and ground terminals. | Funding commitment announced; supports manufacturing scale-up in Europe. |
| In April 2026, the final GPS III satellite launched on a Falcon 9 carrying the program's first printed omni antenna. | Operational launch; printed antennas now fly on a military navigation constellation. |
| In September 2026, Mitsubishi Electric awarded SWISSto12 a contract for phased array antenna products for Japan's GEO secure communications program. | Order awarded; value and delivery schedule were not disclosed. |
Powder bed, vat, direct-write and flexible processes compete
- Laser powder bed fusion melts aluminum alloys such as AlSi10Mg layer by layer, which lets Airbus and SWISSto12 merge waveguides, filters and horns into single flight parts.
- Vat photopolymerization cures filled resins by SLA or DLP, which suits gradient-index lenses because lattice density tunes the dielectric constant across the part.
- Direct writing of conductive inks deposits conductive inks by aerosol jet or extrusion onto molded housings, glass and ceramics, forming device antenna traces without separate flex circuits.
- Flexible printed arrays place copper ink traces on stretchable TPU tiles, and onboard processors correct beam errors as the surface bends, as AFRL-funded research showed in 2025.
Need a Custom Version of This Report?
Tailor the scope, geography, or segments to your exact requirements.
- Custom geography or segment scope
- Direct access to our analyst team
Space RF specialists and primes hold flight-qualified supply
Competition turns on flight heritage, qualified processes and program access rather than on printer count, because buyers cannot risk an unproven RF part on a satellite or missile. SWISSto12 sells printed feed chains and phased array products to Northrop Grumman, SES and Mitsubishi Electric. Optisys focuses on metal-printed antennas for aerospace and defense buyers in the United States and Korea. Lockheed Martin prints antennas in-house for GPS satellites, while Honeywell's CAES unit prints phased array antennas for Lockheed Martin programs. Airbus Defence and Space prints waveguide networks for Eurostar Neo platforms, and Thales Alenia Space prints antenna supports and reflector fittings for its telecom satellites. The six companies profiled below cover flight hardware only, because the makers of antenna traces written onto devices are not publicly named, an evidence gap that leaves the device side of this list open.
How do primes, RF specialists and material suppliers split the value?
The supply side of printed RF hardware has three distinct layers. Satellite and defense primes such as Lockheed Martin, Airbus and Thales Alenia Space print RF parts in-house for their own platforms, which keeps much of the value captive. Specialists such as SWISSto12, Optisys and Honeywell's CAES unit sell printed feed chains, horns and arrays to primes that lack qualified lines. Materials and printer suppliers, including Rogers with its Radix resin and Additive Industries with metal systems, sit upstream. Entry barriers are high in flight hardware, where qualification takes years, and margins sit with suppliers that hold flight heritage.
Companies profiled and their roles in this market
| Company | Type | Role in the market |
|---|---|---|
| SWISSto12 | Specialist | Sells printed RF feed chains, horns and phased array antenna products for satellites |
| Optisys, Inc. | Specialist | Designs and prints monolithic metal antennas for aerospace and defense buyers |
| Lockheed Martin Corporation | Prime, in-house producer | Prints flight-qualified omni antennas for GPS III and GPS IIIF satellites |
| Honeywell International Inc. (CAES) | Defense RF supplier | CAES unit prints phased array antennas for Lockheed Martin satellite programs |
| Airbus Defence and Space (Airbus SE) | Prime, in-house producer | Prints aluminum RF waveguide networks for Eurostar Neo telecom satellites |
| Thales Alenia Space (Thales Group) | Prime, in-house producer | Prints antenna supports and reflector fittings for its telecom satellites |
Flight heritage, not printer count, decides who wins
Credence Research's view is that flight heritage, more than printer capacity, decides which suppliers win business in the 3D printed antenna market. The GPS III launch and the GEOStar-3 qualification show that printed RF parts now pass the hardest acceptance tests, so the next contest is over series volume and second sourcing. Specialists with backlog can add capacity, while primes keep the highest-value parts in-house. Device traces add volume to the market but carry handset cycle risk. Buyers that depend on one printer platform should qualify a second process before platform owners change again.
Earlier estimate tested against flight and device volumes
The report uses 2025 as the base year and forecasts to 2035. The earlier Credence Research estimate for 2024 was carried forward one year at its own growth rate and tested against an estimate built from satellite and defense printed RF output and direct-written antenna traces on devices, using launch statistics, handset shipment data, company program disclosures and trade press. Regional and segment shares are Credence Research estimates based on program spending, device assembly locations and qualified printing lines. Sources include government agencies, statistics compilers, company releases and filings, university research and trade press. No interviews or surveys were conducted for this update of the estimate.
Satellite payloads and high-band terminals carry growth
Growth of the 3D printed antenna market to 2035 depends on satellite build rates, government secure communications programs and the spread of mmWave terminals. The base case assumes primes extend printed RF parts from navigation and geostationary satellites to more platforms, that specialists convert backlog into series deliveries, and that handset volumes recover after the 2026 memory shortage. Selective laser sintering of metals should gain share as larger build volumes allow monolithic feed networks. Printed terminal arrays and low-cost mmWave elements offer the largest upside if laboratory performance holds in production.
Satellite build rates and millimeter-wave adoption set the range
The range of outcomes depends mainly on how many telecom, navigation and defense satellites enter production, and on whether printed mmWave arrays reach terminal and network volumes. A slow replacement cycle for geostationary satellites and a weak handset market would pull growth down. Faster government secure communications programs and printed phased array terminals at volume are the main upside for this market.
| Scenario | CAGR, 2026–2035 | Value, 2035 | What has to hold |
|---|---|---|---|
| Downside | 13.5% | USD 7.23 billion | Satellite orders slow, handset builds fall and printed parts stay in qualification programs |
| Base | 16.50% | USD 9.15 billion | Primes extend printed RF parts across new platforms and terminal arrays grow steadily |
| Upside | 18.5% | USD 10.66 billion | Secure satellite programs and printed terminal arrays scale faster than expected |
Frequently Asked Questions
How big is the 3D printed antenna market?
Which technology leads the 3D printed antenna market?
Which region leads demand for 3D printed antennas?
Are 3D printed antennas used on satellites in orbit?
How much cost does a 3D printed satellite antenna save?
Which frequency range grows fastest for printed antennas?
Who are the main suppliers of 3D printed antennas?
What restrains the 3D printed antenna market?
Table of Content
Chapter 1 Market Segmentation
- 1.1 Segmentation Framework
- 1.1.1 Product and Service Classification
- 1.1.2 Application and End-Use Classification
- 1.1.3 Technology and Solution Classification
- 1.1.4 Customer and Distribution Channel Classification
- 1.1.5 Geographic Segmentation
- 1.1.6 Market Segment Definitions and Boundaries
- 1.2 By Technology
- 1.2.1 Direct Ink Writing (DIW)
- 1.2.2 Selective Laser Sintering (SLS)
- 1.2.3 Stereolithography (SLA)
- 1.2.4 Fused Deposition Modeling (FDM)
- 1.2.5 Electron Beam Melting (EBM)
- 1.3 By Frequency Range
- 1.3.1 Sub-6 GHz
- 1.3.2 mmWave
- 1.3.3 Other Frequency Ranges
- 1.4 By Application
- 1.4.1 IT & Telecom
- 1.4.2 Aerospace & Defense
- 1.4.3 Automotive
- 1.4.4 Healthcare
- 1.4.5 Other Industries
Chapter 2 Introduction
- 2.1 Report Objectives and Scope
- 2.2 Product Definition and Industry Terminology
- 2.3 Market Inclusions and Exclusions
- 2.4 Research Process
- 2.4.1 Primary Research and Expert Interviews
- 2.4.2 Secondary Research and Source Review
- 2.4.3 Top-Down and Bottom-Up Estimation
- 2.4.4 Data Triangulation and Verification
- 2.5 Market Size Measurement Basis
- 2.5.1 2025: USD 1.99 billion → 2035: USD 9.15 billion
- 2.6 Historical and Forecast Reference Periods
- 2.6.1 Historical Period: 2018-2025
- 2.6.2 Base Year: 2025
- 2.6.3 Forecast Period: 2025-2035
- 2.7 Research Assumptions and Limitations
Chapter 3 Executive Summary
- 3.1 Market Snapshot and Key Findings
- 3.2 Base-Year Market Size, 2025
- 3.3 Forecast Market Size, 2035
- 3.4 Revenue and Volume Growth Outlook
- 3.5 Key Demand and Supply Indicators
- 3.6 Leading Market Segments
- 3.7 Fastest-Growing Market Opportunities
- 3.8 Regional Performance Highlights
- 3.9 Technology and Industry Transformation
- 3.10 Competitive Landscape Summary
- 3.11 Analyst View and Strategic Implications
Chapter 4 Global 3D Printed Antenna Market Trends and Developments
- 4.1 Historical Industry Development, 2018-2025
- 4.2 Recent Market Trends and Developments
- 4.3 Demand and Customer Behavior Trends
- 4.4 Technology and Product Innovation
- 4.5 Artificial Intelligence, Automation and Digitalization
- 4.6 Local Manufacturing and Supply Chain Realignment
- 4.7 Industry Partnerships, Mergers and Acquisitions
- 4.8 Sustainability and Circular Economy Developments
- 4.9 Government and Private Sector Investment Trends
- 4.10 Emerging Business Models and Commercialization
- 4.11 Industry Developments and Announcements
Chapter 5 Global 3D Printed Antenna Market Production, Supply and Demand Analysis
- 5.1 Demand Trend and Consumption Analysis, 2018-2025
- 5.2 Demand Forecast, 2025-2035
- 5.3 Production and Output Trend, 2018-2025
- 5.4 Production and Output Forecast, 2025-2035
- 5.5 Installed Capacity and Capacity Utilization
- 5.6 Company-Wise Production Plants and Statistics
- 5.6.1 Installed Production Capacity
- 5.6.2 Actual Production
- 5.6.3 Planned Capacity and Expansion Targets
- 5.7 Supply Chain Structure and Procurement Trends
- 5.8 Supply-Demand Gap and Bottlenecks
- 5.9 Import Dependence and Sourcing Structure
- 5.10 Contract Manufacturing and Outsourcing
- 5.11 Regional Supply and Demand Concentration
Chapter 6 Global 3D Printed Antenna Market Pricing Analysis
- 6.1 Pricing Structure and Measurement
- 6.2 Historical Pricing Trends, 2018-2025
- 6.3 Pricing Outlook, 2025-2035
- 6.4 Average Selling Price and Unit Economics
- 6.5 Pricing by Product and Market Segment
- 6.6 Geographic Pricing Differences
- 6.7 Key Input, Energy, Labor and Logistics Costs
- 6.8 Contract Pricing and Purchasing Models
- 6.9 Pricing Sensitivity and Competitive Positioning
- 6.10 Price, Margin and Profitability Implications
Chapter 7 Global 3D Printed Antenna Market Dynamics
- 7.1 Market Growth Drivers
- 7.1.1 Demand-Side Drivers
- 7.1.2 Technology and Innovation Drivers
- 7.1.3 Infrastructure and Investment Drivers
- 7.1.4 Regulatory and Policy Drivers
- 7.2 Market Restraints
- 7.2.1 Cost and Affordability Constraints
- 7.2.2 Technology and Adoption Barriers
- 7.2.3 Supply Chain and Operational Constraints
- 7.3 Market Challenges
- 7.3.1 Competitive Pressure and Margin Erosion
- 7.3.2 Skills, Infrastructure and Implementation Gaps
- 7.4 Emerging Market Opportunities
- 7.5 Market Dynamics Impact and Time-Horizon Assessment
Chapter 8 Global 3D Printed Antenna Value Chain Analysis
- 8.1 Industry Value Chain Overview
- 8.2 Upstream Suppliers and Critical Inputs
- 8.3 Technology and Component Providers
- 8.4 Manufacturing or Service Delivery
- 8.5 Distribution, Channel Partners and Integrators
- 8.6 Downstream Applications and End Users
- 8.7 Value Addition and Profit Pools
- 8.8 Vertical Integration and Outsourcing
- 8.9 Supplier Concentration and Risk
- 8.10 Supply Chain Localization and Resilience
Chapter 9 Global 3D Printed Antenna Market Regulations and Policies
- 9.1 Relevant Laws, Standards and Compliance Frameworks
- 9.2 Product, Service, Safety and Quality Requirements
- 9.3 Government Policies, Incentives and Subsidies
- 9.4 Imports, Exports and Trade Barriers
- 9.5 Public Procurement and Local Content Requirements
- 9.6 Environmental and Sustainability Compliance
- 9.7 Data Protection, AI and Cybersecurity Compliance
- 9.8 Upcoming Policy Changes and Market Implications
Chapter 10 Global 3D Printed Antenna Market Hotspots and Opportunities
- 10.1 Market Opportunity Mapping and Growth Hotspots
- 10.2 High-Growth Applications and Customer Groups
- 10.3 Underserved Markets and White-Space Opportunities
- 10.4 Emerging Technology and Product Opportunities
- 10.5 New Capacity and Investment Hotspots
- 10.6 Market Entry and Expansion Opportunities
- 10.7 Distribution and Partnership Opportunities
- 10.8 Near-Term and Long-Term Commercial Potential
- 10.9 Opportunity Attractiveness and Execution Risks
Chapter 11 Global 3D Printed Antenna Market Outlook, 2025-2035
- 11.1 Market Size and Analysis
- 11.1.1 Revenue (Market Measurement: 2025: USD 1.99 billion → 2035: USD 9.15 billion)
- 11.1.2 Market Volume and Quantity Sold
- 11.1.3 Historical Market Size, 2018-2025
- 11.1.4 Base-Year Market Size, 2025
- 11.2 Market Forecast, 2025-2035
- 11.2.1 Revenue Forecast to 2035
- 11.2.2 Volume Forecast to 2035
- 11.2.3 CAGR and Year-on-Year Growth
- 11.2.4 Incremental Revenue Opportunity
- 11.3 Forecast Assumptions and Scenario Analysis
- 11.3.1 Base-Case Forecast
- 11.3.2 Optimistic and Conservative Scenarios
- 11.3.3 Technology, Pricing and Policy Sensitivities
- 11.4 Market Attractiveness and Growth Outlook
Chapter 12 Global 3D Printed Antenna Market Segmentation and Outlook
- 12.1 Segmentation Summary and Market Shares, 2025
- 12.2 Largest and Fastest-Growing Segments
- 12.3 By Technology - Market Size and Forecast, 2025-2035
- 12.3.1 Segment Definition and Scope
- 12.3.2 Historical Market Size, 2018-2025
- 12.3.3 Revenue Forecast, 2025-2035
- 12.3.4 Volume Forecast, 2025-2035
- 12.3.5 Base-Year Market Share, 2025
- 12.3.6 Segment CAGR and Growth Drivers
- 12.3.7 Subsegment Market Size and Forecast
- 12.3.7.1 Direct Ink Writing (DIW)
- 12.3.7.2 Selective Laser Sintering (SLS)
- 12.3.7.3 Stereolithography (SLA)
- 12.3.7.4 Fused Deposition Modeling (FDM)
- 12.3.7.5 Electron Beam Melting (EBM)
- 12.3.8 Subsegment Pricing and Adoption Trends
- 12.3.9 Leading Suppliers and Competition
- 12.3.10 Regional Demand and Opportunities
- 12.4 By Frequency Range - Market Size and Forecast, 2025-2035
- 12.4.1 Segment Definition and Scope
- 12.4.2 Historical Market Size, 2018-2025
- 12.4.3 Revenue Forecast, 2025-2035
- 12.4.4 Volume Forecast, 2025-2035
- 12.4.5 Base-Year Market Share, 2025
- 12.4.6 Segment CAGR and Growth Drivers
- 12.4.7 Subsegment Market Size and Forecast
- 12.4.7.1 Sub-6 GHz
- 12.4.7.2 mmWave
- 12.4.7.3 Other Frequency Ranges
- 12.4.8 Subsegment Pricing and Adoption Trends
- 12.4.9 Leading Suppliers and Competition
- 12.4.10 Regional Demand and Opportunities
- 12.5 By Application - Market Size and Forecast, 2025-2035
- 12.5.1 Segment Definition and Scope
- 12.5.2 Historical Market Size, 2018-2025
- 12.5.3 Revenue Forecast, 2025-2035
- 12.5.4 Volume Forecast, 2025-2035
- 12.5.5 Base-Year Market Share, 2025
- 12.5.6 Segment CAGR and Growth Drivers
- 12.5.7 Subsegment Market Size and Forecast
- 12.5.7.1 IT & Telecom
- 12.5.7.2 Aerospace & Defense
- 12.5.7.3 Automotive
- 12.5.7.4 Healthcare
- 12.5.7.5 Other Industries
- 12.5.8 Subsegment Pricing and Adoption Trends
- 12.5.9 Leading Suppliers and Competition
- 12.5.10 Regional Demand and Opportunities
- 12.6 Segment Growth Comparison
- 12.7 Segment Attractiveness and Priority Matrix
Chapter 13 Global 3D Printed Antenna End-Use and Application Market Outlook
- 13.1 End-Use Industry and Customer Demand Structure
- 13.2 Leading Applications and Customer Groups
- 13.3 End-Use Market Size, Share and Forecast
- 13.4 Major End-Use Industry Deep Dives
- 13.4.1 Customer Requirements and Use Cases
- 13.4.2 Demand and Replacement Cycles
- 13.4.3 Technical and Regulatory Considerations
- 13.4.4 Purchasing and Procurement Models
- 13.4.5 Leading Vendors and Distribution Channels
- 13.4.6 Forecast and Commercial Opportunities
- 13.5 Emerging Applications and Cross-Segment Demand
- 13.6 End-Use Industry Investment Priorities
Chapter 14 Global 3D Printed Antenna Geographic Market Outlook, 2025-2035
- 14.1 Regional Market Size and Share, 2025
- 14.2 Regional Market Forecast, 2025-2035
- 14.3 Regional Pricing, Production and Demand Differences
- 14.4 North America
- 14.4.1 United States
- 14.4.2 Canada
- 14.4.3 Mexico
- 14.5 Europe
- 14.5.1 Germany
- 14.5.2 France
- 14.5.3 Italy
- 14.5.4 United Kingdom
- 14.5.5 Spain
- 14.5.6 Poland
- 14.5.7 Russia
- 14.5.8 Netherlands
- 14.5.9 Belgium
- 14.5.10 Sweden
- 14.5.11 Denmark
- 14.5.12 Norway
- 14.5.13 Rest of Europe
- 14.6 Asia Pacific
- 14.6.1 China
- 14.6.2 India
- 14.6.3 Japan
- 14.6.4 South Korea
- 14.6.5 Thailand
- 14.6.6 Indonesia
- 14.6.7 Vietnam
- 14.6.8 Malaysia
- 14.6.9 Australia
- 14.6.10 Rest of Asia Pacific
- 14.7 Latin America
- 14.7.1 Brazil
- 14.7.2 Argentina
- 14.7.3 Colombia
- 14.7.4 Chile
- 14.7.5 Rest of Latin America
- 14.8 Middle East
- 14.8.1 Saudi Arabia
- 14.8.2 United Arab Emirates
- 14.8.3 Turkey
- 14.8.4 Israel
- 14.8.5 Iran
- 14.8.6 Rest of the Middle East
- 14.9 Africa
- 14.9.1 South Africa
- 14.9.2 Egypt
- 14.9.3 Nigeria
- 14.9.4 Morocco
- 14.9.5 Rest of Africa
- 14.10 Regional Investment, Policy and Supply Chain Differences
- 14.11 Regional Competitive Landscape
- 14.12 Geographic Growth Hotspots
Chapter 15 Global 3D Printed Antenna Technology, Innovation and Sustainability Outlook
- 15.1 Technology Landscape and Maturity
- 15.2 Product, Process and Service Innovation
- 15.3 AI, Automation and Digital Tools in the Industry
- 15.4 Technology Adoption and Performance Benchmarking
- 15.5 Innovation Pipeline and R&D Investment
- 15.6 Patent and Intellectual Property Trends
- 15.7 Energy Efficiency and Resource Management
- 15.8 Sustainability, Recycling and Circularity
- 15.9 Technology Roadmap, 2025-2035
- 15.10 Risks of Obsolescence and Technology Substitution
Chapter 16 Global 3D Printed Antenna Market Key Strategic Imperatives
- 16.1 Growth and Market Entry Priorities
- 16.2 High-Return Products and Segments
- 16.3 Pricing, Profitability and Cost Optimization
- 16.4 Technology Investment and Product Differentiation
- 16.5 Supply Chain Localization and Resilience
- 16.6 Distribution and Customer Acquisition
- 16.7 Partnership, Acquisition and Capacity Strategy
- 16.8 Regional Expansion Priorities
- 16.9 Short-, Medium- and Long-Term Actions
Chapter 17 Competition Outlook
- 17.1 Industry Competition Characteristics
- 17.2 Market Structure and Concentration
- 17.3 Market Share and Competitive Positioning, 2025
- 17.4 Company-Wise Revenue and Product Benchmarking
- 17.5 Production and Service Capacity Benchmarking
- 17.6 Technology, Pricing and Differentiation
- 17.7 Regional Footprint and Distribution Strength
- 17.8 Mergers, Acquisitions and Strategic Alliances
- 17.9 New Entrants and Competitive Threats
- 17.10 Porter's Five Forces and Industry Attractiveness
- 17.11 Competitive Outlook, 2025-2035
Chapter 18 Company Profiles
- 18.1 Company Coverage and Selection Criteria
- 18.2 SWISSto12
- 18.2.1 Business Description
- 18.2.2 Company Ownership and Geographic Presence
- 18.2.3 Product and Service Portfolio
- 18.2.4 Manufacturing and Operating Footprint
- 18.2.5 Production Capacity and Expansion Plans
- 18.2.6 Financial Performance and Investment
- 18.2.7 Market Share and Competitive Position
- 18.2.8 Technology and Innovation Capabilities
- 18.2.9 Strategic Alliances or Partnerships
- 18.2.10 Recent Developments
- 18.2.11 Growth Strategy and Outlook
- 18.3 Optisys, Inc.
- 18.4 Lockheed Martin Corporation
- 18.5 Honeywell International Inc. (CAES)
- 18.6 Airbus Defence and Space (Airbus SE)
- 18.7 Thales Alenia Space (Thales Group)
- 18.8 Other Relevant Market Participants
Note: Every listed company is profiled on the structure shown under the first company. The company list is preliminary and may change based on research findings, market developments, data availability and client requirements.
Chapter 19 Disclaimer
- 19.1 Research and Forecast Disclaimer
- 19.2 Data Source and Estimation Limitations
Note: The depth of individual sections depends on data availability for this market. Volume, capacity, trade and other unit-based metrics are included where applicable.

