
Market overview
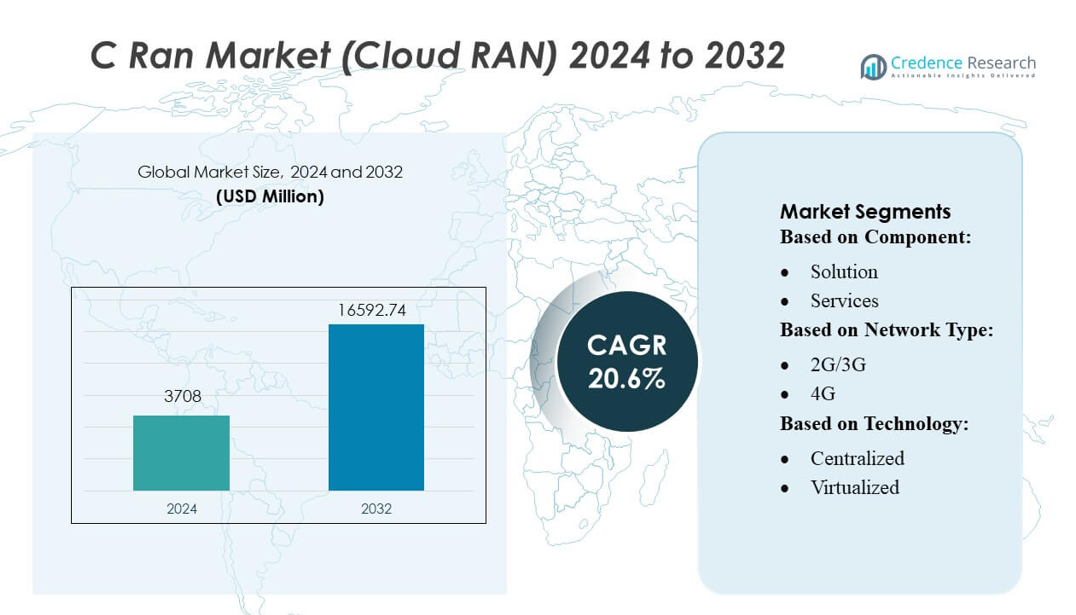
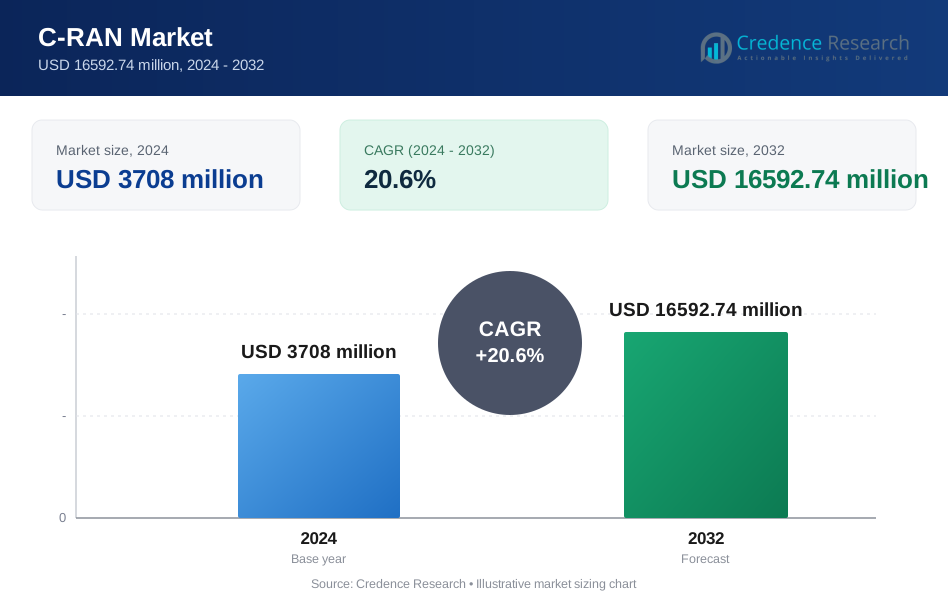
C Ran Market (Cloud RAN) size was valued USD 3708 million in 2024 and is anticipated to reach USD 16592.74 million by 2032, at a CAGR of 20.6% during the forecast period.
| REPORT ATTRIBUTE | DETAILS |
|---|---|
| Historical Period | 2020-2023 |
| Base Year | 2024 |
| Forecast Period | 2025-2032 |
| C-RAN Market (Cloud RAN) Size 2024 | USD 3708 million |
| C-RAN Market (Cloud RAN), CAGR | 20.6% |
| C-RAN Market (Cloud RAN) Size 2032 | USD 16592.74 million |
The C-RAN market features strong competition among leading innovators such as Cisco Systems, Inc., HRMavenir Systems, Inc., Huawei Technologies Co., Ltd., Samsung Electronics Co., Ltd., Altiostar Networks, Intel Corporation, ASOCS Ltd., Telefonaktiebolaget LM Ericsson, NEC Corporation, and Fujitsu Limited. These companies advance cloud-native RAN, virtualization, and open interface capabilities to support large-scale 5G deployments. Asia-Pacific remains the leading region, accounting for approximately 35% of the global market share, driven by extensive operator investments, dense urban connectivity needs, and accelerated adoption of centralized and virtualized RAN architectures across major markets.
Market Insights
- The C-RAN Market (Cloud RAN) was valued at USD 3708 million in 2024 and is projected to reach USD 16592.74 million by 2032, growing at a 6% CAGR, supported by large-scale 5G rollout and rising demand for centralized network architectures.
- Key market drivers include rapid network densification, increasing virtualization needs, and strong operator focus on reducing operational costs through centralized baseband processing.
- Major trends involve wider adoption of cloud-native RAN, AI-enabled network automation, open RAN integration, and expanding enterprise interest in private 5G solutions.
- Competitive activity intensifies as top players enhance fronthaul efficiency, energy optimization, and multi-vendor interoperability to strengthen market presence across diverse deployment environments.
- Asia-Pacific leads with 35% market share, followed by North America and Europe, while centralized RAN architecture dominates segment share due to superior scalability, high spectral efficiency, and strong compatibility with advanced 5G use cases.
Market Segmentation Analysis:
By Component
The Solution segment holds the dominant position in the C-RAN Market, capturing an estimated 60–65% share due to rapid operator demand for centralized baseband processing that improves spectral efficiency and reduces operational overhead. Its leadership strengthens as mobile networks expand virtualization initiatives and seek scalable architectures for multi-site coordination. Strong driver momentum comes from rising network densification, growing cloud adoption in telecom infrastructure, and broad integration of software-defined functionalities that enhance performance, flexibility, and real-time resource allocation across distributed radio units.
- For instance, Cisco Systems, Inc. supports high-performance virtualized RAN deployments through its UCS X210c M7 compute node. This node can be configured with processors delivering up to 32 CPU cores per socket (or even up to 64 cores with 5th Gen Intel Xeon Scalable processors).
By Network Type
The 5G sub-segment leads this category with an approximate 70% market share, supported by its critical role in enabling low-latency applications and massive connectivity requirements. Operators prioritize 5G-based C-RAN deployments to achieve advanced features such as dynamic spectrum sharing, intelligent load balancing, and enhanced uplink performance. Network upgrade cycles, rising traffic volumes from enterprise and consumer applications, and accelerated rollout of small cells drive stronger adoption. This segment benefits further from its compatibility with virtualized and centralized architectures that optimize cost efficiency and improve network agility.
- For instance, HRMavenir Systems, Inc. advances 5G C-RAN performance through its cloud-native Open vRAN platform, which runs on commercial off-the-shelf hardware and supports Layer 1 acceleration with its Inline Layer 1 Accelerator, capable of delivering up to 100 Gbps fronthaul throughput and processing 16 transmit/16 receive MIMO layers in real time.
By Technology
The Centralized technology segment dominates the market with an estimated 55–60% share, reinforced by its ability to consolidate baseband units and streamline network management across heterogeneous environments. Its uptake grows as operators seek to reduce site-level hardware complexity and enhance cooperative processing between cells. Key drivers include improved energy efficiency, simplified upgrade pathways, and effective utilization of shared computing resources. Centralized C-RAN remains the preferred choice for operators pursuing coverage enhancement and consistent performance across dense urban deployments while preparing infrastructure for fully virtualized layers.
Key Growth Drivers
Rising 5G Network Densification
5G deployment accelerates the need for highly scalable radio access architectures, positioning C-RAN as a core enabler of dense network rollouts. Operators adopt centralized processing to reduce latency, optimize spectrum use, and support growing traffic loads from enhanced mobile broadband and massive IoT. C-RAN also improves network utilization through dynamic resource pooling, allowing operators to manage fluctuating demand efficiently. Its ability to support advanced antenna systems, such as massive MIMO, strengthens adoption, as operators pursue cost-efficient and future-ready infrastructure modernization.
- For instance, Huawei Technologies Co., Ltd. enhances densification through its MetaAAU platform, which integrates 384 antenna elements and delivers up to 10 dB higher uplink coverage compared with earlier designs, while supporting 200 MHz instantaneous bandwidth to handle heavy fronthaul loads in centralized 5G deployments.
Growing Demand for Openness and Virtualization
Operators increasingly shift toward open and virtualized RAN frameworks to reduce vendor lock-in, enhance interoperability, and enable flexible scaling. C-RAN aligns with this need by decoupling hardware and software while integrating virtual baseband units that support multi-vendor configurations. Virtualization improves operational agility and simplifies updates without hardware disruptions. Enterprises and telecom providers leverage this architecture to improve lifecycle management and streamline network upgrades. C-RAN’s compatibility with open-RAN initiatives further accelerates investment, especially in regions pursuing cloud-native and software-defined network expansion.
- For instance, Samsung Electronics Co., Ltd. has advanced openness through its vRAN platform (including vRAN 3.0 updates), which uses in-house software optimization engines to efficiently process Layer-1 tasks on general-purpose CPUs. This approach has been validated during large-scale live operator deployments using its 7.2x O-RAN compliant radios.
Cost Optimization and Energy Efficiency Requirements
Network operators face rising operational expenses due to increasing user traffic, device proliferation, and power consumption across distributed cell sites. C-RAN delivers cost efficiency by centralizing baseband processing, reducing site-level hardware footprint, and lowering maintenance spending. Its pooled resource model decreases redundant capacity and enhances base station energy efficiency, enabling sustainable network growth. The architecture supports intelligent load balancing, powering down underutilized resources during low-traffic periods. These combined benefits make C-RAN a strategic choice for operators managing long-term economic and environmental performance targets.
Key Trends & Opportunities
Shift Toward Cloud-Native and Edge-Integrated Architectures
A major trend involves integrating C-RAN with cloud-native cores and edge computing to deliver ultra-low-latency services. Cloud-native platforms enable containerized network functions, improving scalability and operational automation. Edge-aligned C-RAN architectures support latency-sensitive applications such as AR/VR, industrial automation, and autonomous systems. This convergence enhances dynamic resource scheduling and reduces backhaul loads. The opportunity lies in enabling new commercial use cases for carriers and enterprises while building a highly programmable RAN environment aligned with 5G standalone evolution.
- For instance, Altiostar Networks demonstrated cloud-native readiness through its vRAN software deployed by Rakuten Mobile, where more than 4,000 virtualized sites were launched using containerized DU/CU functions capable of processing over 1 Gbps throughput per sector on commercial x86 hardware, validating real-world edge integration performance.
Increasing Adoption of AI-Driven RAN Optimization
AI and machine learning play a growing role in improving C-RAN efficiency. Operators leverage AI-based algorithms to predict traffic patterns, optimize spectrum allocation, and automate baseband unit configuration. Intelligent orchestration enhances real-time decision-making and ensures consistent quality of service across dense urban networks. AI also strengthens energy management by identifying redundant workloads and optimizing resource allocation. This trend creates new opportunities for vendors offering AI-enabled RAN software, analytics platforms, and autonomous network management tools.
- For instance, Intel’s new Xeon 6 SoC, unveiled at MWC 2025, integrates AI acceleration via Intel AVX and AMX instructions and delivers up to 3.2× AI RAN performance improvement over previous generations, without requiring discrete AI chips.
Expansion of Private 5G and Enterprise Connectivity
Enterprises deploying private 5G solutions increasingly adopt C-RAN to achieve centralized control, predictable performance, and secure network management. Industries such as manufacturing, logistics, and mining benefit from C-RAN’s ability to support high device densities and mission-critical communication needs. The architecture’s scalability enables efficient deployment across large campuses while reducing hardware requirements. This trend creates opportunities for service providers and system integrators to develop customized, cloud-managed RAN solutions tailored to enterprise digital transformation initiatives.
Key Challenges
High Initial Investment and Infrastructure Complexity
Despite long-term cost efficiency, C-RAN requires significant upfront investment in high-capacity fronthaul networks, centralized processing units, and cloud infrastructure. Operators must upgrade fiber connectivity to support demanding latency and bandwidth requirements, especially across large geographical areas. Integrating legacy RAN components with centralized architectures increases deployment complexity. Managing interoperability across multi-vendor systems also requires advanced orchestration capabilities. These challenges can slow adoption, particularly for operators with constrained capital expenditure budgets or limited access to fiber networks.
Fronthaul Latency and Bandwidth Limitations
Fronthaul performance remains a critical barrier for large-scale C-RAN adoption. The architecture demands extremely low latency and high-bandwidth links between remote radio units and centralized baseband processing. In regions with limited fiber infrastructure, operators face constraints that affect overall network performance and reliability. High latency can reduce coordination efficiency and degrade advanced features such as massive MIMO. Ensuring consistent fronthaul quality requires substantial investment and careful network planning, making it a persistent challenge within emerging and rural markets.
Regional Analysis
North America
North America holds around 30% of the global C-RAN market due to strong 5G investments, extensive fiber infrastructure, and early adoption of virtualized RAN solutions. Major operators accelerate cloud-centric network modernization to support growing mobile traffic and enterprise digitalization. The region benefits from advanced cloud ecosystems and active collaboration between telecom vendors and hyperscalers. Urban densification projects and edge deployment programs further strengthen demand for centralized RAN architectures. The United States leads regional growth, supported by steady migration toward open and cloud-native RAN platforms across large metropolitan markets.
Europe
Europe accounts for nearly 25% of the C-RAN market, driven by accelerated 5G spectrum rollout, energy-efficiency mandates, and an expanding focus on open and interoperable RAN frameworks. Operators in Western Europe prioritize centralized architectures to reduce operational costs and improve network resource utilization. The region benefits from strong regulatory support for cloud-native transition, encouraging adoption across Germany, France, and the UK. Fiber expansion projects, combined with rising demand for low-latency connectivity in industrial and public-sector applications, continue to strengthen uptake. Eastern Europe shows emerging potential as operators scale 5G investments.
Asia-Pacific
Asia-Pacific leads the global C-RAN market with approximately 35% share, supported by large-scale 5G deployments, expanding urban populations, and accelerated fiber backbone modernization. China, Japan, and South Korea remain major adopters due to extensive government-backed network transformation programs and early investment in cloud-native RAN. The region experiences high mobile data consumption, prompting operators to deploy centralized architectures for improved spectral efficiency and cost optimization. Rapid enterprise digitization across manufacturing and logistics further supports demand. Southeast Asian markets also exhibit strong potential as operators expand network densification and invest in green, energy-efficient RAN infrastructure.
Latin America
Latin America captures close to 5% of the global C-RAN market, supported by progressive 5G trials, expanding fiber availability, and growing operator interest in network cost optimization. Countries such as Brazil, Mexico, and Chile lead adoption as they modernize legacy RAN infrastructure. C-RAN supports operators’ need to manage rising data traffic while minimizing energy and hardware costs across dense urban regions. Despite economic constraints and uneven infrastructure readiness, the region shows increasing interest in cloud-native and virtualized networks. Continued investment in high-capacity fronthaul will play a critical role in accelerating regional adoption.
Middle East & Africa
The Middle East & Africa region represents roughly 5% of the C-RAN market, with growth driven by selective 5G rollouts and increasing investment in advanced telecom infrastructure. Gulf countries such as the UAE, Saudi Arabia, and Qatar deploy centralized RAN architectures to strengthen spectrum usage and support smart-city initiatives. Fiber expansion and cloud integration programs are gradually improving deployment feasibility across urban centers. However, adoption remains uneven due to limited high-capacity fronthaul in developing markets. Emerging enterprise demand and government-led digital transformation initiatives provide long-term growth prospects across key regional economies.
Market Segmentations:
By Component:
- Solution
- Services
By Network Type:
- 2G/3G
- 4G
By Technology:
- Centralized
- Virtualized
By Geography
- North America
- U.S.
- Canada
- Mexico
- Europe
- Germany
- France
- U.K.
- Italy
- Spain
- Rest of Europe
- Asia Pacific
- China
- Japan
- India
- South Korea
- South-east Asia
- Rest of Asia Pacific
- Latin America
- Brazil
- Argentina
- Rest of Latin America
- Middle East & Africa
- GCC Countries
- South Africa
- Rest of the Middle East and Africa
Competitive Landscape
The competitive landscape of the C-RAN market features leading innovators such as Cisco Systems, Inc., HRMavenir Systems, Inc., Huawei Technologies Co., Ltd., Samsung Electronics Co., Ltd., Altiostar Networks, Intel Corporation, ASOCS Ltd., Telefonaktiebolaget LM Ericsson, NEC Corporation, and Fujitsu Limited. The C-RAN market continues to intensify as vendors accelerate innovation in cloud-native architectures, open interfaces, and virtualized RAN capabilities. Companies focus on enhancing fronthaul performance, reducing latency, and improving coordination across centralized baseband units to support large-scale 5G deployments. The market shows a clear shift toward software-driven solutions, enabling operators to scale capacity dynamically and optimize network resources. Vendors increasingly integrate AI-based automation and analytics to strengthen self-optimizing network functions and energy-efficient operations. Strategic partnerships with hyperscalers, semiconductor firms, and infrastructure providers further shape competition, as firms work to deliver interoperable, cost-effective, and high-performance C-RAN platforms aligned with global network modernization and enterprise connectivity needs.
Key Player Analysis
- Cisco Systems, Inc.
- HRMavenir Systems, Inc.
- Huawei Technologies Co., Ltd.
- Samsung Electronics Co., Ltd.
- Altiostar Networks
- Intel Corporation
- ASOCS Ltd.
- Telefonaktiebolaget LM Ericsson
- NEC Corporation
- Fujitsu Limited
Recent Developments
- In June 2025, Ericsson and Telstra unveiled the AIR 3284, the world's first 5G triple-band FDD Massive MIMO radio, as part of a nationwide modernization effort to boost downlink and uplink capacity and improve performance across Australia.
- In December 2024, Nokia and Du deployed the first commercial 5G Cloud RAN solutions in the Middle East, supporting the UAE's digital transformation and advanced use cases like AI and ML in different applications.
- In July 2024, Nokia and Airtel successfully completed India's first 5G non-standalone (NSA) Cloud RAN trial, achieving a peak speed of 1.2 Gbps. This trial used Nokia's vDU and vCU software on standard x86 hardware and ran over-the-air using 3.5 GHz for 5G and 2100 MHz for 4G spectrum.
- In February 2024, AT&T and Ericsson successfully completed a cloud RAN call, which marks the first time AT&T has handled commercial traffic on cloud RAN sites, specifically starting with sites south of Dallas, Texas. This is a key step in AT&T's plan to build a more open and interoperable 5G network by using virtualization and separating the hardware and software components of its radio access network (RAN)
Report Coverage
The research report offers an in-depth analysis based on Component, Network Type, Technology and Geography. It details leading market players, providing an overview of their business, product offerings, investments, revenue streams, and key applications. Additionally, the report includes insights into the competitive environment, SWOT analysis, current market trends, as well as the primary drivers and constraints. Furthermore, it discusses various factors that have driven market expansion in recent years. The report also explores market dynamics, regulatory scenarios, and technological advancements that are shaping the industry. It assesses the impact of external factors and global economic changes on market growth. Lastly, it provides strategic recommendations for new entrants and established companies to navigate the complexities of the market.
Future Outlook
- The market will expand as operators continue large-scale 5G deployments requiring centralized and virtualized radio access architectures.
- Cloud-native RAN adoption will rise as carriers shift toward containerized and scalable network functions.
- AI-driven automation will strengthen network optimization and improve performance across dense and dynamic environments.
- Edge computing integration will accelerate to support low-latency applications and distributed processing needs.
- Open RAN frameworks will gain broader acceptance, increasing interoperability and reducing dependency on single-vendor ecosystems.
- Energy-efficient C-RAN solutions will grow in demand as operators prioritize sustainability and cost control.
- Enterprise private networks will adopt C-RAN to enhance flexibility, security, and traffic management in mission-critical environments.
- Fiber fronthaul expansion will drive deployment readiness in both developed and emerging markets.
- Vendors will focus on collaborative ecosystems that combine cloud, semiconductor, and telecom expertise.
- The market will shift toward software-centric models that emphasize agility, automation, and lifecycle efficiency.
Request a Free Sample
Fill in your details and we'll send you a free sample report.
- Sample data tables & charts
- Research methodology
Need a Custom Version of This Report?
Tailor the scope, geography, or segments to your exact requirements.
- Custom geography or segment scope
- Direct access to our analyst team
Frequently Asked Questions
What is the current market size for C-RAN Market, and what is its projected size in 2032?
At what Compound Annual Growth Rate is the C-RAN Market projected to grow between 2025 and 2032?
Which C-RAN Market segment held the largest share in 2024?
What are the primary factors fueling the growth of the C-RAN Market?
Who are the leading companies in the C-RAN Market?
Which region commanded the largest share of the C-RAN Market in 2024?
Table of Content
Chapter 1. Report Introduction
- 1.1 Report Description & Purpose
- 1.1.1 Report Title & Market Definition
- 1.1.2 Unique Selling Propositions (USP) & Key Differentiators
- 1.1.3 Value Proposition for Stakeholders
- 1.2 Research Objectives
- 1.2.1 Market Sizing Objectives (Volume & Revenue)
- 1.2.2 Segmentation Objectives
- 1.2.3 Competitive Intelligence Objectives
- 1.2.4 Forecast & Scenario Objectives
- 1.3 Report Scope
- 1.3.1 C-RAN Scope – Types & Subtypes Covered
- 1.3.2 Geographic Scope – Regions & Countries Covered
- 1.3.3 Historical Period, Base Year & Forecast Period (2024; forecast to 2032)
- 1.3.4 Inclusions & Exclusions
- 1.4 HS Code & Classification Framework
- 1.5 Currency, Units & Pricing Basis
- 1.6 Target Stakeholders
- 1.7 Limitations & Assumptions
Chapter 2. Executive Summary
- 2.1 Global C-RAN Market Snapshot
- 2.1.1 Market Size – Historical (2024) & Forecast (2024-2032) (2024: USD 3708 million → 2032: USD 16592.74 million)
- 2.1.2 Volume & Revenue – Global Totals
- 2.1.3 Key Market Highlights – Top Five Facts
- 2.2 C-RAN Market Segmentation Snapshot
- 2.2.1 Market Split by Region – 2024 vs. 2032
- 2.3 Competitive Snapshot
- 2.3.1 Top 10 Players by Revenue Share – 2024
- 2.3.2 Top 10 Players by Volume Share – 2024
- 2.3.3 Recent Strategic Developments (18-Month Summary)
- 2.4 Key Investment Highlights & Strategic Conclusions
Chapter 3. C-RAN Market Dynamics & Industry Analysis
- 3.1 Market Overview & Context
- 3.1.1 C-RAN Market Position in the Broader Automotive Value Chain
- 3.1.2 OEM vs. Replacement Market Dynamics
- 3.1.3 Market Maturity & Development Stage by Region
- 3.2 C-RAN Market Drivers
- 3.3 C-RAN Market Restraints & Challenges
- 3.4 C-RAN Market Opportunities
- 3.5 Porter's Five Forces Analysis
- 3.5.1 Threat of New Entrants
- 3.5.2 Bargaining Power of Suppliers
- 3.5.3 Bargaining Power of Buyers
- 3.5.4 Threat of Substitutes
- 3.5.5 Competitive Rivalry – Intensity Assessment
- 3.6 C-RAN Value Chain Analysis
- 3.6.1 Upstream – Raw Material/Input Suppliers
- 3.6.1.1 Raw Material/Input 1
- 3.6.1.2 Raw Material/Input 2
- 3.6.1.3 Raw Material/Input 3
- 3.6.2 Midstream – Production/Manufacturing/Service Delivery
- 3.6.2.1 Production/Process Overview
- 3.6.2.2 Key Facility Locations & Capacity by Manufacturer
- 3.6.3 Downstream – Distribution & End Consumer
- 3.6.3.1 Primary Channel – B2B/OEM
- 3.6.3.2 Secondary Channels – Dealer, Retail, Online, Direct
- 3.6.4 Value Chain Profitability Analysis
- 3.6.1 Upstream – Raw Material/Input Suppliers
- 3.7 PESTEL Analysis
- 3.7.1 Political Factors
- 3.7.2 Economic Factors
- 3.7.3 Social Factors
- 3.7.4 Technological Factors
- 3.7.5 Environmental Factors
- 3.7.6 Legal Factors
- 3.8 C-RAN Supply Chain Analysis
- 3.8.1 Raw Material/Input Supply Risk Assessment
- 3.8.2 Manufacturing Concentration Risk (Geographic Exposure)
- 3.8.3 Trade Disruption Impact Analysis
- 3.9 Regulatory & Policy Landscape
Note: The regulatory and policy landscape section covers regulations based on their applicability to the market, C-RAN category, geography, and scope of the study. Only regulatory frameworks with a material impact on operations, compliance, trade, sustainability, or market access are analyzed in detail.
Chapter 4. Key Investment Pockets & Opportunity Analysis
- 4.1 C-RAN Market Attractiveness Analysis
- 4.1.1 By Region – Investment Attractiveness Matrix (Volume × CAGR)
- 4.2 Absolute Revenue Growth Opportunity
- 4.2.1 By Region – Absolute USD Growth Through 2032
- 4.3 Incremental Volume Opportunity
- 4.3.1 By Region – Incremental Volume Through 2032
- 4.3.2 Segment – Incremental Volume
- 4.4 Emerging Submarket Opportunity Deep Dive (Subject to Applicability)
- 4.5 Emerging Market Opportunity Scorecards
- 4.5.1 United States
- 4.5.2 Europe
- 4.5.3 Asia
- 4.5.4 Middle East & Africa
Note: Emerging Market Opportunity Scorecards will be included based on relevance and strategic importance. Regions listed are indicative and may vary depending on data availability and market dynamics.
Chapter 5. C-RAN Import-Export Analysis & Trade Flows
- 5.1 Global Trade Overview
- 5.1.1 Global Export Value by Country (2024)
- 5.1.2 Global Export Volume by Country (2024)
- 5.1.3 Global Import Value by Country (2024)
- 5.1.4 Global Import Volume by Country (2024)
- 5.1.5 Net Trade Balance by Country (2024)
- 5.2 Export Analysis – Segment
- 5.2.1 Type 1 (HS Code)
- 5.2.2 Type 2 (HS Code)
- 5.2.3 Type 3 (HS Code)
- 5.2.4 Type 4 (HS Code)
- 5.2.5 Type 5 (HS Code)
- 5.3 Import Analysis – Segment
- 5.3.1 Type 1 (HS Code)
- 5.3.2 Type 2 (HS Code)
- 5.3.3 Type 3 (HS Code)
- 5.3.4 Type 4 (HS Code)
- 5.3.5 Type 5 (HS Code)
- 5.4 Average Unit Trade Prices
- 5.4.1 Average Export Price – Segment & Country
- 5.4.2 Average Import Price – Segment & Source Country
- 5.4.3 Price Trends (2024)
- 5.5 Key Trade Route Analysis
- 5.5.1 Trade Route 1
- 5.5.2 Trade Route 2
- 5.5.3 Trade Route 3
- 5.5.4 Trade Route 4
- 5.5.5 Trade Route 5
- 5.6 Trade Policy Impact Assessment
- 5.6.1 US Anti-Dumping & Section 301 Tariffs
- 5.6.2 EU Customs Union Impact
- 5.6.3 Major Free Trade Agreements
- 5.6.4 USMCA Rules of Origin
Note: Trade policy analysis will be included only where relevant to the C-RAN market.
Chapter 6. Competitive Landscape & Company Benchmarking
- 6.1 C-RAN Market Concentration & Structure
- 6.1.1 Herfindahl-Hirschman Index (HHI) – vs. 2024
- 6.1.2 Tier 1, Tier 2 & Tier 3 Market Structure
- 6.1.3 Global, Regional & Local Player Dynamics
- 6.2 C-RAN Market Share Analysis – 2024
- 6.2.1 Global Revenue Share by Company
- 6.2.2 Global Volume Share by Company
- 6.2.3 Regional Revenue Share
- 6.2.4 Market Share Evolution ( vs. 2024)
- 6.2.5 OEM Segment Share by Company
- 6.2.6 Replacement Segment Share by Company
- 6.3 Production/Delivery Capacity & Facility Analysis
- 6.3.1 Global Installed Capacity
- 6.3.2 Capacity Utilization Rates
- 6.3.3 Production/Output Volume
- 6.3.4 Facility Locations & Capacity Map
- 6.3.5 Planned Capacity Additions
- 6.4 C-RAN Competitive Benchmarking Matrix
- 6.4.1 Revenue, Volume, CAGR & Profitability Comparison
- 6.4.2 Channel Revenue Mix
- 6.4.3 Geographic Revenue Exposure
- 6.4.4 R&D Intensity
- 6.4.5 Sustainability Maturity
- 6.5 Strategic Developments in C-RAN (Last 24 Months)
- 6.5.1 Mergers, Acquisitions & Divestments
- 6.5.2 New C-RAN Launches
- 6.5.3 Facility Expansions
- 6.5.4 Strategic Alliances, Joint Ventures & Partnerships
- 6.5.5 Distribution Expansion & Market Entry
- 6.5.6 Sustainability & ESG Initiatives
- 6.6 Competitive Strategy Mapping
- 6.6.1 Leader, Challenger, Follower & Niche Classification
- 6.6.2 Pricing Strategy Comparison
- 6.6.3 Channel Strategy Matrix
Note: Strategic developments are included based on their materiality and the availability of reliable information.
Chapter 7. Global C-RAN Market – By Distribution Channel
- 7.1 Segment Overview
- 7.1.1 Volume & Revenue Split by Channel (2024 & 2032)
- 7.1.2 Channel Mix Evolution (2024-2032)
Chapter 8. Regional Market Analysis – Global Overview
- 8.1 Global Regional Overview
- 8.1.1 Regional Volume Share
- 8.1.2 Regional Revenue Share
- 8.1.3 Regional Volume by Region
- 8.1.4 Regional Revenue by Region
- 8.1.5 Regional Forecast Through 2032
- 8.2 Cross-Regional Segment Analysis
- 8.2.1 By Distribution Channel
- 8.2.2 By Brand/Price Tier
Chapter 9. North America C-RAN Market
- 9.1 United States
- 9.2 Canada
- 9.3 Mexico
Chapter 10. Europe C-RAN Market
- 10.1 Germany
- 10.2 France
- 10.3 Italy
- 10.4 United Kingdom
- 10.5 Spain
- 10.6 Poland
- 10.7 Russia
- 10.8 Netherlands
- 10.9 Belgium
- 10.10 Sweden
- 10.11 Denmark
- 10.12 Norway
- 10.13 Rest of Europe
Chapter 11. Asia Pacific C-RAN Market
- 11.1 China
- 11.2 India
- 11.3 Japan
- 11.4 South Korea
- 11.5 Thailand
- 11.6 Indonesia
- 11.7 Vietnam
- 11.8 Malaysia
- 11.9 Australia
- 11.10 Rest of Asia Pacific
Chapter 12. Latin America C-RAN Market
- 12.1 Brazil
- 12.2 Argentina
- 12.3 Colombia
- 12.4 Chile
- 12.5 Rest of Latin America
Chapter 13. Middle East C-RAN Market
- 13.1 Saudi Arabia
- 13.2 United Arab Emirates
- 13.3 Turkey
- 13.4 Israel
- 13.5 Iran
- 13.6 Rest of the Middle East
Chapter 14. Africa C-RAN Market
- 14.1 South Africa
- 14.2 Egypt
- 14.3 Nigeria
- 14.4 Morocco
- 14.5 Rest of Africa
Chapter 15. C-RAN Company Profiles
- 15.1 [Company 01]
- 15.1.1 Company Overview
- 15.1.2 Key Management Personnel
- 15.1.3 Products & Services Portfolio
- 15.1.4 Financial Performance
- 15.1.5 Key Market Focus & Geographic Presence
- 15.1.6 Recent Developments & Strategic Initiatives
Note: The company profile list is preliminary and may change based on research findings, market developments, data availability, and client requirements.
Chapter 16. Appendices
- Appendix A – List of Abbreviations & Acronyms
- Appendix B – Industry Classification Code Reference – Full Series
- Appendix C – Production & Capacity Data Tables
- Appendix D – End-Use & Demand Base Tables
- Appendix E – Consumption & Replacement Rate Assumptions
- Appendix F – ASP Reference Tables
- Appendix G – Manufacturing & Facility Database
- Appendix H – Import-Export Data Tables
- Appendix I – Regulatory Summary Tables
- Appendix J – Primary Research Participant List (Anonymized)
- Appendix K – Primary Research Questionnaire Framework
- Appendix L – Data Sources & Bibliography
- Appendix M – Market Size Divergence & Source Comparison
Chapter 17. Research Methodology
- 17.1 Research Framework & Philosophy
- 17.2 Secondary Research – Sources, Hierarchy & Data Extraction
- 17.3 Data Modeling – Bottom-Up & Top-Down Market Sizing
- 17.4 Primary Research – Stakeholder Framework, LOI & Sample Sizes
- 17.5 Forecast Methodology – Regression, Scenario & Sensitivity Analysis
- 17.6 Quality Control – Four-Layer Validation Framework
- 17.7 Limitations & Standard Assumptions
- 17.8 Disclaimer
