Market Overview:
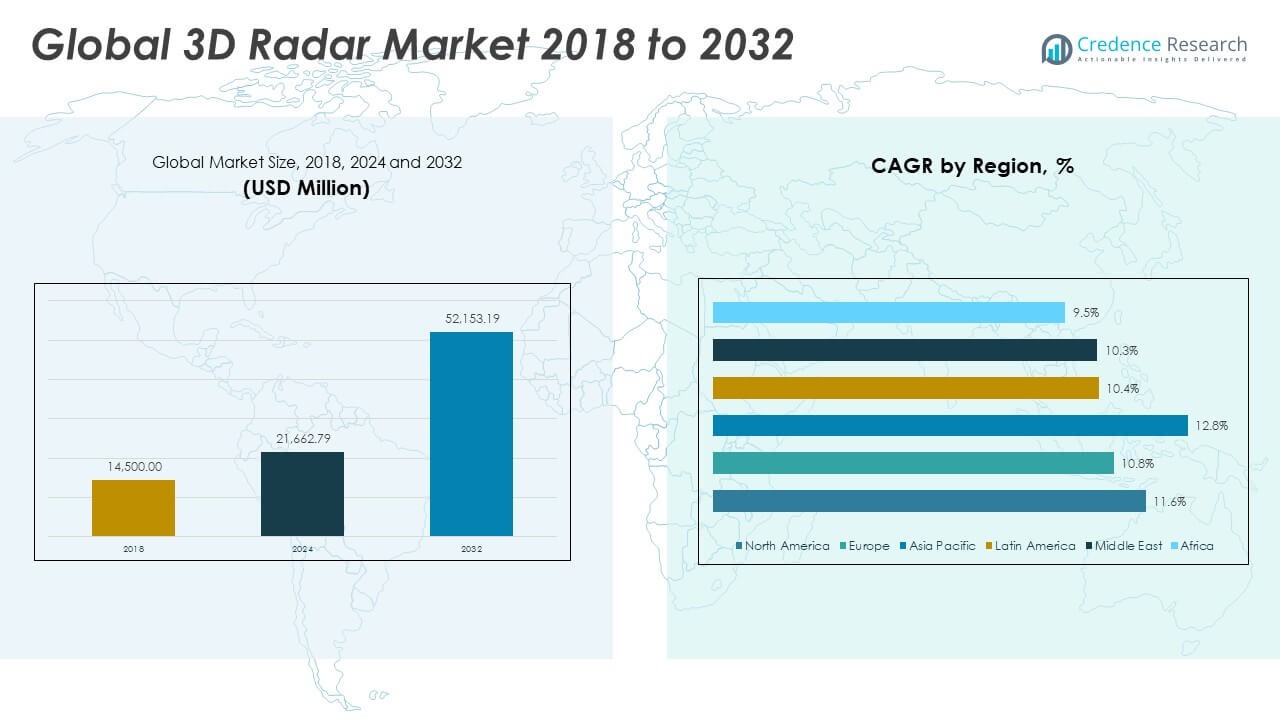
The Global 3D Radar Market size was valued at USD 14,500.00 million in 2018 to USD 21,662.79 million in 2024 and is anticipated to reach USD 52,153.19 million by 2032, at a CAGR of 11.63% during the forecast period.
| REPORT ATTRIBUTE |
DETAILS |
| Historical Period |
2019-2022 |
| Base Year |
2023 |
| Forecast Period |
2024-2032 |
| 3D Radar Market Size 2024 |
USD 21,662.79 Million |
| 3D Radar Market, CAGR |
11.63% |
| 3D Radar Market Size 2032 |
USD 52,153.19 Million |
Several key factors are propelling the radar market’s growth. One of the primary drivers is defense modernization—nations are investing heavily in radar technologies for surveillance, missile defense, and border security. In parallel, the automotive sector is witnessing rapid integration of radar-based Advanced Driver Assistance Systems (ADAS), essential for collision avoidance, adaptive cruise control, and autonomous navigation. Additionally, the aerospace and aviation industries are expanding their use of radar for air traffic control and aircraft detection as global air travel rebounds and infrastructure modernizes. Innovations in digital radar, synthetic aperture radar (SAR), and AI-enhanced radar systems are unlocking improved resolution, real-time analytics, and lower detection errors, further expanding their utility. Moreover, radar’s role in weather monitoring, environmental tracking, and space-based Earth observation is growing in importance, with governments and private firms investing in meteorological radar and satellite-based synthetic aperture systems. The convergence of radar with emerging technologies like the Internet of Things (IoT), AI, and 5G is further accelerating adoption across industries.
Regionally, North America holds a dominant share of the Global 3D Radar Market, driven by strong defense spending, technological leadership, and the presence of major companies such as Lockheed Martin, Northrop Grumman, and Raytheon. The U.S. continues to invest in radar modernization programs across its military branches and civil aviation systems. Asia-Pacific, however, is emerging as the fastest-growing region, supported by escalating defense budgets in countries like China and India, significant investments in transportation infrastructure, and growing adoption of automotive radar in smart vehicles. China’s rapid expansion of airports and India’s border security initiatives are prime contributors to regional demand. Europe follows as a major player, driven by stringent automotive safety regulations, strong research and development in radar technologies, and the presence of key radar system suppliers such as Thales, Leonardo, and Saab. Meanwhile, the Middle East and Africa are witnessing increasing radar deployments for border surveillance and maritime security, and Latin America is gradually expanding its radar footprint, particularly in aviation safety and coastal monitoring. This global landscape underscores the radar market’s broad relevance and enduring growth potential across both established and emerging economies.
Access crucial information at unmatched prices!
Request your sample report today & start making informed decisions powered by Credence Research Inc.!
Download Sample
Market Insights:
- The Global 3D Radar Market was valued at USD 21,662.79 million in 2024 and is projected to reach USD 52,153.19 million by 2032, expanding at a CAGR of 11.63%, driven by rising multi-industry demand and technology convergence.
- Defense modernization remains the core growth engine, with countries such as the U.S., China, and India prioritizing radar investments across air, land, and maritime platforms to enhance threat detection and national security.
- Automotive radar systems are gaining traction, supported by regulations mandating advanced driver assistance systems (ADAS) and increased production of electric and autonomous vehicles in North America, Europe, and Asia.
- The aviation sector is accelerating radar deployment for air traffic management and surveillance, with infrastructure expansions in China, India, and the Middle East creating strong procurement pipelines.
- The market is diversifying beyond defense and transportation, as radar finds new applications in weather forecasting, industrial automation, perimeter monitoring, and smart infrastructure projects.
- High acquisition and integration costs hinder adoption in cost-sensitive regions, limiting the reach of advanced radar platforms across mid-tier civilian and emerging markets.
- North America leads the market in value share, while Asia-Pacific is the fastest-growing region due to escalating defense budgets, infrastructure development, and rising automotive radar integration.
Market Drivers:
Defense Modernization Programs Drive Core Demand across Air, Land, and Maritime Domains:
Global defense spending continues to rise, with countries upgrading their radar capabilities to enhance early warning, surveillance, and threat detection systems. Military modernization initiatives prioritize radar technologies that offer faster response times, higher resolution, and improved electronic counter-countermeasures. Nations such as the United States, China, and India are actively procuring next-generation radar systems for fighter aircraft, naval fleets, and ground-based installations. The Global 3D Radar Market benefits from these sustained investments, which ensure stable demand from defense contractors and armed forces. Active electronically scanned array (AESA) and over-the-horizon radar systems are gaining preference for their ability to detect stealth aircraft and cruise missiles. It reflects a strategic focus on national security in both developed and emerging economies.
- For instance, Raytheon Technologies delivered it’s AN/APG-79(V)4 Active Electronically Scanned Array (AESA) radar to the U.S. Marine Corps in 2024, equipping F/A-18C/D aircraft with the capability to detect and track targets at ranges exceeding 150 nautical miles and providing a 60% improvement in target resolution compared to legacy systems.
Surge in Automotive Radar Deployment Fuels Long-Term Commercial Growth:
The automotive sector has emerged as a high-potential application area, especially with the advancement of autonomous driving and vehicle safety technologies. Radar sensors support key functions such as blind-spot monitoring, forward collision warning, adaptive cruise control, and lane-keeping assistance. Regulatory bodies in Europe, North America, and Asia are enforcing strict vehicle safety standards, accelerating radar integration into mid-range and premium vehicles. The Global 3D Radar Market gains momentum from the rising volume of passenger vehicle production and the shift toward electric and connected cars. Leading automakers collaborate with radar module manufacturers to meet both safety and design goals. It underscores the technology’s adaptability and increasing relevance in everyday transportation.
- For instance, Continental AG shipped more than 100 million radar sensors for automotive applications globally by the end of 2024, supporting advanced driver assistance systems (ADAS) in vehicles from over 30 major automakers.
Air Traffic Management and Aviation Infrastructure Expansion Strengthen Adoption:
Radar plays a critical role in civilian aviation, particularly in air traffic control, ground surveillance, and collision avoidance systems. Airport authorities are expanding radar deployments to handle higher air traffic volumes and support new infrastructure projects. The construction of new airports in China, India, and the Middle East creates a steady pipeline of procurement opportunities. The Global 3D Radar Market responds to the aviation sector’s demand for reliable, long-range, weather-resistant systems that improve operational safety and reduce flight delays. Secondary applications in drone monitoring and unmanned aircraft systems are also emerging. It ensures continued radar relevance in both conventional and evolving aviation segments.
Advanced Technologies and Multi-Industry Integration Expand Market Scope:
Rapid advancements in digital signal processing, artificial intelligence, and sensor fusion are enhancing radar functionality across industries. Radar systems now offer superior clutter suppression, real-time imaging, and automated threat classification capabilities. The Global 3D Radar Market increasingly supports diverse applications, from meteorological forecasting to industrial automation and smart infrastructure. Commercial sectors adopt radar-based solutions for perimeter security, environmental monitoring, and intelligent traffic systems. It illustrates how radar’s precision and reliability continue to attract new industries beyond traditional defense and aviation. Technological convergence is not only improving performance but also reducing size and power consumption, making radar viable for mobile and embedded systems.
Market Trends:
Rising Use of Passive Radar Systems for Covert Surveillance and Low-Power Operations:
The Global 3D Radar Market is witnessing increased adoption of passive radar systems that operate without emitting signals, relying instead on existing electromagnetic sources such as broadcast and communication signals. These systems enhance stealth and minimize detection risks, which makes them ideal for covert operations and urban surveillance. Passive radar consumes less power and causes minimal electromagnetic interference, making it suitable for civilian and military use alike. Governments and private defense firms are testing its application in border monitoring and homeland security. It supports multi-static configurations and can function in dense environments without performance degradation. Passive radar’s capability to detect targets without revealing its location strengthens its value in contested and electronically saturated zones.
- For instance, HENSOLDT’s TwInvis passive radar system was deployed in multiple European countries in 2024, demonstrating the ability to detect and track aircraft at distances up to 250 km using only ambient radio and TV signals.
Growing Integration of Radar in Space-Based Earth Observation Programs:
Government space agencies and commercial satellite operators are increasingly deploying synthetic aperture radar (SAR) for high-resolution Earth observation. The Global 3D Radar Market benefits from SAR’s ability to function in all weather conditions and during day or night, enabling continuous ground imaging. It supports disaster management, agricultural monitoring, and infrastructure planning through real-time, wide-area coverage. Several countries are investing in satellite radar constellations to monitor climate change, deforestation, and land subsidence. These programs rely on radar for its independence from optical limitations and resilience to environmental interference. The commercial sector is also entering this domain, offering radar imaging-as-a-service to industries and governments.
- For instance, Capella Space launched six SAR satellites in 2024, providing sub-0.5 meter resolution imagery with a revisit rate of up to 15 times per day for any location on Earth. The European Space Agency’s Sentinel-1 constellation delivered over 2 petabytes of SAR data in 2024, supporting climate monitoring and land subsidence tracking for more than 3,000 institutional and commercial users worldwide.
Increased Use of Radar for Drone Detection and Airspace Security:
The proliferation of commercial and recreational drones has created new challenges in airspace security, prompting airports, military bases, and urban centers to install radar-based drone detection systems. The Global 3D Radar Market sees growth in this niche segment due to its ability to detect low-flying, small-profile UAVs that often evade traditional surveillance. It supports 3D tracking, object classification, and real-time alerts for unauthorized aerial activity. Radar enables automated threat recognition and can trigger integrated countermeasures such as jammers or signal interceptors. Governments and private infrastructure operators rely on radar to protect sensitive zones, particularly in high-traffic or high-risk areas. This application is emerging as a critical layer in modern airspace management.
Demand for Weather Radars Surges with Climate-Resilient Infrastructure Development:
As climate-related risks become more pronounced, national meteorological agencies and infrastructure planners are expanding their use of weather radar systems. The Global 3D Radar Market is responding to rising investments in Doppler and dual-polarization radar technologies to improve forecasting accuracy. It enables early warning for floods, hurricanes, and severe storms, helping mitigate human and economic losses. Urban planners and utility companies deploy weather radar data to protect infrastructure and ensure service continuity. Precision in rainfall measurement and storm tracking allows better coordination of emergency response and resource allocation. The role of radar in climate adaptation strategies is becoming essential across both developed and developing economies.
Market Challenges Analysis:
High Costs of Advanced Radar Technologies Restrict Widespread Adoption Across Budget-Constrained Sectors:
The Global 3D Radar Market faces significant pressure from the high development, procurement, and maintenance costs associated with advanced radar systems. Cutting-edge radar platforms, such as active electronically scanned arrays (AESA) and synthetic aperture radar (SAR), demand substantial investment in specialized components, signal processing units, and integration services. Smaller governments, emerging economies, and cost-sensitive industries often struggle to allocate sufficient budgets for full-scale deployment. It limits the market’s ability to penetrate mid-tier and lower-tier customer segments. Long procurement cycles, complex regulatory clearances, and expensive testing procedures further delay project execution. These financial barriers restrict the scalability of radar programs across civilian and non-defense applications.
Spectrum Congestion and Regulatory Constraints Challenge Performance and Deployment:
Radar systems operate in tightly regulated frequency bands that are increasingly congested due to rising demand from telecommunications, satellite services, and wireless networks. The Global 3D Radar Market experiences growing challenges in securing interference-free spectrum access, especially in urban and industrial zones. It reduces radar performance in cluttered signal environments and complicates long-range detection or tracking accuracy. Compliance with varying national and international spectrum policies creates operational uncertainties and delays deployment timelines. Developers must invest in signal optimization and anti-interference technologies, which adds to overall system costs. These regulatory and environmental complexities limit radar functionality and slow its integration into dynamic, multi-use platforms.
Market Opportunities:
Expansion of Urban Mobility and Smart Infrastructure Unlocks New Radar Applications:
The Global 3D Radar Market holds strong opportunity in the development of smart cities and intelligent transportation systems. Governments are deploying radar-based sensors for traffic monitoring, congestion control, and pedestrian safety. It enhances real-time data collection for adaptive signal control and autonomous vehicle coordination. Urban infrastructure now requires non-intrusive, all-weather solutions that radar provides more effectively than traditional cameras or sensors. Smart railways, ports, and highways increasingly incorporate radar for asset tracking and operational safety. These projects create long-term demand for compact, high-resolution radar modules tailored for civilian use.
Growth in Commercial Space Sector Spurs Demand for Advanced Radar Payloads:
The surge in satellite launches and private space exploration opens a growing opportunity for radar-based Earth observation and navigation systems. The Global 3D Radar Market benefits from synthetic aperture radar (SAR) demand across environmental monitoring, disaster response, and infrastructure planning. It offers superior imaging under cloud cover and darkness, which traditional optical systems cannot match. Companies entering the satellite-as-a-service model seek reliable radar payloads to enhance mission value. It creates a new commercial layer beyond defense and aviation, positioning radar as a foundational technology in space-based applications. This trend aligns with global investment in climate resilience and geospatial analytics.
Market Segmentation Analysis:
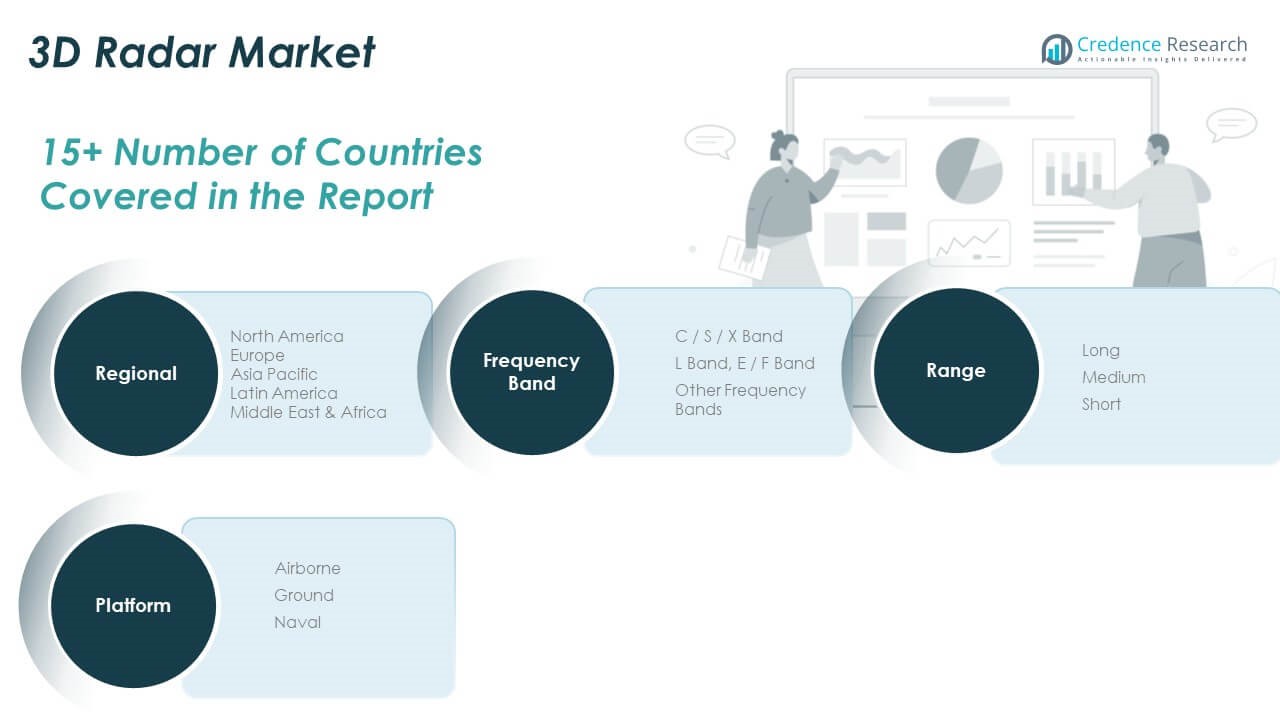
By Frequency Band
The Global 3D Radar Market is segmented into C/S/X Band, L Band and E/F Band, and Other Frequency Bands. The C/S/X Band holds the largest share, driven by its effectiveness in applications such as weather forecasting, airspace monitoring, and battlefield surveillance. These bands support high resolution and strong object discrimination at varying ranges. The L Band and E/F Band segments are well-suited for long-range tracking and early warning systems, often used in military and strategic operations. The Other Frequency Bands segment covers specialized systems designed for unique operational needs, offering flexibility across defense and commercial sectors.
- For instance, Leonardo’s RAT-31DL/M radar, operating in the L-band, was selected by NATO in 2024 for its Air Command and Control System, offering a detection range exceeding 500 km and the ability to track over 1,000 targets simultaneously.
By Range
The range-based segmentation includes Long Range, Medium Range, and Short-Range radar systems. Long-range 3D radars are critical for missile defense, space surveillance, and high-altitude threat detection. Medium-range systems serve regional defense networks and are deployed at airports for air traffic management. Short-range radar is gaining relevance in automotive, drone detection, and perimeter security due to its compact size and rapid response capabilities.
By Platform
The platform segment is categorized into Airborne, Ground, and Naval systems. The Airborne segment leads in market share, driven by increased usage in combat aircraft, UAVs, and airborne early warning systems. The Ground segment supports fixed and mobile installations for border control, air defense, and meteorological purposes. The Naval segment plays a vital role in ship-based surveillance, anti-missile systems, and coastal defense, offering real-time maritime situational awareness.
Segmentation:
By Frequency Band
- C / S / X Band
- L Band, E / F Band
- Other Frequency Bands
By Range
- Long Range
- Medium Range
- Short Range
By Platform
By Region
- North America
- Europe
- UK
- France
- Germany
- Italy
- Spain
- Russia
- Rest of Europe
- Asia Pacific
- China
- Japan
- South Korea
- India
- Australia
- Southeast Asia
- Rest of Asia Pacific
- Latin America
- Brazil
- Argentina
- Rest of Latin America
- Middle East
- GCC Countries
- Israel
- Turkey
- Rest of Middle East
- Africa
- South Africa
- Egypt
- Rest of Africa
Regional Analysis:
North America
The North America 3D Radar Market size was valued at USD 4,967.70 million in 2018, reached USD 7,326.23 million in 2024, and is anticipated to grow to USD 17,612.23 million by 2032, at a CAGR of 11.6% during the forecast period. North America holds the largest share in the Global 3D Radar Market, driven by high defense spending, strong aerospace capabilities, and technological leadership. The United States continues to invest heavily in radar modernization across all branches of the military and civil aviation. Government agencies, including the FAA and DoD, drive adoption of long-range and airborne 3D radar systems. It benefits from the presence of leading defense contractors such as Raytheon, Northrop Grumman, and Lockheed Martin. The region’s focus on homeland security and cross-border monitoring further expands ground-based radar installations.
Europe
The Europe 3D Radar Market size was valued at USD 3,526.40 million in 2018, increased to USD 5,046.84 million in 2024, and is projected to reach USD 11,419.08 million by 2032, growing at a CAGR of 10.8%. Europe commands a strong position in the market due to active R&D, stringent vehicle safety regulations, and rising defense budgets in countries like France, Germany, and the UK. The region emphasizes radar integration in air traffic control, naval systems, and border security. It supports innovation through companies such as Thales, Leonardo, and Saab. The growing need for multi-domain awareness in both military and civilian applications sustains radar deployment. Europe also advances naval 3D radar systems as part of NATO interoperability and maritime security objectives.
Asia Pacific
The Asia Pacific 3D Radar Market was valued at USD 4,274.60 million in 2018, grew to USD 6,621.14 million in 2024, and is forecasted to reach USD 17,320.12 million by 2032, registering the highest CAGR of 12.8%. Asia Pacific is the fastest-growing region in the Global 3D Radar Market, driven by expanding defense budgets and rapid infrastructure development. Countries like China, India, South Korea, and Japan are heavily investing in radar systems for air defense, coastal monitoring, and aerospace modernization. The region’s large-scale airport construction and smart transportation projects accelerate adoption of ground and airborne radar platforms. It benefits from increasing collaborations between public and private sectors in radar production. The demand for multi-layered surveillance and threat detection across land and maritime borders remains high.
Latin America
The Latin America 3D Radar Market size stood at USD 758.35 million in 2018, increased to USD 1,119.75 million in 2024, and is expected to reach USD 2,460.07 million by 2032, growing at a CAGR of 10.4%. Latin America holds a modest share in the global market but shows potential in civil aviation and coastal surveillance. Brazil and Mexico lead regional investments in radar for airport modernization and border security. It is witnessing gradual integration of short- and medium-range systems in national defense strategies. Demand for radar in weather monitoring and disaster management is also increasing. The region benefits from international defense partnerships and technology transfers.
Middle East
The Middle East 3D Radar Market was valued at USD 597.40 million in 2018, rose to USD 840.38 million in 2024, and is projected to reach USD 1,841.29 million by 2032, expanding at a CAGR of 10.3%. The market is supported by rising defense budgets and geopolitical tensions across the region. Countries such as Saudi Arabia, Israel, and the UAE are investing in cutting-edge radar for missile detection, border security, and air defense. It sees high adoption of ground-based and airborne radar platforms for both military and critical infrastructure protection. Maritime radar systems are also gaining traction due to increased activity in strategic waterways. Local partnerships and defense procurement programs strengthen regional capabilities.
Africa
The Africa 3D Radar Market size was USD 375.55 million in 2018, grew to USD 708.46 million in 2024, and is forecast to reach USD 1,500.41 million by 2032, at a CAGR of 9.5%. Africa is an emerging market in the 3D radar space, with rising needs for airspace monitoring, anti-poaching surveillance, and border control. South Africa, Egypt, and Nigeria are key markets where defense and civil aviation drive radar adoption. It faces funding limitations but gains support through international collaborations and donor programs. The region is gradually integrating radar into national weather services and disaster risk management. Growth remains steady as governments prioritize critical infrastructure protection.
Shape Your Report to Specific Countries or Regions & Enjoy 30% Off!
Key Player Analysis:
- Airbus Group SAS
- Aselsan A.S.
- BAE Systems PLC
- Elta Systems Ltd.
- Harris Corporation
- Honeywell International, Inc.
- Leonardo S.p.A.
- Northrop Grumman Corporation
- Raytheon Company
- Rheinmetall AG
- SAAB AB
- Thales Group
Competitive Analysis:
The Global 3D Radar Market is highly competitive, driven by the presence of established defense and aerospace companies with strong technological capabilities. Leading players such as Northrop Grumman, Raytheon Technologies, Thales Group, Lockheed Martin, and SAAB AB focus on developing advanced radar systems with enhanced range, resolution, and multi-target tracking capabilities. It favors firms that offer integrated solutions, scalable platforms, and modular configurations adaptable to various mission needs. Companies invest in R&D to support innovation in synthetic aperture radar, phased array technology, and AI-enabled detection systems. Strategic collaborations, defense contracts, and government partnerships strengthen market positioning. Emerging players and regional firms compete by offering cost-effective systems tailored to specific operational environments. The market’s growth potential and evolving defense requirements keep competitive pressure high, with players seeking to expand their portfolios across airborne, naval, and ground-based radar segments to capture broader demand across global defense and civil sectors.
Recent Developments:
- In July 2025, Airbus Defence and Space prepared for the launch of its CO3D (Constellation Optique en 3D) satellites, a constellation of four small satellites designed to map the globe in 3D from low Earth orbit. The mission, scheduled for July 25, 2025, will serve both public and private sector needs for high-resolution, three-dimensional Earth observation and mapping.
- In June 2025, Leonardo S.p.A. established a 50:50 joint venture with Baykar Technologies, named LBA Systems, focused on the design, development, production, and maintenance of unmanned aerial systems (UAS). The partnership leverages Leonardo’s experience in multi-domain radar technologies and Baykar’s unmanned platforms, aiming to advance integrated unmanned and radar solutions for defense applications.
- In May 2025, Aselsan completed the first system acceptance of its ALP 100-G Low Altitude Radar System. After more than six months of rigorous testing, ALP 100-G demonstrated high-performance detection, tracking, and mobility capabilities. The system leverages AESA technology for three-dimensional tracking of aerial threats and is now set for integration into Türkiye’s air defense network, with serial production planned to follow.
- In February 2025, Elta Systems Ltd. (a subsidiary of Israel Aerospace Industries) announced the first delivery of its new C-catcher ELM-2025 airborne surveillance AESA radar family. The C-catcher employs advanced GaN AESA technology, offering multi-mode, multi-role capabilities for air-to-sea, air-to-ground, and air-to-air missions. The radar provides 360° detection with a range of up to 200 nautical miles and is designed for integration on fixed-wing aircraft, helicopters, and UAVs.
Market Concentration & Characteristics:
The Global 3D Radar Market is moderately concentrated, with a few dominant players controlling a significant share of the revenue, particularly in defense and aerospace segments. It features high entry barriers due to the complexity of radar technologies, regulatory requirements, and capital intensity. The market is characterized by long product life cycles, stringent testing standards, and reliance on government procurement. It favors established firms with strong R&D capabilities, proprietary technologies, and proven performance records. The presence of tier-one defense contractors limits new entrants, but niche applications and regional opportunities create space for specialized providers. It maintains a demand-driven structure influenced by geopolitical developments, defense modernization programs, and infrastructure investments. The market emphasizes reliability, precision, and interoperability across platforms, which reinforces the importance of innovation and long-term supplier relationships.
Report Coverage:
The research report offers an in-depth analysis based on frequency band, range, and platform. It details leading market players, providing an overview of their business, product offerings, investments, revenue streams, and key applications. Additionally, the report includes insights into the competitive environment, SWOT analysis, current market trends, as well as the primary drivers and constraints. Furthermore, it discusses various factors that have driven market expansion in recent years. The report also explores market dynamics, regulatory scenarios, and technological advancements that are shaping the industry. It assesses the impact of external factors and global economic changes on market growth. Lastly, it provides strategic recommendations for new entrants and established companies to navigate the complexities of the market.
Future Outlook:
- Rising global defense spending will continue to drive demand for advanced 3D radar systems across land, air, and naval platforms.
- Increasing integration of radar in unmanned systems and drones will open new revenue streams for system manufacturers.
- Growing investments in airport modernization and air traffic control infrastructure will expand civil aviation applications.
- The automotive sector will adopt compact 3D radar modules to enhance ADAS and autonomous vehicle navigation.
- Space-based radar systems will gain traction for Earth observation, weather monitoring, and disaster management.
- Technological advancements in AI, digital signal processing, and sensor fusion will improve radar performance and efficiency.
- Emerging economies will increase procurement of mobile and ground-based radar systems for border surveillance.
- Collaborative defense programs and international partnerships will stimulate cross-border technology transfer and market entry.
- Regulatory support for advanced surveillance and situational awareness systems will accelerate public sector deployment.
- The market will see a shift toward modular, software-defined radar platforms that support multi-domain operations.


