Market Overview:
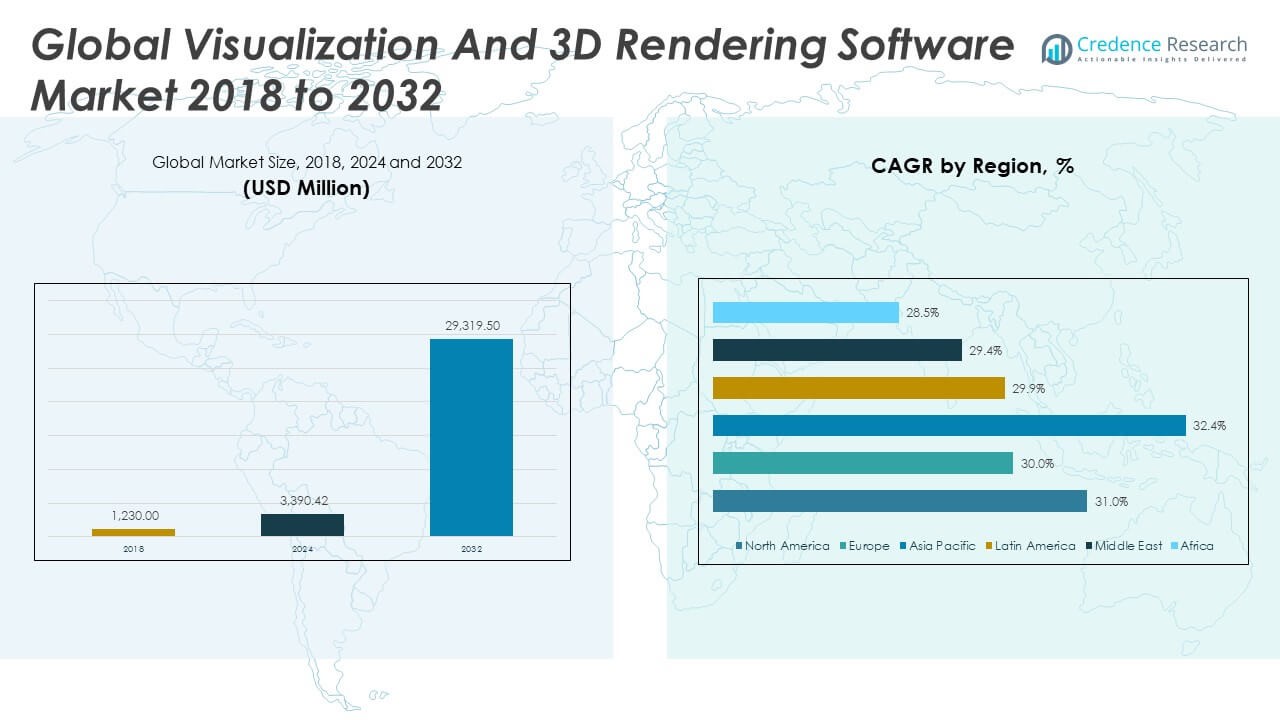
The Visualization and 3D Rendering Software Market size was valued at USD 1,230.00 million in 2018 to USD 3,390.42 million in 2024 and is anticipated to reach USD 29,319.50 million by 2032, at a CAGR of 31.03% during the forecast period.
| REPORT ATTRIBUTE |
DETAILS |
| Historical Period |
2020-2024 |
| Base Year |
2024 |
| Forecast Period |
2025-2032 |
| Visualization and 3D Rendering Software Market Size 2024 |
USD 3,390.42 Million |
| Visualization and 3D Rendering Software Market, CAGR |
31.03% |
| Visualization and 3D Rendering Software Market Size 2032 |
USD 29,319.50 Million |
The market is driven by the increasing adoption of 3D rendering across industries such as architecture, media and entertainment, automotive, and gaming. The demand for realistic visual content and immersive user experiences is pushing companies to invest in advanced visualization tools. The rise of virtual reality (VR), augmented reality (AR), and cloud-based rendering solutions has also contributed significantly to market growth. Additionally, the integration of AI in rendering software for automation and real-time rendering capabilities is transforming design workflows and boosting productivity across sectors.
North America leads the market due to strong demand from the media, entertainment, and construction industries, particularly in the United States. Europe follows, driven by architectural visualization and automotive design in countries like Germany and the UK. The Asia-Pacific region is emerging rapidly, propelled by expanding gaming and animation sectors in China, Japan, and South Korea. Government initiatives supporting digital transformation, along with a growing base of technology companies, are further strengthening regional market expansion. The increasing adoption of smart city projects and real estate development also supports rising demand for visualization and rendering tools in developing economies.
Access crucial information at unmatched prices!
Request your sample report today & start making informed decisions powered by Credence Research Inc.!
Download Sample
Market Insights:
- The Visualization and 3D Rendering Software Market was valued at USD 3,390.42 million in 2024 and is projected to reach USD 29,319.50 million by 2032, growing at a CAGR of 31.03%.
- Increased demand for immersive and photorealistic visuals across industries such as architecture, media, and automotive is accelerating software adoption.
- Cloud-based rendering solutions are gaining traction by offering scalability, remote access, and cost-effective deployment for businesses of all sizes.
- Integration of AI and machine learning enhances rendering speed and automates complex tasks, improving design efficiency.
- High software and hardware costs limit market accessibility for small firms and freelancers, especially in developing regions.
- North America holds the largest market share due to early technology adoption and strong demand from design-intensive sectors.
- Asia Pacific emerges as the fastest-growing region, driven by rapid urbanization, digital education, and expansion in gaming and entertainment sectors.
Market Drivers:
Rapid Digitalization Across Architecture, Media, and Automotive Sectors Fuels Software Demand
The Visualization and 3D Rendering Software Market benefits from the widespread adoption of digital tools in architecture, media, and automotive design. Architects use it to generate photorealistic models that improve communication with clients. Automotive manufacturers rely on it to simulate lighting, surfaces, and materials before production. Media professionals integrate it into video production and VFX workflows to create immersive visual experiences. Companies invest in visualization software to reduce prototyping costs and speed up project approvals. The need for accurate design representation continues to grow across commercial and creative industries. Businesses prioritize tools that streamline conceptualization and decision-making. The market reflects this push toward high-quality, detail-rich digital content creation.
Integration of Cloud Infrastructure Enhances Accessibility and Processing Power
Cloud-based rendering solutions remove the need for costly hardware, making powerful visualization tools accessible to small and mid-sized businesses. It allows users to process complex graphics and store large files without performance issues. Collaborative design becomes easier, with remote teams accessing and editing models in real time. The Visualization and 3D Rendering Software Market gains from this shift in deployment models, encouraging scalability and global accessibility. Design professionals use cloud platforms to accelerate project timelines and meet tighter deadlines. The flexibility to run simulations from any device also attracts freelancers and startups. It supports streamlined workflow management and improved resource efficiency. Demand continues to shift toward SaaS-based rendering platforms.
Advancements in AI and Machine Learning Improve Rendering Efficiency
AI tools embedded in rendering engines enhance real-time image generation and automate repetitive tasks. It supports functions like light balancing, texture optimization, and object placement with minimal human input. The Visualization and 3D Rendering Software Market benefits from shorter rendering times and improved image accuracy. AI algorithms interpret complex scene elements and simulate physical behavior with greater precision. Developers rely on these features to create lifelike environments for gaming, film, and VR. Businesses adopt AI-based rendering to reduce labor costs and avoid delays in content production. Machine learning adapts to user behavior, improving software performance over time. This technological advancement strengthens the case for market-wide adoption.
- For example, NVIDIA DLSS 3.5 Integrationin Omniverse: The latest update to Omniverse incorporates DLSS 3.5 with Ray Reconstruction, allowing AI-powered frame generation and denoising for superior ray-traced images in real time. By deploying AI neural networks to replace hand-tuned denoisers, preview image quality is greatly increased while drastically reducing artist wait time in scene iteration cycles.
Demand for Virtual Reality and Augmented Reality Content Spurs Software Utilization
VR and AR applications require accurate 3D visualizations that align with user interaction. The Visualization and 3D Rendering Software Market serves this demand by enabling developers to model real-time responsive environments. It plays a central role in immersive training tools, simulation-based learning, and product visualization apps. Companies in retail, healthcare, and education integrate VR solutions for interactive experiences. Creating such environments requires software that can simulate depth, texture, and lighting with precision. Designers use it to test concepts in spatial context before deployment. The rising consumer appetite for immersive technology drives software innovation. VR and AR expansion adds momentum to the software’s adoption across verticals.
- For example, MetaHuman Creatorin Unreal Engine 5.6 provides comprehensive control over generating photorealistic digital characters for real-time interactive use. The toolset is fully embedded in the Unreal Engine pipeline, making high-fidelity, custom-rigged avatars accessible to non-specialist developers for game, VFX, and immersive training experiences.
Market Trends:
Adoption of Photorealistic Rendering Elevates Visual Communication Standards
Users increasingly demand output that mirrors real-world lighting, materials, and textures. The Visualization and 3D Rendering Software Market incorporates photorealistic capabilities to meet these expectations. Designers leverage it to present more compelling visual stories that influence buying decisions. Stakeholders engage more confidently when presented with realistic models and prototypes. Photorealism becomes essential in architecture, luxury goods, and e-commerce. Artists apply it to digital advertising and storytelling for stronger visual impact. Software vendors focus on improving rendering engines to achieve lifelike detail. High-resolution visuals set new industry standards in project presentations and marketing.
- For example, RTX architectures such as Blackwell scale up to 24,064 CUDA cores per GPU, providing up to 125 TFLOPS single-precision performance—empowering applications in industrial simulation and high-fidelity asset generation. DLSS 4 on RTX PRO GPUs increases frame rates up to 2x over previous AI-based upsampling while maintaining native image quality.
Use of Interactive 3D Rendering Expands in Real-Time Applications
The demand for interactive 3D visuals continues to grow in virtual tours, digital showrooms, and configuration tools. The Visualization and 3D Rendering Software Market evolves to support real-time updates to design parameters. Customers can view products in different settings and modify colors, angles, or features instantly. E-commerce platforms use this to enhance user engagement and lower return rates. Real estate firms create walkthroughs that let clients explore properties remotely. Automotive brands offer virtual customization tools powered by real-time rendering. The market supports dynamic visualization tools that respond to user inputs without delay. Businesses view interactive visuals as a competitive differentiator.
Hybrid Rendering Solutions Bridge Real-Time and Offline Needs
Rendering software now blends the benefits of real-time engines with the quality of offline rendering. The Visualization and 3D Rendering Software Market reflects this trend by offering hybrid solutions that balance speed and accuracy. Real-time previews speed up iterative design processes while offline rendering ensures polished final output. Professionals choose tools that deliver responsiveness during design and high-quality visuals in production. Game developers benefit from reduced iteration cycles in concept development. Architects prefer interactive rendering during client presentations, followed by high-detail outputs for final documentation. The dual capability enhances workflow agility. This hybrid approach addresses the needs of time-sensitive and quality-driven users.
- For instance, Epic Games’ Unreal Engine 5 introduces Nanite, a virtualized geometry system permitting direct import and real-time rendering of assets with film-quality detail and maintaining performance by automatically streaming required detail only. This technology increases triangle and object counts by multiple orders of magnitude over prior real-time solutions.
Expansion of Cross-Platform Rendering Tools for Workflow Flexibility
Software developers increasingly build rendering tools compatible with multiple platforms, including Windows, macOS, and mobile operating systems. The Visualization and 3D Rendering Software Market grows with this shift toward universal accessibility. Cross-platform tools promote collaboration among geographically distributed teams using diverse devices. Creative professionals enjoy flexibility without software constraints. These tools also integrate smoothly with design software such as CAD, BIM, and 3D animation suites. Firms adopt such solutions to maintain continuity in multi-software environments. Mobile compatibility boosts fieldwork and on-site client engagement. Developers enhance APIs and SDKs for easier plug-in use. The trend aligns with the industry’s preference for ecosystem-friendly platforms.
Market Challenges Analysis:
High Software and Hardware Costs Limit Entry for Small Firms
Professional-grade rendering software requires significant upfront investment, particularly for licenses and maintenance. The Visualization and 3D Rendering Software Market faces resistance from smaller studios and freelancers due to high costs. Advanced rendering also demands high-performance graphics hardware, which adds to operational expenses. This deters early-stage adoption, especially in emerging economies. Budget constraints limit experimentation with newer software capabilities. Companies often delay upgrades or rely on outdated versions to manage costs. Free or low-cost alternatives lack the precision and feature sets needed for professional use. The cost barrier widens the gap between large enterprises and small design firms. It slows market expansion in price-sensitive regions.
Steep Learning Curve and Lack of Skilled Talent Restrain Adoption
Visualization and rendering tools involve complex interfaces, technical jargon, and intensive training requirements. The Visualization and 3D Rendering Software Market contends with limited availability of skilled professionals. New users often find it difficult to master key features without formal education. Organizations must invest in staff training, which adds to operational burdens. The shortage of 3D artists and visualization experts delays project execution. In fast-paced industries, companies prioritize faster deliverables, making steep learning curves less acceptable. Inadequate talent availability also leads to inefficient software utilization. It reduces return on investment for businesses adopting the software. Bridging this talent gap remains a critical challenge for the industry.
Market Opportunities:
Expansion of Metaverse and Digital Twins Creates New Avenues for Visualization
Industries exploring metaverse applications and digital twin technology generate new demand for advanced 3D rendering tools. The Visualization and 3D Rendering Software Market can address the need for real-time modeling and immersive visuals in these domains. Businesses require accurate virtual representations of physical assets for monitoring, simulation, and collaboration. This shift opens opportunities for vendors to tailor solutions for industrial, medical, and urban planning use cases. Companies seek software that delivers precision and scale without compromising on responsiveness. Custom solutions built for metaverse platforms attract interest across multiple sectors. The market aligns itself with this emerging digital frontier.
Rising Adoption in Education and Remote Collaboration Boosts Future Demand
Educational institutions increasingly integrate 3D visualization into science, design, and engineering curricula. The Visualization and 3D Rendering Software Market gains exposure from students and instructors familiarizing themselves with industry-standard tools. Remote teams across sectors also require collaborative 3D platforms for design approvals and creative ideation. Institutions and businesses seek cloud-friendly and user-friendly rendering solutions. This growing need for accessible and intuitive software drives innovation. It creates space for new entrants and specialized vendors to serve education and remote work applications. Expanding access to visualization tools in non-traditional settings fuels steady demand across regions.
Market Segmentation Analysis:
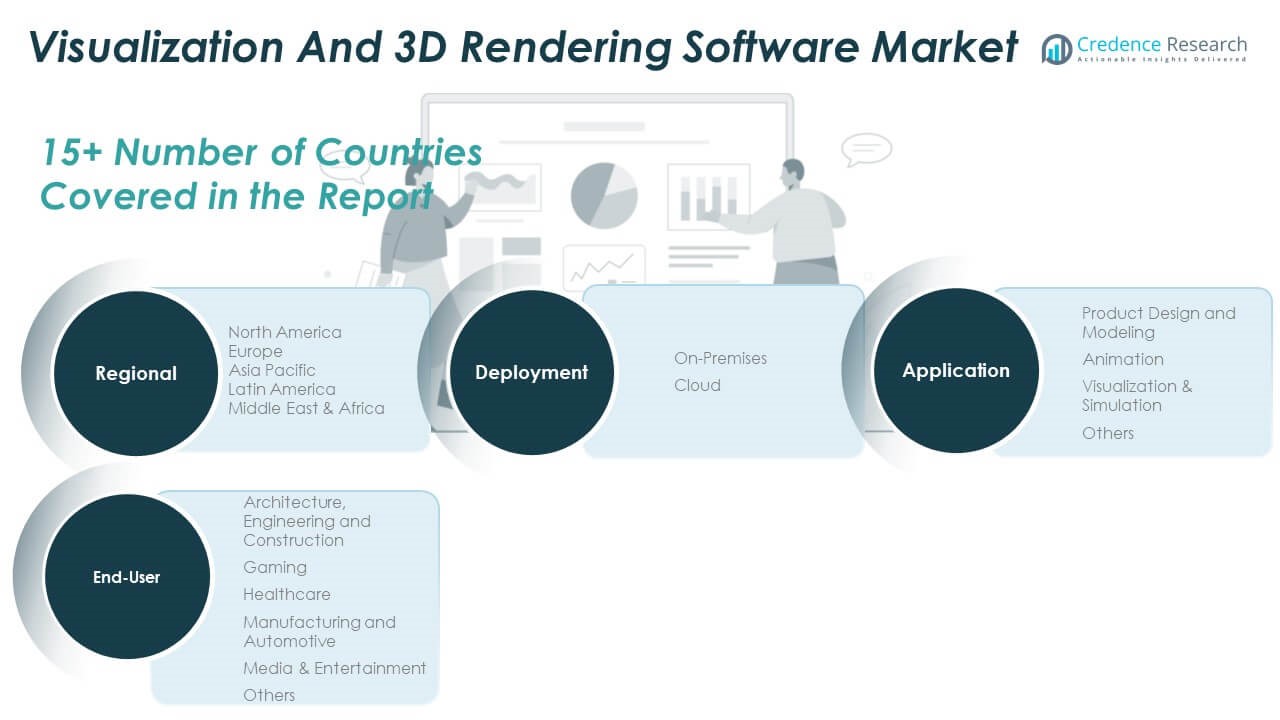
The Visualization and 3D Rendering Software Market is segmented by deployment, application, and end-user, each shaping demand dynamics.
By deployment, the cloud segment dominates due to scalability, remote collaboration, and cost-efficiency. On-premises deployment remains relevant for organizations needing data control, high performance, or secure environments, especially in architecture and manufacturing.
By application, product design and modeling hold a substantial share due to rising demand for visual prototyping across industries. Animation sees strong uptake in gaming and media, where real-time rendering and cinematic visuals are essential. Visualization and simulation serve sectors such as construction and healthcare, enabling interactive planning and medical imaging. The “others” category includes niche uses like virtual training and education.
- For instance, Unityand Unreal Engine are widely used for real-time rendering in gaming; studios leverage Unity’s real-time 3D animation tools to develop multi-platform games, maintaining frame rates above 60fps for smooth interaction.
By end-users, the AEC segment leads with widespread use of rendering tools in architectural planning and structural modeling. Gaming follows closely, driven by immersive experiences and 3D world creation. Media & entertainment rely on rendering for film production and visual storytelling. Healthcare and automotive sectors adopt it for simulation, diagnostics, and design. It continues to diversify with growing use across other industrial and educational domains.
- For instance, game studios use Unityas their primary 3D engine; its tools support the development of games for PC, mobile, and VR, as well as highly detailed 3D worlds with real-time animation and physics, contributing to Unity’s adoption by over 50% of mobile games released globally in the past five years.
Segmentation:
By Deployment
By Application
- Product Design and Modeling
- Animation
- Visualization & Simulation
- Others
By End-User
- Architecture, Engineering, and Construction (AEC)
- Gaming
- Healthcare
- Manufacturing and Automotive
- Media & Entertainment
- Others
By Region
- North America
- Europe
- Germany
- France
- U.K.
- Italy
- Spain
- Rest of Europe
- Asia Pacific
- China
- Japan
- India
- South Korea
- South-east Asia
- Rest of Asia Pacific
- Latin America
- Brazil
- Argentina
- Rest of Latin America
- Middle East & Africa
- GCC Countries
- South Africa
- Rest of the Middle East and Africa
Regional Analysis:
North America
The North America Visualization and 3D Rendering Software Market size was valued at USD 399.14 million in 2018 to USD 1,085.25 million in 2024 and is anticipated to reach USD 9,370.57 million by 2032, at a CAGR of 31.0% during the forecast period. North America holds the largest market share of 31.96%. Strong adoption across architecture, engineering, construction, and media industries contributes to sustained demand. The United States leads with high investment in immersive technologies and cloud-based design solutions. Companies in the region prioritize real-time rendering to enhance project visualization and client engagement. The presence of major software vendors and tech-driven design studios supports innovation and accessibility. Universities and design institutions integrate advanced visualization tools into education, expanding the user base. Startups and large enterprises alike drive software integration into VR/AR platforms. The region’s demand for scalable, collaborative, and high-performance rendering tools continues to shape global trends.
Europe
The Europe Visualization and 3D Rendering Software Market size was valued at USD 301.35 million in 2018 to USD 795.98 million in 2024 and is anticipated to reach USD 6,472.36 million by 2032, at a CAGR of 30.0% during the forecast period. Europe accounts for a market share of 22.08%. The market thrives on its strong architectural heritage, industrial design focus, and digital transformation efforts across sectors. Germany, the UK, and France are key contributors due to their engineering excellence and investment in design simulation. Businesses integrate 3D rendering software into automotive prototyping and urban planning. European firms adopt cloud-based rendering to enhance cross-border collaboration. Sustainability initiatives influence design workflows, where rendering software plays a role in visualizing eco-friendly infrastructure. Design competitions, smart city projects, and educational support drive market penetration. Software vendors address multilingual and compliance requirements specific to the region. The market reflects a steady shift toward intelligent, real-time rendering environments.
Asia Pacific
The Asia Pacific Visualization and 3D Rendering Software Market size was valued at USD 367.65 million in 2018 to USD 1,050.17 million in 2024 and is anticipated to reach USD 9,857.24 million by 2032, at a CAGR of 32.4% during the forecast period. Asia Pacific holds the largest market share of 33.62%. Rapid urbanization, infrastructure expansion, and growth in gaming and entertainment sectors contribute significantly. Countries like China, Japan, South Korea, and India show strong demand for immersive rendering solutions. Local software firms and international vendors compete to serve diverse business needs. The region emphasizes digital education and simulation-based learning, driving visualization adoption in schools and training institutes. Real estate marketing increasingly depends on high-resolution walkthroughs and virtual tours. Film and animation industries invest heavily in VFX pipelines supported by advanced rendering tools. It supports regional innovation through cost-effective, scalable visualization technologies. Governments promote digital transformation, opening new channels for adoption.
Latin America
The Latin America Visualization and 3D Rendering Software Market size was valued at USD 83.64 million in 2018 to USD 228.48 million in 2024 and is anticipated to reach USD 1,843.32 million by 2032, at a CAGR of 29.9% during the forecast period. Latin America contributes a market share of 6.29%. The region sees growing interest from architecture, construction, and media sectors for rendering-based design improvements. Brazil and Mexico lead adoption with active media production houses and real estate developers. Companies embrace cloud rendering to overcome hardware constraints and reduce cost burdens. Localized user interfaces and Spanish/Portuguese language support enhance usability. Education in digital design and animation gains popularity among young professionals. Freelancers and design agencies adopt affordable rendering platforms to offer high-end visualization services. Rising demand for interactive digital experiences strengthens the need for dynamic rendering software. The market gradually transitions toward professional-grade tools as regional infrastructure improves.
Middle East
The Middle East Visualization and 3D Rendering Software Market size was valued at USD 46.13 million in 2018 to USD 118.98 million in 2024 and is anticipated to reach USD 926.66 million by 2032, at a CAGR of 29.4% during the forecast period. The region holds a market share of 3.16%. Demand is led by mega construction and smart city projects in the UAE and Saudi Arabia. Governments and private developers use rendering tools to visualize luxury infrastructure and urban planning. Architectural firms invest in 3D walkthroughs and simulation tools to meet client expectations. Real estate developers showcase properties using interactive digital content powered by real-time rendering. Media and advertising agencies explore 3D storytelling to engage audiences across digital platforms. Local demand for BIM integration with rendering tools grows steadily. Events like Expo 2020 have highlighted the importance of visual technology. It expands further with initiatives focused on digital transformation and creative industry growth.
Africa
The Africa Visualization and 3D Rendering Software Market size was valued at USD 32.10 million in 2018 to USD 111.56 million in 2024 and is anticipated to reach USD 849.36 million by 2032, at a CAGR of 28.5% during the forecast period. Africa accounts for the smallest market share of 2.90%. The market is at an early stage but shows potential in sectors such as construction, education, and product design. South Africa, Nigeria, and Kenya emerge as key countries with increasing tech adoption. Infrastructure development projects open opportunities for 3D visualization to enhance stakeholder communication. Digital education platforms introduce students to rendering tools, broadening long-term adoption. Software vendors collaborate with regional partners to offer affordable and localized solutions. It gains attention in e-commerce and mobile apps where 3D product previews improve user experience. Limited hardware access remains a barrier, though cloud platforms help bridge the gap. Growth remains steady with improving digital connectivity and awareness.
Shape Your Report to Specific Countries or Regions & Enjoy 30% Off!
Key Player Analysis:
- Adobe
- Autodesk Inc.
- Chaos Software EOOD (Chaos Group)
- Corel Corporation
- Dassault Systèmes
- Luxion Inc.
- Next Limit Technologies
- Render Legion a.s.
- The Foundry Visionmongers Limited
- Trimble Inc.
Competitive Analysis:
The Visualization and 3D Rendering Software Market features a competitive landscape marked by both established players and emerging innovators. Key companies such as Autodesk, Dassault Systèmes, Adobe, Chaos Group, Siemens, and Trimble dominate with comprehensive product portfolios and global reach. These vendors focus on real-time rendering, cloud integration, and AI-based automation to enhance user experience. Smaller firms and niche developers offer specialized solutions tailored to industries like architecture, gaming, or automotive design. Strategic collaborations, product launches, and geographic expansions define competition in this space. It evolves rapidly due to shifting user preferences and technology demands. Companies differentiate through rendering speed, visual fidelity, compatibility, and licensing flexibility. Strong R&D investment and user-centric design continue to shape market positioning. The software’s ability to integrate across devices and platforms plays a key role in vendor selection. Market competition remains intense, with players striving for innovation, scalability, and seamless workflow support.
Recent Developments:
- In July 2025, Adobe released a major upgrade to its Substance 3D Designer software, introducing an advanced 3D renderer. This update directly advances visualization and 3D rendering capabilities, improving workflow for material artists involved in 3D content creation.
- In February 2025, Chaos acquired EvolveLAB to enhance its AI-powered design and visualization workflows, directly impacting 3D rendering technologies for AEC professionals.
- The February 2025 acquisition of Contentserv by Dassault Systèmes’ subsidiary aims to bolster digital transformation and 3D visualization capabilities across industries, strengthening product lifecycle management and visualization solutions.
- In May 2024, Autodesk acquired Wonder Dynamics, makers of Wonder Studio, an AI-driven 3D animation and VFX platform. This acquisition aims to amplify Autodesk’s 3D animation and rendering solutions, enabling artists to integrate 3D characters seamlessly into their visual projects.
Market Concentration & Characteristics:
The Visualization and 3D Rendering Software Market shows moderate to high market concentration, with a few dominant players controlling a significant share. It favors companies with established brand reputation, advanced R&D capabilities, and strong software ecosystems. The market is innovation-driven and characterized by rapid technological evolution. It supports high switching costs due to integration complexities and training requirements. Subscription-based pricing models and cloud-based deployment define industry characteristics. Vendors compete on rendering speed, real-time capabilities, visual quality, and platform interoperability. User demand for scalable, intuitive, and cross-platform tools shapes product development. The market continues to expand, driven by industry-specific customization and immersive design needs.
Report Coverage:
The research report offers an in-depth analysis based on deployment, application, and end-user. It details leading market players, providing an overview of their business, product offerings, investments, revenue streams, and key applications. Additionally, the report includes insights into the competitive environment, SWOT analysis, current market trends, as well as the primary drivers and constraints. Furthermore, it discusses various factors that have driven market expansion in recent years. The report also explores market dynamics, regulatory scenarios, and technological advancements that are shaping the industry. It assesses the impact of external factors and global economic changes on market growth. Lastly, it provides strategic recommendations for new entrants and established companies to navigate the complexities of the market.
Future Outlook:
- The market will see increased adoption of real-time rendering tools in architectural design and product development.
- AI integration will continue to streamline rendering workflows and automate design optimization processes.
- Cloud-based rendering platforms will dominate due to scalability, reduced hardware reliance, and remote collaboration support.
- Cross-industry adoption will expand, with growing interest from education, healthcare, and retail sectors.
- The demand for photorealistic and immersive content will drive improvements in rendering engines and visual fidelity.
- Integration with VR and AR platforms will become standard for interactive training, visualization, and customer engagement.
- Emerging economies will experience accelerated adoption supported by digital transformation and infrastructure development.
- Vendors will focus on modular software designs and enhanced API support for better compatibility across ecosystems.
- The rise of digital twins and metaverse applications will generate new commercial opportunities for 3D visualization tools.
- Subscription-based and SaaS pricing models will remain the preferred licensing approach for most users.


