
Market Overview:
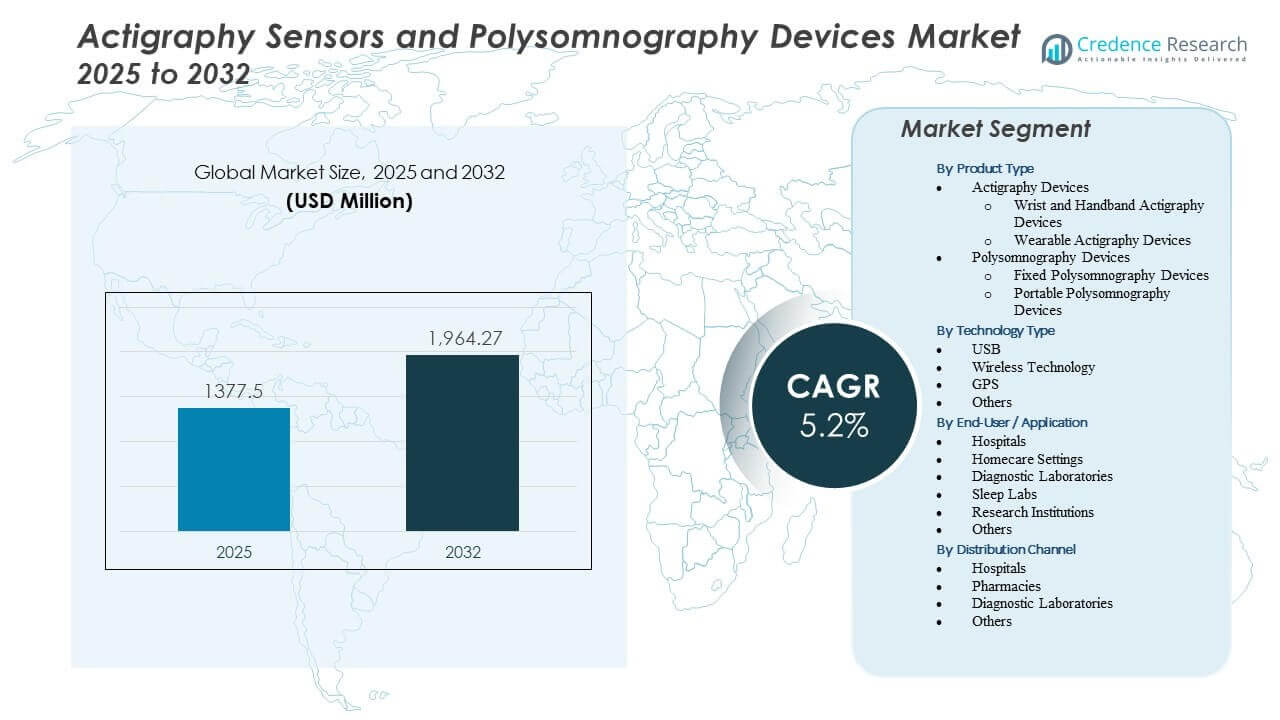
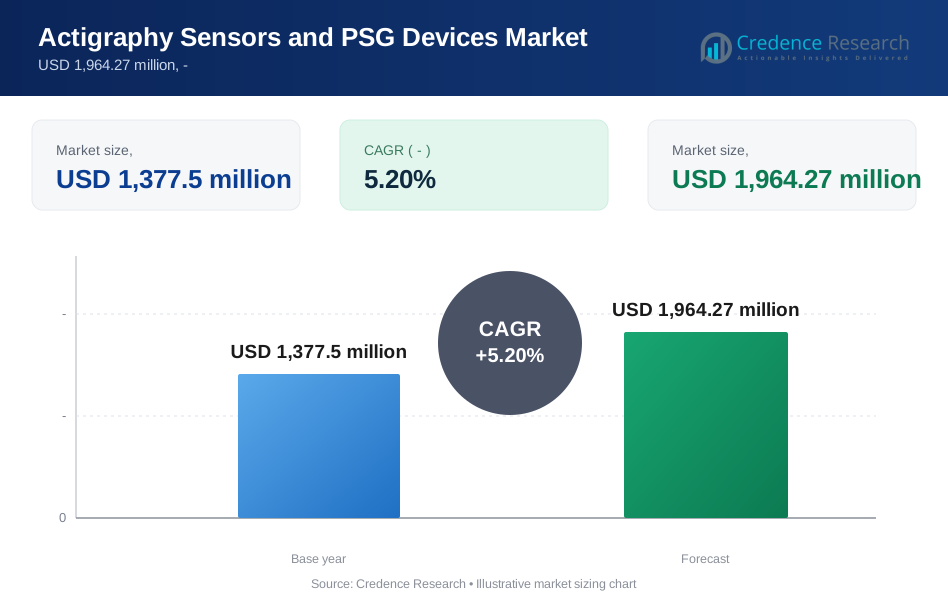
The Actigraphy Sensors and Polysomnography Devices Market is projected to grow from USD 1377.5 million in 2025 to an estimated USD 1964.27 million by 2032, with a compound annual growth rate (CAGR) of 5.2% from 2025 to 2032.
| REPORT ATTRIBUTE | DETAILS |
|---|---|
| Historical Period | 2020-2023 |
| Base Year | 2024 |
| Forecast Period | 2025-2032 |
| Actigraphy Sensors and Polysomnography Devices Market Size 2025 | USD 1377.5 Million |
| Actigraphy Sensors and Polysomnography Devices Market, CAGR | 5.2% |
| Actigraphy Sensors and Polysomnography Devices Market Size 2032 | USD 1964.27 Million |
Growth is driven by increasing diagnosis rates for insomnia, sleep apnea, and circadian rhythm disorders. Healthcare providers adopt advanced monitoring tools to improve clinical accuracy and expand remote testing capabilities. Wearable actigraphy devices support long-duration tracking, while modern polysomnography systems deliver comprehensive physiological insights. Rising use of digital platforms and AI-enhanced analytics boosts decision support for physicians and strengthens adoption across sleep labs, hospitals, and home care. Expanding consumer interest in sleep wellness also supports device penetration beyond traditional clinical settings.
North America leads the market due to established sleep-diagnostic infrastructure and widespread acceptance of home-based sleep testing. Europe follows with strong regulatory support for sleep-disorder management and active integration of digital health technologies. Asia Pacific is emerging rapidly as healthcare modernization accelerates, supported by rising urban stress, growing awareness of sleep health, and increased investments in diagnostic capabilities. Latin America and the Middle East & Africa show gradual adoption as access to sleep specialists and advanced monitoring systems improves.
Market Insights:
- The Actigraphy Sensors and Polysomnography Devices Market is set to grow from USD 1377.5 million in 2025 to USD 1964.27 million by 2032, reflecting a steady 5.2% CAGR driven by rising demand for sleep-health diagnostics.
- Growth is supported by higher screening rates for sleep apnea and insomnia, alongside increased adoption of remote and home-based monitoring solutions.
- Market restraints include limited interoperability across platforms, high equipment costs, and regulatory hurdles that slow product rollout and wider adoption.
- North America leads the market due to advanced diagnostic infrastructure and strong acceptance of digital sleep-monitoring tools.
- Asia Pacific is emerging rapidly as healthcare modernization expands access to sleep testing and rising stress levels increase awareness of sleep-related disorders.
Market Drivers
Growing Demand for Accurate Sleep-Monitoring Technologies Driven by Rising Sleep Disorders and Clinical Needs
The growth of the Actigraphy Sensors and Polysomnography Devices Market is supported by rising sleep disorder cases across global populations. Healthcare systems seek tools that capture long-term sleep patterns with high precision. Clinical adoption grows because physicians rely on multi-parameter diagnostics for treatment planning. Consumers adopt wearables that track sleep cycles in daily routines. It supports faster screening for insomnia and circadian rhythm disorders. Hospitals deploy more polysomnography systems to improve diagnostic throughput. Device accuracy improves due to enhanced movement tracking and signal quality. Rising focus on early detection strengthens overall product demand.
- For instance, the Philips Alice 6 LDx diagnostic system incorporates 55 channels of data and integrated switching of 6 EEG/EOG/EMG inputs, enabling a high-resolution signal-to-noise ratio that improves the sensitivity of detecting subtle neurological sleep events.
Expansion of Home-Based Sleep Testing Supported by Cost Efficiency and Patient Convenience
Home sleep testing gains traction because patients prefer remote monitoring over overnight lab stays. Healthcare providers view remote models as scalable and affordable. Device makers develop compact tools that deliver clinical-grade accuracy outside traditional labs. It aligns with higher adoption of digital health platforms. Insurance payers support home testing due to lower operational costs. Patients show higher compliance when testing occurs in familiar environments. Demand for actigraphy units increases due to easier deployment in remote settings. Growth in telehealth strengthens this shift across global markets.
Advances in Sensor Miniaturization and Data Analytics That Improve Diagnostic Precision
Manufacturers invest in sensor miniaturization to improve comfort and long-term monitoring capabilities. Smaller sensors provide stronger patient adherence during routine evaluations. Improved accelerometers and bio-signal processors deliver more accurate sleep-wake detection. It helps clinicians refine treatment protocols for complex conditions. AI-based analytics enhance interpretation of multi-day datasets. Automated scoring tools reduce clinician workload during sleep studies. Integration with cloud ecosystems supports continuous data access. These improvements increase confidence in advanced sleep diagnostics.
Rising Integration of Wearables and Connected Health Systems Across Preventive Care Programs
Wearable devices enter mainstream preventive health strategies. Users track sleep quality to manage chronic health risks. Employers promote sleep-health programs to boost workforce productivity. It increases interest in devices that deliver reliable activity and rest metrics. Hospitals integrate connected monitoring tools with patient management systems. Longitudinal sleep data enhances decision support tools across chronic care programs. Connected ecosystems strengthen collaboration between clinicians and patients. Broader digital adoption supports long-term demand for advanced monitoring tools.
· For instance, Garmin’s Firstbeat Analytics engine utilizes heart rate variability (HRV) data sampled at 1,000 times per second to generate a "Body Battery" score (0–100), quantifying the restorative effects of sleep versus physical activity in real-time for preventive wellness.
Market Trends
Shift Toward AI-Enhanced Sleep Interpretation Capabilities Across Clinical and Consumer Platforms
AI tools influence how sleep data is processed across diverse platforms. Advanced algorithms extract deeper insights from movement and physiological signals. Diagnostic centers deploy AI to speed up study scoring. It reduces manual tasks and improves overall accuracy. Consumer sleep apps integrate machine-learning features to boost engagement. Hybrid models link clinical software with wearable ecosystems. Predictive analytics enter sleep-health programs that target risk populations. This trend expands value creation across device and software vendors.
- For instance, EnsoData’s EnsoSleep AI platform utilizes deep learning algorithms to automate the scoring of polysomnography data, achieving over 90% agreement with expert human scorers while reducing the time required for a clinician to review a study by up to 60 minutes.
Growing Adoption of Multi-Sensor Devices That Capture Broader Physiological Indicators
Device evolution moves toward multi-sensor formats that track more than movement or respiration. Users gain access to data on temperature, oxygen levels, and heart rate. Clinical teams use these datasets to evaluate complex sleep conditions. It helps strengthen diagnostic depth during screening programs. Manufacturers position multi-sensor platforms for both home and clinical use. Demand rises for systems that eliminate repeat studies. Broader physiological mapping supports more personalized treatment plans. This trend enhances long-term relevance in the Actigraphy Sensors and Polysomnography Devices Market.
Integration of Cloud-Based Sleep Monitoring Platforms Across Healthcare Networks
Cloud ecosystems expand due to higher demand for accessible sleep data. Hospitals streamline workflows by centralizing data across networks. Remote teams gain faster access to ongoing sleep records. It supports collaborative review of multi-night studies. Software platforms enhance interoperability with EMR systems. Cloud dashboards create unified patient histories for chronic care. Providers extend monitoring programs across rural regions. This trend improves system efficiency across sleep-health operations.
Increase in Consumer-Driven Sleep Wellness Products Supported by Lifestyle Tracking
Consumers display strong interest in sleep wellness as part of broader lifestyle management. Brands launch devices that combine sleep tracking with daily activity monitoring. It shapes product design strategies targeting health-conscious buyers. Subscription apps offer personalized sleep-improvement plans. Marketing strategies highlight non-clinical use cases for sleep enhancement. Retail channels expand product reach across global markets. Continuous upgrades in comfort and design lift user adoption. This trend diversifies applications beyond clinical settings.
- For instance, WHOOP 4.0 features a 5-LED sensor configuration that tracks sleep stages and respiratory rate with clinical-grade accuracy, offering users a "Recovery Score" based on a 24-hour physiological baseline to predict daily physical strain capacity.
Market Challenges Analysis
Complex Clinical Validation Requirements and Regulatory Expectations That Slow Product Approvals
The Actigraphy Sensors and Polysomnography Devices Market faces constraints from stringent regulatory approvals. Clinical validation processes demand long evaluation cycles. Manufacturers invest significant resources to prove diagnostic accuracy. It raises development timelines for new device categories. Global regulatory frameworks vary across regions. Companies adjust testing protocols to meet diverse compliance needs. High certification costs reduce entry opportunities for smaller vendors. Slow approval timelines limit speed of innovation across the industry.
Limited Interoperability and Data Integration Issues Across Devices and Healthcare Systems
Interoperability gaps create barriers for healthcare providers. Many devices struggle to sync with hospital software systems. Fragmented data architectures reduce efficiency in clinical workflows. It complicates long-term monitoring programs that rely on unified datasets. Providers require seamless connectivity to optimize patient management. Software incompatibility forces additional manual entry tasks. Slow data transfer restricts real-time decision support. These challenges hinder full adoption of connected sleep monitoring solutions.
Market Opportunities
Expansion of Remote Sleep-Health Programs Supported by Digital Ecosystems and Telemedicine Growth
The Actigraphy Sensors and Polysomnography Devices Market gains opportunity from rapid telehealth expansion. Remote care programs support broader access to diagnostic tools. Patients in underserved regions benefit from remote monitoring solutions. It encourages hospitals to scale sleep-health initiatives. Insurers support digital models that reduce inpatient testing costs. Device makers design platforms optimized for continuous remote tracking. Growth in virtual consultations increases demand for integrated monitoring. This opportunity strengthens long-term market penetration.
Innovation in Personalized Sleep Therapeutics and Data-Driven Health Coaching Solutions
Personalized sleep-health programs rely on deep data insights from consumer and clinical devices. Advanced analytics help identify individual sleep patterns and behavioral risks. It empowers providers to deliver targeted interventions. Brands develop coaching platforms linked to device ecosystems. Pharmaceutical companies explore partnerships for therapy optimization. Consumer wellness platforms adopt sleep data to enhance lifestyle programs. Expanding interest in personalized care unlocks new revenue streams. This opportunity aligns growth for both hardware and digital solution providers.
Market Segmentation Analysis:
By Product Type
Actigraphy Devices form a strong share of the Actigraphy Sensors and Polysomnography Devices Market due to increasing adoption in long-term sleep monitoring and activity assessment. Wrist and handband formats hold wide appeal because patients prefer compact devices during daily routines. Wearable models support broader screening programs driven by comfort and multi-day data capture. Polysomnography Devices maintain dominance in clinical diagnosis where full physiological mapping is required. Fixed systems remain essential inside sleep labs that manage complex disorders. Portable systems gain strong acceptance due to demand for home-based assessments. It helps providers run multi-night studies with greater patient compliance. Growth across both device categories reflects the shift toward flexible and scalable sleep diagnostics.
- For instance, the ActiGraph LEAP incorporates a tri-axial accelerometer with a sampling rate of up to 100 Hz, allowing it to capture continuous activity and sleep data for up to 30 days on a single charge.
By Technology Type
USB technology retains relevance in the Actigraphy Sensors and Polysomnography Devices Market because it offers stable data transfer and lower setup complexity for clinical teams. Wireless Technology expands quickly due to demand for cable-free monitoring solutions that support remote workflows. GPS features gain attention where movement tracking outside controlled environments influences behavioral research. It strengthens data accuracy during ambulatory studies that cover diverse activity patterns. The Others segment includes advanced sensing tools that handle multi-parameter capture. Hospitals adopt hybrid technologies to boost system interoperability. Home users rely on wireless models that link easily with mobile platforms. Performance improvements across these technologies support wider adoption across medical and consumer groups.
By End-User / Application
Hospitals lead demand in the Actigraphy Sensors and Polysomnography Devices Market because clinicians rely on comprehensive diagnostics for sleep disorders. Diagnostic laboratories adopt both actigraphy and polysomnography tools to expand testing capacity. Sleep labs remain core users of fixed systems that capture detailed bio-signals. Research institutions use advanced devices to study sleep-related behaviors across population cohorts. Homecare Settings gain notable momentum due to rising use of portable systems for remote evaluation. It supports higher patient comfort and stronger follow-through during multi-night tests. Other end-users include wellness centers that promote lifestyle-based sleep programs. Each segment contributes to broader market development driven by clinical and preventive needs.
By Distribution Channel
Hospitals account for a major share of distribution in the Actigraphy Sensors and Polysomnography Devices Market because procurement cycles focus on clinical-grade equipment. Pharmacies support consumer adoption where wearable actigraphy devices enter retail channels. Diagnostic laboratories procure tools that enhance operational efficiency and testing capacity. It reflects their need for standardized systems that manage large sample volumes. The Others segment includes online platforms and specialized distributors handling professional sleep-health equipment. Remote purchasing trends increase access to actigraphy devices for home users. Corporate wellness programs also influence procurement patterns across digital channels. Growth across these distribution routes supports stronger availability of advanced sleep-monitoring tools.
- For instance, Nox Medical distributes its Nox A1s PSG system through specialized medical distributors, featuring a device weight of only 186 grams to ensure it is lightweight enough for both clinical and direct-to-patient shipping models.
Segmentation:
By Product Type
- Actigraphy Devices
- Wrist and Handband Actigraphy Devices
- Wearable Actigraphy Devices
- Polysomnography Devices
- Fixed Polysomnography Devices
- Portable Polysomnography Devices
By Technology Type
- USB
- Wireless Technology
- GPS
- Others
By End-User / Application
- Hospitals
- Homecare Settings
- Diagnostic Laboratories
- Sleep Labs
- Research Institutions
- Others
By Distribution Channel
- Hospitals
- Pharmacies
- Diagnostic Laboratories
- Others
By Region
- North America
- U.S.
- Canada
- Mexico
- Europe
- Germany
- France
- U.K.
- Italy
- Spain
- Rest of Europe
- Asia Pacific
- China
- Japan
- India
- South Korea
- South-east Asia
- Rest of Asia Pacific
- Latin America
- Brazil
- Argentina
- Rest of Latin America
- Middle East & Africa
- GCC Countries
- South Africa
- Rest of the Middle East and Africa
Regional Analysis:
North America holds the largest share of the Actigraphy Sensors and Polysomnography Devices Market with nearly 38%, supported by strong diagnostic infrastructure and high awareness of sleep-related health issues. Hospitals invest in advanced systems to manage rising cases of sleep apnea and insomnia. It benefits from strong reimbursement frameworks that encourage adoption across clinical settings. Wearable actigraphy devices gain traction through consumer wellness programs. Research institutions drive innovation with large-scale studies that require continuous sleep monitoring. Growing preference for home-based testing keeps demand steady across portable devices.
Europe accounts for roughly 29% of the global market due to strong clinical adoption and widespread digital health programs. Healthcare systems deploy advanced polysomnography units to expand sleep disorder screening across major countries. It supports cross-border collaborations that improve clinical guidelines for sleep diagnostics. Consumer demand increases for wearable tools that promote lifestyle and wellness monitoring. Research networks across Germany, the U.K., and the Nordics advance multi-parameter sensor development. Regional policies focused on early intervention strengthen uptake across both medical and homecare environments.
Asia Pacific captures nearly 24% share and represents the fastest-growing region in the Actigraphy Sensors and Polysomnography Devices Market. Rising urban stress levels increase demand for sleep-health services across major cities. It benefits from growing investments in hospital sleep labs and affordable home-based testing systems. Consumer adoption rises due to strong interest in digital wellness devices. Local manufacturers introduce cost-effective products that expand access across emerging economies. Regional healthcare reforms strengthen diagnostic capacity and support broader integration of monitoring technologies.
Key Player Analysis:
- ActiGraph LLC
- Activinsights Ltd
- Fitbit LLC (Google)
- Garmin Ltd
- Koninklijke Philips NV
- ResMed Inc.
- SOMNOmedics GmbH
- Compumedics Ltd
- Nox Medical
- Cleveland Medical Devices Inc.
Competitive Analysis:
The competitive landscape in the Actigraphy Sensors and Polysomnography Devices Market features global medical device companies, digital health firms, and specialized sleep diagnostics manufacturers. Companies focus on accuracy, comfort, and data-integration capabilities to secure market share. It pushes vendors to advance sensor technology, improve cloud connectivity, and enhance multi-parameter monitoring features. Leading players strengthen portfolios through AI-driven analytics that support faster interpretation of sleep patterns. Partnerships with hospitals, sleep labs, and telehealth providers expand reach across clinical and homecare settings. Firms also target consumer wellness markets with wearable devices that complement medical-grade systems. Competition intensifies through device miniaturization, platform interoperability, and strong after-sales service models.
Recent Developments:
- In February 2025, ResMed partnered with Garmin to integrate actigraphy-derived sleep metrics into remote patient monitoring workflows, improving home-based sleep tracking accuracy.
- In January 2025, ActiGraph LLC made a significant acquisition of Biofourmis Connect, the life science business of Biofourmis, to enhance its clinical trial capabilities with advanced remote monitoring software, accelerating ActiGraph's modernization of wearable digital health technology for research and development.
Report Coverage:
The research report offers an in-depth analysis based on Product Type, Technology Type, End-User / Application, Distribution Channel, and Region. It details leading market players, providing an overview of their business, product offerings, investments, revenue streams, and key applications. Additionally, the report includes insights into the competitive environment, SWOT analysis, current market trends, as well as the primary drivers and constraints. Furthermore, it discusses various factors that have driven market expansion in recent years. The report also explores market dynamics, regulatory scenarios, and technological advancements that are shaping the industry. It assesses the impact of external factors and global economic changes on market growth. Lastly, it provides strategic recommendations for new entrants and established companies to navigate the complexities of the market.
Future Outlook:
- Adoption of advanced monitoring tools will rise as healthcare systems expand sleep-diagnostic programs across clinical and home environments in the Actigraphy Sensors and Polysomnography Devices Market.
- Demand for portable systems will strengthen due to higher preference for multi-night testing and remote assessments supported by digital workflows.
- AI-driven analytics will influence clinical decisions by offering faster interpretation of complex sleep-pattern data.
- Wearable devices will gain traction among wellness-focused consumers who seek continuous insights into sleep quality and daily activity cycles.
- Hospitals will upgrade fixed polysomnography units to manage greater patient volumes and improve diagnostic accuracy.
- Research institutions will expand investments in multi-sensor platforms to study broader sleep-related health behaviors.
- Wireless technologies will accelerate market penetration due to easier integration with cloud-based ecosystems.
- Partnerships between device makers and telehealth providers will create unified monitoring pathways across diverse patient groups.
- Growth across Asia Pacific will advance as regional healthcare reforms improve access to modern sleep-health infrastructure.
- Product innovation will center on comfort, data precision, and interoperability to meet rising expectations from medical and consumer segments.
Request a Free Sample
Fill in your details and we'll send you a free sample report.
- Sample data tables & charts
- Research methodology
Need a Custom Version of This Report?
Tailor the scope, geography, or segments to your exact requirements.
- Custom geography or segment scope
- Direct access to our analyst team
Frequently Asked Questions
What is the current market size for the Actigraphy Sensors and Polysomnography Devices Market, and what is its projected size in 2032?
At what Compound Annual Growth Rate is the Actigraphy Sensors and Polysomnography Devices Market projected to grow between 2025 and 2032?
Which segment held the largest share in the Actigraphy Sensors and Polysomnography Devices Market in 2025?
What are the primary factors fueling growth in the Actigraphy Sensors and Polysomnography Devices Market?
Who are the leading companies in the Actigraphy Sensors and Polysomnography Devices Market?
Which region commanded the largest share of the Actigraphy Sensors and Polysomnography Devices Market in 2025?
Table of Content
Chapter 1. Report Introduction
- 1.1 Report Description & Purpose
- 1.1.1 Report Title & Market Definition
- 1.1.2 Unique Selling Propositions (USP) & Key Differentiators
- 1.1.3 Value Proposition for Stakeholders
- 1.2 Research Objectives
- 1.2.1 Market Sizing Objectives (Volume & Revenue)
- 1.2.2 Segmentation Objectives
- 1.2.3 Competitive Intelligence Objectives
- 1.2.4 Forecast & Scenario Objectives
- 1.3 Report Scope
- 1.3.1 Actigraphy Sensors and PSG Devices Scope – Types & Subtypes Covered
- 1.3.2 Geographic Scope – Regions & Countries Covered
- 1.3.3 Historical Period, Base Year & Forecast Period (the historical period; forecast to the forecast period)
- 1.3.4 Inclusions & Exclusions
- 1.4 HS Code & Classification Framework
- 1.5 Currency, Units & Pricing Basis
- 1.6 Target Stakeholders
- 1.7 Limitations & Assumptions
Chapter 2. Executive Summary
- 2.1 Global Actigraphy Sensors and PSG Devices Market Snapshot
- 2.1.1 Market Size – Historical (the historical period) & Forecast (the forecast period) (base year: USD 1,377.5 million → forecast year: USD 1,964.27 million)
- 2.1.2 Volume & Revenue – Global Totals
- 2.1.3 Key Market Highlights – Top Five Facts
- 2.2 Actigraphy Sensors and PSG Devices Market Segmentation Snapshot
- 2.2.1 Market Split by Region – vs.
- 2.3 Competitive Snapshot
- 2.3.1 Top 10 Players by Revenue Share –
- 2.3.2 Top 10 Players by Volume Share –
- 2.3.3 Recent Strategic Developments (18-Month Summary)
- 2.4 Key Investment Highlights & Strategic Conclusions
Chapter 3. Actigraphy Sensors and PSG Devices Market Dynamics & Industry Analysis
- 3.1 Market Overview & Context
- 3.1.1 Actigraphy Sensors and PSG Devices Market Position in the Broader Automotive Value Chain
- 3.1.2 OEM vs. Replacement Market Dynamics
- 3.1.3 Market Maturity & Development Stage by Region
- 3.2 Actigraphy Sensors and PSG Devices Market Drivers
- 3.3 Actigraphy Sensors and PSG Devices Market Restraints & Challenges
- 3.4 Actigraphy Sensors and PSG Devices Market Opportunities
- 3.5 Porter's Five Forces Analysis
- 3.5.1 Threat of New Entrants
- 3.5.2 Bargaining Power of Suppliers
- 3.5.3 Bargaining Power of Buyers
- 3.5.4 Threat of Substitutes
- 3.5.5 Competitive Rivalry – Intensity Assessment
- 3.6 Actigraphy Sensors and PSG Devices Value Chain Analysis
- 3.6.1 Upstream – Raw Material/Input Suppliers
- 3.6.1.1 Raw Material/Input 1
- 3.6.1.2 Raw Material/Input 2
- 3.6.1.3 Raw Material/Input 3
- 3.6.2 Midstream – Production/Manufacturing/Service Delivery
- 3.6.2.1 Production/Process Overview
- 3.6.2.2 Key Facility Locations & Capacity by Manufacturer
- 3.6.3 Downstream – Distribution & End Consumer
- 3.6.3.1 Primary Channel – B2B/OEM
- 3.6.3.2 Secondary Channels – Dealer, Retail, Online, Direct
- 3.6.4 Value Chain Profitability Analysis
- 3.6.1 Upstream – Raw Material/Input Suppliers
- 3.7 PESTEL Analysis
- 3.7.1 Political Factors
- 3.7.2 Economic Factors
- 3.7.3 Social Factors
- 3.7.4 Technological Factors
- 3.7.5 Environmental Factors
- 3.7.6 Legal Factors
- 3.8 Actigraphy Sensors and PSG Devices Supply Chain Analysis
- 3.8.1 Raw Material/Input Supply Risk Assessment
- 3.8.2 Manufacturing Concentration Risk (Geographic Exposure)
- 3.8.3 Trade Disruption Impact Analysis
- 3.9 Regulatory & Policy Landscape
Note: The regulatory and policy landscape section covers regulations based on their applicability to the market, Actigraphy Sensors and PSG Devices category, geography, and scope of the study. Only regulatory frameworks with a material impact on operations, compliance, trade, sustainability, or market access are analyzed in detail.
Chapter 4. Key Investment Pockets & Opportunity Analysis
- 4.1 Actigraphy Sensors and PSG Devices Market Attractiveness Analysis
- 4.1.1 By Region – Investment Attractiveness Matrix (Volume × CAGR)
- 4.2 Absolute Revenue Growth Opportunity
- 4.2.1 By Region – Absolute USD Growth Through the forecast period
- 4.3 Incremental Volume Opportunity
- 4.3.1 By Region – Incremental Volume Through the forecast period
- 4.3.2 Segment – Incremental Volume
- 4.4 Emerging Submarket Opportunity Deep Dive (Subject to Applicability)
- 4.5 Emerging Market Opportunity Scorecards
- 4.5.1 United States
- 4.5.2 Europe
- 4.5.3 Asia
- 4.5.4 Middle East & Africa
Note: Emerging Market Opportunity Scorecards will be included based on relevance and strategic importance. Regions listed are indicative and may vary depending on data availability and market dynamics.
Chapter 5. Actigraphy Sensors and PSG Devices Import-Export Analysis & Trade Flows
- 5.1 Global Trade Overview
- 5.1.1 Global Export Value by Country (the historical period)
- 5.1.2 Global Export Volume by Country (the historical period)
- 5.1.3 Global Import Value by Country (the historical period)
- 5.1.4 Global Import Volume by Country (the historical period)
- 5.1.5 Net Trade Balance by Country (the historical period)
- 5.2 Export Analysis – Segment
- 5.2.1 Type 1 (HS Code)
- 5.2.2 Type 2 (HS Code)
- 5.2.3 Type 3 (HS Code)
- 5.2.4 Type 4 (HS Code)
- 5.2.5 Type 5 (HS Code)
- 5.3 Import Analysis – Segment
- 5.3.1 Type 1 (HS Code)
- 5.3.2 Type 2 (HS Code)
- 5.3.3 Type 3 (HS Code)
- 5.3.4 Type 4 (HS Code)
- 5.3.5 Type 5 (HS Code)
- 5.4 Average Unit Trade Prices
- 5.4.1 Average Export Price – Segment & Country
- 5.4.2 Average Import Price – Segment & Source Country
- 5.4.3 Price Trends (the historical period)
- 5.5 Key Trade Route Analysis
- 5.5.1 Trade Route 1
- 5.5.2 Trade Route 2
- 5.5.3 Trade Route 3
- 5.5.4 Trade Route 4
- 5.5.5 Trade Route 5
- 5.6 Trade Policy Impact Assessment
- 5.6.1 US Anti-Dumping & Section 301 Tariffs
- 5.6.2 EU Customs Union Impact
- 5.6.3 Major Free Trade Agreements
- 5.6.4 USMCA Rules of Origin
Note: Trade policy analysis will be included only where relevant to the Actigraphy Sensors and PSG Devices market.
Chapter 6. Competitive Landscape & Company Benchmarking
- 6.1 Actigraphy Sensors and PSG Devices Market Concentration & Structure
- 6.1.1 Herfindahl-Hirschman Index (HHI) – vs.
- 6.1.2 Tier 1, Tier 2 & Tier 3 Market Structure
- 6.1.3 Global, Regional & Local Player Dynamics
- 6.2 Actigraphy Sensors and PSG Devices Market Share Analysis –
- 6.2.1 Global Revenue Share by Company
- 6.2.2 Global Volume Share by Company
- 6.2.3 Regional Revenue Share
- 6.2.4 Market Share Evolution ( vs. )
- 6.2.5 OEM Segment Share by Company
- 6.2.6 Replacement Segment Share by Company
- 6.3 Production/Delivery Capacity & Facility Analysis
- 6.3.1 Global Installed Capacity
- 6.3.2 Capacity Utilization Rates
- 6.3.3 Production/Output Volume
- 6.3.4 Facility Locations & Capacity Map
- 6.3.5 Planned Capacity Additions
- 6.4 Actigraphy Sensors and PSG Devices Competitive Benchmarking Matrix
- 6.4.1 Revenue, Volume, CAGR & Profitability Comparison
- 6.4.2 Channel Revenue Mix
- 6.4.3 Geographic Revenue Exposure
- 6.4.4 R&D Intensity
- 6.4.5 Sustainability Maturity
- 6.5 Strategic Developments in Actigraphy Sensors and PSG Devices (Last 24 Months)
- 6.5.1 Mergers, Acquisitions & Divestments
- 6.5.2 New Actigraphy Sensors and PSG Devices Launches
- 6.5.3 Facility Expansions
- 6.5.4 Strategic Alliances, Joint Ventures & Partnerships
- 6.5.5 Distribution Expansion & Market Entry
- 6.5.6 Sustainability & ESG Initiatives
- 6.6 Competitive Strategy Mapping
- 6.6.1 Leader, Challenger, Follower & Niche Classification
- 6.6.2 Pricing Strategy Comparison
- 6.6.3 Channel Strategy Matrix
Note: Strategic developments are included based on their materiality and the availability of reliable information.
Chapter 7. Global Actigraphy Sensors and PSG Devices Market – By Distribution Channel
- 7.1 Segment Overview
- 7.1.1 Volume & Revenue Split by Channel ( & )
- 7.1.2 Channel Mix Evolution (the forecast period)
Chapter 8. Regional Market Analysis – Global Overview
- 8.1 Global Regional Overview
- 8.1.1 Regional Volume Share
- 8.1.2 Regional Revenue Share
- 8.1.3 Regional Volume by Region
- 8.1.4 Regional Revenue by Region
- 8.1.5 Regional Forecast Through the forecast period
- 8.2 Cross-Regional Segment Analysis
- 8.2.1 By Distribution Channel
- 8.2.2 By Brand/Price Tier
Chapter 9. North America Actigraphy Sensors and PSG Devices Market
- 9.1 United States
- 9.2 Canada
- 9.3 Mexico
Chapter 10. Europe Actigraphy Sensors and PSG Devices Market
- 10.1 Germany
- 10.2 France
- 10.3 Italy
- 10.4 United Kingdom
- 10.5 Spain
- 10.6 Poland
- 10.7 Russia
- 10.8 Netherlands
- 10.9 Belgium
- 10.10 Sweden
- 10.11 Denmark
- 10.12 Norway
- 10.13 Rest of Europe
Chapter 11. Asia Pacific Actigraphy Sensors and PSG Devices Market
- 11.1 China
- 11.2 India
- 11.3 Japan
- 11.4 South Korea
- 11.5 Thailand
- 11.6 Indonesia
- 11.7 Vietnam
- 11.8 Malaysia
- 11.9 Australia
- 11.10 Rest of Asia Pacific
Chapter 12. Latin America Actigraphy Sensors and PSG Devices Market
- 12.1 Brazil
- 12.2 Argentina
- 12.3 Colombia
- 12.4 Chile
- 12.5 Rest of Latin America
Chapter 13. Middle East Actigraphy Sensors and PSG Devices Market
- 13.1 Saudi Arabia
- 13.2 United Arab Emirates
- 13.3 Turkey
- 13.4 Israel
- 13.5 Iran
- 13.6 Rest of the Middle East
Chapter 14. Africa Actigraphy Sensors and PSG Devices Market
- 14.1 South Africa
- 14.2 Egypt
- 14.3 Nigeria
- 14.4 Morocco
- 14.5 Rest of Africa
Chapter 15. Actigraphy Sensors and PSG Devices Company Profiles
- 15.1 [Company 01]
- 15.1.1 Company Overview
- 15.1.2 Key Management Personnel
- 15.1.3 Products & Services Portfolio
- 15.1.4 Financial Performance
- 15.1.5 Key Market Focus & Geographic Presence
- 15.1.6 Recent Developments & Strategic Initiatives
Note: The company profile list is preliminary and may change based on research findings, market developments, data availability, and client requirements.
Chapter 16. Appendices
- Appendix A – List of Abbreviations & Acronyms
- Appendix B – Industry Classification Code Reference – Full Series
- Appendix C – Production & Capacity Data Tables
- Appendix D – End-Use & Demand Base Tables
- Appendix E – Consumption & Replacement Rate Assumptions
- Appendix F – ASP Reference Tables
- Appendix G – Manufacturing & Facility Database
- Appendix H – Import-Export Data Tables
- Appendix I – Regulatory Summary Tables
- Appendix J – Primary Research Participant List (Anonymized)
- Appendix K – Primary Research Questionnaire Framework
- Appendix L – Data Sources & Bibliography
- Appendix M – Market Size Divergence & Source Comparison
Chapter 17. Research Methodology
- 17.1 Research Framework & Philosophy
- 17.2 Secondary Research – Sources, Hierarchy & Data Extraction
- 17.3 Data Modeling – Bottom-Up & Top-Down Market Sizing
- 17.4 Primary Research – Stakeholder Framework, LOI & Sample Sizes
- 17.5 Forecast Methodology – Regression, Scenario & Sensitivity Analysis
- 17.6 Quality Control – Four-Layer Validation Framework
- 17.7 Limitations & Standard Assumptions
- 17.8 Disclaimer
