
Aesthetic Filler Market Overview:
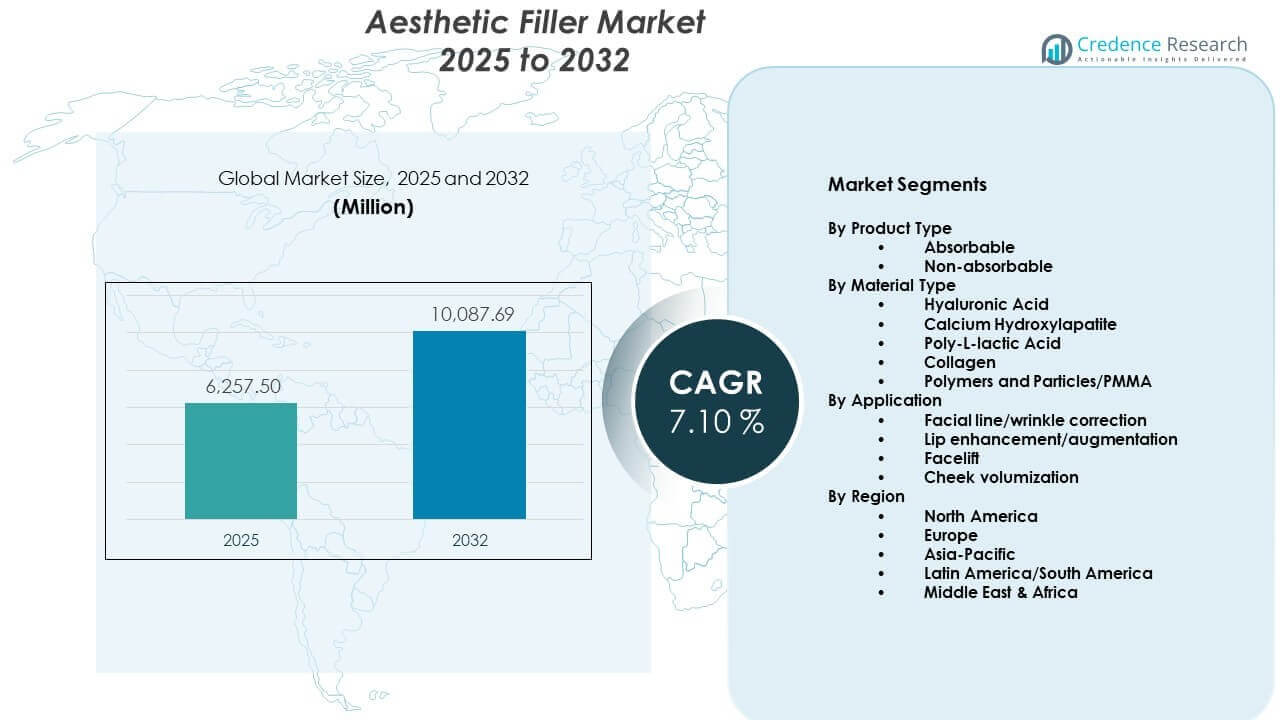
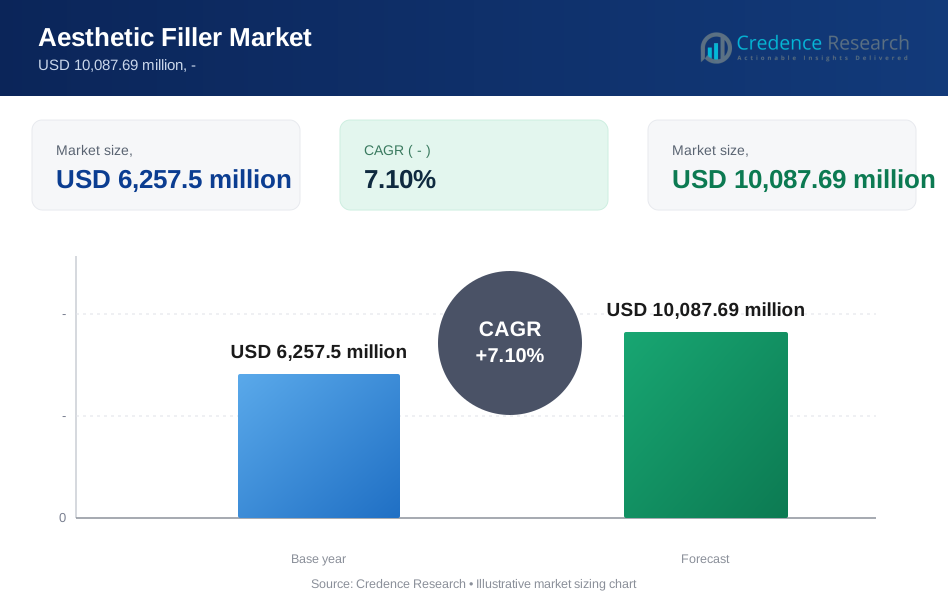
The Aesthetic Filler Market is projected to grow from USD 6,257.5 million in 2025 to an estimated USD 10,087.69 million by 2032, with a compound annual growth rate (CAGR) of 7.10% from 2025 to 2032. Rising awareness of minimally invasive cosmetic procedures drives strong demand across urban populations.
| REPORT ATTRIBUTE | DETAILS |
|---|---|
| Historical Period | 2020-2024 |
| Base Year | 2025 |
| Forecast Period | 2026-2032 |
| Aesthetic Filler Market Size 2025 | USD 6,257.5 million |
| Aesthetic Filler Market, CAGR | 7.10% |
| Aesthetic Filler Market Size 2032 | USD 10,087.69 million |
Aesthetic Filler Market Insights:
- North America holds around 35% share, Europe about 30%, and Asia-Pacific nearly 25%, supported by dense clinic networks, high aesthetic spend, and strong adoption of advanced filler brands.
- Asia-Pacific, with roughly 25% share, remains the fastest-growing region, driven by urbanisation, rising beauty awareness, expanding middle-class income, and strong medical tourism in China, South Korea, and Thailand.
- By material, hyaluronic acid accounts for about 60% share, while calcium hydroxylapatite and Poly-L-lactic Acid together contribute nearly 25%, supported by demand for safe, versatile, and durable fillers.
- By application, facial line and wrinkle correction represents roughly 45% share, lip enhancement about 25%, with cheek volumisation and facelift-oriented injections capturing the remaining demand across clinics.
Aesthetic Filler Market Drivers:
Rising Preference For Minimally Invasive Facial Rejuvenation Procedures Across Urban Populations
Growing demand for non-surgical cosmetic procedures drives strong adoption of dermal fillers. Patients seek facial enhancement without hospital stays or extended recovery periods. Short procedure time improves clinic efficiency and patient turnover. Physicians promote fillers for wrinkle reduction and volume restoration. Treatment flexibility supports customized facial contour outcomes. Repeat procedure cycles sustain consistent revenue streams. Social acceptance of aesthetic care expands across working professionals. Expanding clinic networks increase treatment access in tier-one and tier-two cities.
- For instance, Allergan Aesthetics demonstrated clinical efficiency with SKINVIVE by JUVÉDERM, where 58% of patients achieved a ≥1-point improvement on the Allergan Cheek Smoothness Scale within just one month of treatment.
Expansion Of Medical Aesthetics Clinics And Skilled Practitioner Base Worldwide
Private dermatology chains continue to expand service coverage in major cities. Certified injectors improve treatment safety and patient trust. Structured training programs raise technical precision in filler placement. Multispecialty hospitals integrate aesthetic units within cosmetic departments. Device manufacturers support practitioners through workshops and clinical education. Standard treatment protocols enhance procedural consistency. Higher practitioner density reduces appointment waiting periods. Strong provider networks improve regional penetration of aesthetic services.
- For instance, Merz Aesthetics standardized jawline treatments with Radiesse (+), reporting that 75.6% of subjects achieved a 1-point improvement on the Merz Jawline Assessment Scale at Week 12 across multi-center clinical trials.
Technological Advancements In Filler Formulations And Product Safety Standards
Manufacturers develop advanced hyaluronic acid fillers with improved cross-linking stability. Enhanced viscosity supports better lift capacity and contour definition. Long-lasting formulations reduce treatment frequency for patients. Clinical studies validate safety and biocompatibility standards. Regulatory approvals strengthen physician confidence in new launches. Precision syringes improve injection accuracy and control. Improved packaging design supports sterile application. Continuous research investment drives product differentiation across brands.
Growing Disposable Income And Beauty Consciousness Among Younger Demographics
Rising middle-class income supports elective spending on cosmetic enhancement. Younger consumers show interest in early facial correction procedures. Social media exposure shapes aesthetic awareness across age groups. Influencer culture increases demand for subtle facial refinement. Male participation in cosmetic treatments shows gradual growth. Urban lifestyle trends promote appearance-focused self-care routines. Promotional financing options make treatments more accessible. Brand marketing campaigns expand outreach to first-time users.
Aesthetic Filler Market Trends:
Shift Toward Preventive Aesthetic Treatments And Subtle Enhancement Approaches
Patients prefer early intervention to maintain youthful appearance. Clinics promote subtle volume correction rather than dramatic changes. Preventive filler use gains traction among individuals in their late twenties. Physicians design treatment plans that focus on facial harmony. Lower dose strategies reduce risk of overcorrection. Demand grows for natural texture and balanced facial proportions. Consumer education supports informed aesthetic decisions. Treatment personalization strengthens long-term patient retention.
- For instance, Galderma supports subtle rejuvenation with Sculptra, which is clinically proven to increase Type 1 collagen by 66.5% within three months, facilitating gradual structural reinforcement rather than instant volume.
Integration Of Combination Therapies With Neurotoxins And Energy-Based Devices
Clinics combine dermal fillers with botulinum toxin procedures for enhanced results. Energy-based devices complement fillers in skin tightening plans. Multimodal therapy improves overall facial rejuvenation outcomes. Coordinated treatment schedules optimize patient satisfaction. Cross-selling strategies increase average revenue per patient. Manufacturers align product portfolios to support combination protocols. Medical conferences highlight integrated aesthetic solutions. Structured consultation models promote comprehensive facial assessment.
- For instance, Hugel Aesthetics demonstrated that their letibotulinumtoxinA achieved high efficacy for glabella line improvement, with Phase 3 clinical trials (BLESS III) showing a 94.0% responder rate (at least 1-point improvement) as assessed by investigators at week 4.
Rising Demand For Biostimulatory And Collagen-Inducing Injectable Solutions
Collagen stimulators gain recognition for gradual and natural outcomes. Physicians highlight long-term tissue regeneration benefits. Product innovation focuses on sustained dermal support. Biostimulatory fillers appeal to patients seeking extended durability. Clinical evidence supports progressive volume improvement. Treatment protocols emphasize staged injection sessions. Consumer preference shifts toward regenerative aesthetic approaches. Educational outreach enhances acceptance of advanced injectables.
Digital Consultation Platforms And Virtual Aesthetic Planning Tools Adoption
Teleconsultation platforms support pre-treatment screening and follow-up care. Digital imaging tools assist in facial mapping and outcome preview. Clinics use simulation software to set realistic expectations. Data tracking improves patient record management. Online appointment systems streamline scheduling processes. Digital reviews influence clinic selection decisions. Virtual consultation expands reach beyond metropolitan areas. Technology integration improves operational efficiency across aesthetic centers.
Aesthetic Filler Market Challenges Analysis:
Stringent Regulatory Frameworks And Product Approval Complexities Across Regions
Regulatory standards vary across major markets and require detailed clinical validation. Approval timelines often extend product launch cycles. Compliance costs increase operational expenditure for manufacturers. Quality audits demand continuous monitoring of production facilities. Import restrictions affect cross-border product distribution. Physicians rely on approved brands to avoid legal exposure. The Aesthetic Filler Market faces delays in new formulation adoption due to these regulatory hurdles. Harmonization gaps across regions create strategic planning challenges.
Risk Of Adverse Events And Growing Concern Over Unqualified Service Providers
Improper injection techniques can lead to vascular complications. Patient awareness of side effects influences treatment hesitation. Unlicensed providers reduce trust in aesthetic services. Negative media coverage affects brand perception. Litigation risk increases liability costs for clinics. Insurance premiums rise for cosmetic practitioners. Strict training requirements limit rapid workforce expansion. Public health authorities intensify surveillance of unauthorized aesthetic centers.
Market Opportunities:
Expansion Into Emerging Economies With Rising Urbanization And Medical Tourism Growth
Emerging markets present strong untapped patient bases. Urban population growth increases demand for cosmetic services. Medical tourism hubs attract international aesthetic patients. Governments promote private healthcare infrastructure development. Local distributors partner with global filler brands. Affordable treatment pricing improves regional competitiveness. It enables deeper penetration across secondary cities. Awareness campaigns expand outreach to new consumer segments.
Development Of Gender-Neutral And Customized Product Portfolios For Diverse Consumer Groups
Manufacturers introduce filler variants tailored to male facial structure. Customizable viscosity ranges support individualized contour plans. Marketing campaigns highlight inclusive beauty standards. Clinics design consultation models for diverse age groups. Cultural acceptance of cosmetic care expands across regions. Research initiatives focus on ethnic skin compatibility. Product line diversification strengthens brand positioning. It supports sustained differentiation within the Aesthetic Filler Market.
Aesthetic Filler Market Segmentation Analysis:
By Product Type
The Aesthetic Filler Market shows clear dominance of absorbable fillers due to stronger safety profiles and reversibility. Physicians prefer absorbable products for facial contouring, dynamic wrinkle correction, and first-time patients. These fillers align well with evolving aesthetic expectations and allow easy treatment adjustment over time. Non-absorbable fillers maintain a niche role where very long-lasting correction is necessary. Concerns about late-onset adverse events limit their broader use. Regulatory scrutiny further encourages physicians to favor absorbable options. Clinics therefore prioritize versatile, short-to-medium duration products in their core portfolios.
- For instance, Galderma achieved specific FDA approval for Restylane Eyelight for tear trough treatment, with clinical data showing that 87% of patients had a reduction in dark circles and 85% maintained visible improvement through 18 months.
By Material Type
Within the Aesthetic Filler Market, hyaluronic acid fillers hold the largest share because they offer strong hydration, predictable outcomes, and reversal with hyaluronidase. Calcium hydroxylapatite appeals for deeper volumization and structural lift in midface areas. Poly-L-lactic acid supports gradual collagen stimulation and suits patients seeking subtle, progressive improvement. Collagen-based fillers now occupy more specialized roles due to competition from newer materials. Polymers and PMMA particles provide very long-lasting effects but carry higher safety and reputational risk. Physicians usually reserve these materials for carefully selected cases. This diverse material mix supports broad treatment customization.
- For instance, Revance Therapeutics received FDA approval for RHA Redensity, a resilient HA filler, after clinical trials reported a 1-point improvement on the Perioral Rhytid Severity Scale for 80.7% of subjects at 8 weeks post-injection.
By Application
In the Aesthetic Filler Market, facial line and wrinkle correction remains the leading application due to strong demand for anti-ageing solutions. Lip enhancement gains rapid traction among younger demographics seeking subtle contour and volume. Cheek volumization improves midface support and delivers visible lifting effects without surgery. Targeted facelift-style correction with fillers allows staged rejuvenation and lower downtime. Physicians design application plans that address multiple zones in one session. Patient demand favors natural-looking outcomes with balanced proportions. This application diversity supports repeated treatment cycles and strong clinic revenue potential.
Segmentation:
By Product Type
- Absorbable
- Non-absorbable
By Material Type
- Hyaluronic Acid
- Calcium Hydroxylapatite
- Poly-L-lactic Acid
- Collagen
- Polymers and Particles/PMMA
By Application
- Facial line/wrinkle correction
- Lip enhancement/augmentation
- Facelift
- Cheek volumization
By Region
- North America
- U.S.
- Canada
- Mexico
- Europe
- Germany
- France
- U.K.
- Italy
- Spain
- Rest of Europe
- Asia Pacific
- China
- Japan
- India
- South Korea
- South-east Asia
- Rest of Asia Pacific
- Latin America
- Brazil
- Argentina
- Rest of Latin America
- Middle East & Africa
- GCC Countries
- South Africa
- Rest of the Middle East and Africa
Regional Analysis:
North America And Europe Lead Global Revenue Contribution
North America holds the largest share of the [ Aesthetic Filler Market ], accounting for around 35% of global revenue. Strong consumer spending power supports high procedure adoption in the United States and Canada. A dense network of dermatology clinics and med spas sustains recurring demand. Favourable reimbursement for some reconstructive indications supports procedure volumes. Europe follows with roughly 30% share, driven by mature markets such as Germany, France, Italy, and the United Kingdom. Strict regulatory oversight in Europe strengthens product quality and physician confidence. Both regions benefit from early access to new product launches and advanced training.
Asia-Pacific Growth Momentum And Rising Procedure Volumes
Asia-Pacific captures about 25% share of the global market and represents the fastest growing region. Rising disposable income and beauty awareness in China, South Korea, Japan, and India accelerate demand. Medical tourism clusters in South Korea and Thailand attract international patients for filler-based procedures. Strong social media influence supports rapid uptake of lip and facial contour enhancement. Local distributors partner with global brands to improve product reach. The [ Aesthetic Filler Market ] in Asia-Pacific benefits from a young, urban population that values appearance and preventive treatments. Expanding private clinic chains extend access beyond tier-one cities.
Emerging Opportunities In Latin America And Middle East & Africa
Latin America, including Brazil and Mexico, contributes close to 5% share but shows strong growth potential. Aesthetic culture and interest in facial contouring support steady adoption of injectable fillers. Currency volatility and economic swings can restrict premium product uptake in some years. Middle East & Africa together hold around 5% share, led by Gulf countries with high aesthetic spend. Medical tourism in the UAE and Saudi Arabia strengthens regional procedure volumes. The [ Aesthetic Filler Market ] in these regions benefits from rising investments in private cosmetic clinics. Limited specialist density in parts of Africa still constrains broader penetration.
Key Player Analysis:
- AbbVie (Allergan Aesthetics)
- Galderma
- Merz Pharma
- Teoxane Laboratories
- Sinclair Pharma
Competitive Analysis:
The Aesthetic Filler Market features a concentrated competitive landscape dominated by global aesthetics leaders and a strong tier of regional specialists. AbbVie’s Allergan Aesthetics, Galderma, Merz Aesthetics, Teoxane, and Sinclair shape product standards and brand perception worldwide. Each player focuses on differentiated hyaluronic acid and biostimulatory filler portfolios. Companies invest in clinical trials, anatomical training programs, and digital education to strengthen injector loyalty. Strategic pricing tiers target both premium and value-conscious clinics. Mergers, distribution alliances, and equity investments expand reach in high-growth regions. It remains highly innovation-driven, with lifecycle management and line extensions central to long-term positioning. Competitors that pair strong safety data with injector support secure durable market share.
Recent Developments:
- In February 2026, Galderma expanded the Restylane portfolio in Japan by launching OBT hyaluronic acid injectables Restylane Defyne and Refyne, targeting flexible, expression-following facial correction.
- In December 2025, L'Oréal announced the acquisition of an additional 10% stake in Galderma from an EQT-led consortium, increasing its total ownership to 20% and strengthening their scientific partnership in dermatology and aesthetics. The deal, expected to close by Q1 2026, supports Galderma's growth in the aesthetics market.
- In March 2024, Allergan Aesthetics obtained U.S. FDA approval for JUVÉDERM VOLUMA XC to treat moderate to severe temple hollowing, expanding indications within its filler portfolio.
Report Coverage:
The research report offers an in-depth analysis based on Product Type, Material Type, Application, and Region. It details leading market players, providing an overview of their business, product offerings, investments, revenue streams, and key applications. Additionally, the report includes insights into the competitive environment, SWOT analysis, current market trends, as well as the primary drivers and constraints. Furthermore, it discusses various factors that have driven market expansion in recent years. The report also explores market dynamics, regulatory scenarios, and technological advancements that are shaping the industry. It assesses the impact of external factors and global economic changes on market growth. Lastly, it provides strategic recommendations for new entrants and established companies to navigate the complexities of the market.
Future Outlook:
- Demand for minimally invasive facial rejuvenation procedures will continue to rise among younger and mid-age consumers.
- Hyaluronic acid fillers will retain dominance while biostimulatory products gain share in long-term rejuvenation protocols.
- Combination treatment plans with toxins, threads, and devices will become standard in premium aesthetic centers.
- Manufacturers will invest more in data, training, and anatomy education to support safe, advanced injection techniques.
- Digital consultation tools and imaging software will guide personalized facial mapping and outcome planning.
- Growth in Asia-Pacific and Latin America will outpace mature regions due to expanding middle classes and medical tourism.
- Regulatory focus on safety, quality, and injector credentials will tighten market entry requirements.
- Men and older patients will represent rising contributor groups to overall procedure volumes.
- New indications such as temple, chin, and under-eye correction will broaden treatment menus.
- Sustainability and ethical sourcing will gain importance in packaging and corporate positioning.
Request a Free Sample
Fill in your details and we'll send you a free sample report.
- Sample data tables & charts
- Research methodology
Need a Custom Version of This Report?
Tailor the scope, geography, or segments to your exact requirements.
- Custom geography or segment scope
- Direct access to our analyst team
Frequently Asked Questions
What is the current market size for Aesthetic Filler Market, and what is its projected size in 2032?
At what Compound Annual Growth Rate is the Aesthetic Filler Market projected to grow between 2025 and 2032?
Which Aesthetic Filler Market segment held the largest share in 2025?
What are the primary factors fueling the growth of the Aesthetic Filler Market?
Who are the leading companies in the Aesthetic Filler Market?
Which region commanded the largest share of the Aesthetic Filler Market in 2025?
High disposable income and dense clinic networks support strong procedure volumes.
Table of Content
Chapter 1. Report Introduction
- 1.1 Report Description & Purpose
- 1.1.1 Report Title & Market Definition
- 1.1.2 Unique Selling Propositions (USP) & Key Differentiators
- 1.1.3 Value Proposition for Stakeholders
- 1.2 Research Objectives
- 1.2.1 Market Sizing Objectives (Volume & Revenue)
- 1.2.2 Segmentation Objectives
- 1.2.3 Competitive Intelligence Objectives
- 1.2.4 Forecast & Scenario Objectives
- 1.3 Report Scope
- 1.3.1 Aesthetic Filler Scope – Types & Subtypes Covered
- 1.3.2 Geographic Scope – Regions & Countries Covered
- 1.3.3 Historical Period, Base Year & Forecast Period (the historical period; forecast to the forecast period)
- 1.3.4 Inclusions & Exclusions
- 1.4 HS Code & Classification Framework
- 1.5 Currency, Units & Pricing Basis
- 1.6 Target Stakeholders
- 1.7 Limitations & Assumptions
Chapter 2. Executive Summary
- 2.1 Global Aesthetic Filler Market Snapshot
- 2.1.1 Market Size – Historical (the historical period) & Forecast (the forecast period) (base year: USD 6,257.5 million → forecast year: USD 10,087.69 million)
- 2.1.2 Volume & Revenue – Global Totals
- 2.1.3 Key Market Highlights – Top Five Facts
- 2.2 Aesthetic Filler Market Segmentation Snapshot
- 2.2.1 Market Split by Region – vs.
- 2.3 Competitive Snapshot
- 2.3.1 Top 10 Players by Revenue Share –
- 2.3.2 Top 10 Players by Volume Share –
- 2.3.3 Recent Strategic Developments (18-Month Summary)
- 2.4 Key Investment Highlights & Strategic Conclusions
Chapter 3. Aesthetic Filler Market Dynamics & Industry Analysis
- 3.1 Market Overview & Context
- 3.1.1 Aesthetic Filler Market Position in the Broader Automotive Value Chain
- 3.1.2 OEM vs. Replacement Market Dynamics
- 3.1.3 Market Maturity & Development Stage by Region
- 3.2 Aesthetic Filler Market Drivers
- 3.3 Aesthetic Filler Market Restraints & Challenges
- 3.4 Aesthetic Filler Market Opportunities
- 3.5 Porter's Five Forces Analysis
- 3.5.1 Threat of New Entrants
- 3.5.2 Bargaining Power of Suppliers
- 3.5.3 Bargaining Power of Buyers
- 3.5.4 Threat of Substitutes
- 3.5.5 Competitive Rivalry – Intensity Assessment
- 3.6 Aesthetic Filler Value Chain Analysis
- 3.6.1 Upstream – Raw Material/Input Suppliers
- 3.6.1.1 Raw Material/Input 1
- 3.6.1.2 Raw Material/Input 2
- 3.6.1.3 Raw Material/Input 3
- 3.6.2 Midstream – Production/Manufacturing/Service Delivery
- 3.6.2.1 Production/Process Overview
- 3.6.2.2 Key Facility Locations & Capacity by Manufacturer
- 3.6.3 Downstream – Distribution & End Consumer
- 3.6.3.1 Primary Channel – B2B/OEM
- 3.6.3.2 Secondary Channels – Dealer, Retail, Online, Direct
- 3.6.4 Value Chain Profitability Analysis
- 3.6.1 Upstream – Raw Material/Input Suppliers
- 3.7 PESTEL Analysis
- 3.7.1 Political Factors
- 3.7.2 Economic Factors
- 3.7.3 Social Factors
- 3.7.4 Technological Factors
- 3.7.5 Environmental Factors
- 3.7.6 Legal Factors
- 3.8 Aesthetic Filler Supply Chain Analysis
- 3.8.1 Raw Material/Input Supply Risk Assessment
- 3.8.2 Manufacturing Concentration Risk (Geographic Exposure)
- 3.8.3 Trade Disruption Impact Analysis
- 3.9 Regulatory & Policy Landscape
Note: The regulatory and policy landscape section covers regulations based on their applicability to the market, Aesthetic Filler category, geography, and scope of the study. Only regulatory frameworks with a material impact on operations, compliance, trade, sustainability, or market access are analyzed in detail.
Chapter 4. Key Investment Pockets & Opportunity Analysis
- 4.1 Aesthetic Filler Market Attractiveness Analysis
- 4.1.1 By Region – Investment Attractiveness Matrix (Volume × CAGR)
- 4.2 Absolute Revenue Growth Opportunity
- 4.2.1 By Region – Absolute USD Growth Through the forecast period
- 4.3 Incremental Volume Opportunity
- 4.3.1 By Region – Incremental Volume Through the forecast period
- 4.3.2 Segment – Incremental Volume
- 4.4 Emerging Submarket Opportunity Deep Dive (Subject to Applicability)
- 4.5 Emerging Market Opportunity Scorecards
- 4.5.1 United States
- 4.5.2 Europe
- 4.5.3 Asia
- 4.5.4 Middle East & Africa
Note: Emerging Market Opportunity Scorecards will be included based on relevance and strategic importance. Regions listed are indicative and may vary depending on data availability and market dynamics.
Chapter 5. Aesthetic Filler Import-Export Analysis & Trade Flows
- 5.1 Global Trade Overview
- 5.1.1 Global Export Value by Country (the historical period)
- 5.1.2 Global Export Volume by Country (the historical period)
- 5.1.3 Global Import Value by Country (the historical period)
- 5.1.4 Global Import Volume by Country (the historical period)
- 5.1.5 Net Trade Balance by Country (the historical period)
- 5.2 Export Analysis – Segment
- 5.2.1 Type 1 (HS Code)
- 5.2.2 Type 2 (HS Code)
- 5.2.3 Type 3 (HS Code)
- 5.2.4 Type 4 (HS Code)
- 5.2.5 Type 5 (HS Code)
- 5.3 Import Analysis – Segment
- 5.3.1 Type 1 (HS Code)
- 5.3.2 Type 2 (HS Code)
- 5.3.3 Type 3 (HS Code)
- 5.3.4 Type 4 (HS Code)
- 5.3.5 Type 5 (HS Code)
- 5.4 Average Unit Trade Prices
- 5.4.1 Average Export Price – Segment & Country
- 5.4.2 Average Import Price – Segment & Source Country
- 5.4.3 Price Trends (the historical period)
- 5.5 Key Trade Route Analysis
- 5.5.1 Trade Route 1
- 5.5.2 Trade Route 2
- 5.5.3 Trade Route 3
- 5.5.4 Trade Route 4
- 5.5.5 Trade Route 5
- 5.6 Trade Policy Impact Assessment
- 5.6.1 US Anti-Dumping & Section 301 Tariffs
- 5.6.2 EU Customs Union Impact
- 5.6.3 Major Free Trade Agreements
- 5.6.4 USMCA Rules of Origin
Note: Trade policy analysis will be included only where relevant to the Aesthetic Filler market.
Chapter 6. Competitive Landscape & Company Benchmarking
- 6.1 Aesthetic Filler Market Concentration & Structure
- 6.1.1 Herfindahl-Hirschman Index (HHI) – vs.
- 6.1.2 Tier 1, Tier 2 & Tier 3 Market Structure
- 6.1.3 Global, Regional & Local Player Dynamics
- 6.2 Aesthetic Filler Market Share Analysis –
- 6.2.1 Global Revenue Share by Company
- 6.2.2 Global Volume Share by Company
- 6.2.3 Regional Revenue Share
- 6.2.4 Market Share Evolution ( vs. )
- 6.2.5 OEM Segment Share by Company
- 6.2.6 Replacement Segment Share by Company
- 6.3 Production/Delivery Capacity & Facility Analysis
- 6.3.1 Global Installed Capacity
- 6.3.2 Capacity Utilization Rates
- 6.3.3 Production/Output Volume
- 6.3.4 Facility Locations & Capacity Map
- 6.3.5 Planned Capacity Additions
- 6.4 Aesthetic Filler Competitive Benchmarking Matrix
- 6.4.1 Revenue, Volume, CAGR & Profitability Comparison
- 6.4.2 Channel Revenue Mix
- 6.4.3 Geographic Revenue Exposure
- 6.4.4 R&D Intensity
- 6.4.5 Sustainability Maturity
- 6.5 Strategic Developments in Aesthetic Filler (Last 24 Months)
- 6.5.1 Mergers, Acquisitions & Divestments
- 6.5.2 New Aesthetic Filler Launches
- 6.5.3 Facility Expansions
- 6.5.4 Strategic Alliances, Joint Ventures & Partnerships
- 6.5.5 Distribution Expansion & Market Entry
- 6.5.6 Sustainability & ESG Initiatives
- 6.6 Competitive Strategy Mapping
- 6.6.1 Leader, Challenger, Follower & Niche Classification
- 6.6.2 Pricing Strategy Comparison
- 6.6.3 Channel Strategy Matrix
Note: Strategic developments are included based on their materiality and the availability of reliable information.
Chapter 7. Global Aesthetic Filler Market – By Distribution Channel
- 7.1 Segment Overview
- 7.1.1 Volume & Revenue Split by Channel ( & )
- 7.1.2 Channel Mix Evolution (the forecast period)
Chapter 8. Regional Market Analysis – Global Overview
- 8.1 Global Regional Overview
- 8.1.1 Regional Volume Share
- 8.1.2 Regional Revenue Share
- 8.1.3 Regional Volume by Region
- 8.1.4 Regional Revenue by Region
- 8.1.5 Regional Forecast Through the forecast period
- 8.2 Cross-Regional Segment Analysis
- 8.2.1 By Distribution Channel
- 8.2.2 By Brand/Price Tier
Chapter 9. North America Aesthetic Filler Market
- 9.1 United States
- 9.2 Canada
- 9.3 Mexico
Chapter 10. Europe Aesthetic Filler Market
- 10.1 Germany
- 10.2 France
- 10.3 Italy
- 10.4 United Kingdom
- 10.5 Spain
- 10.6 Poland
- 10.7 Russia
- 10.8 Netherlands
- 10.9 Belgium
- 10.10 Sweden
- 10.11 Denmark
- 10.12 Norway
- 10.13 Rest of Europe
Chapter 11. Asia Pacific Aesthetic Filler Market
- 11.1 China
- 11.2 India
- 11.3 Japan
- 11.4 South Korea
- 11.5 Thailand
- 11.6 Indonesia
- 11.7 Vietnam
- 11.8 Malaysia
- 11.9 Australia
- 11.10 Rest of Asia Pacific
Chapter 12. Latin America Aesthetic Filler Market
- 12.1 Brazil
- 12.2 Argentina
- 12.3 Colombia
- 12.4 Chile
- 12.5 Rest of Latin America
Chapter 13. Middle East Aesthetic Filler Market
- 13.1 Saudi Arabia
- 13.2 United Arab Emirates
- 13.3 Turkey
- 13.4 Israel
- 13.5 Iran
- 13.6 Rest of the Middle East
Chapter 14. Africa Aesthetic Filler Market
- 14.1 South Africa
- 14.2 Egypt
- 14.3 Nigeria
- 14.4 Morocco
- 14.5 Rest of Africa
Chapter 15. Aesthetic Filler Company Profiles
- 15.1 [Company 01]
- 15.1.1 Company Overview
- 15.1.2 Key Management Personnel
- 15.1.3 Products & Services Portfolio
- 15.1.4 Financial Performance
- 15.1.5 Key Market Focus & Geographic Presence
- 15.1.6 Recent Developments & Strategic Initiatives
Note: The company profile list is preliminary and may change based on research findings, market developments, data availability, and client requirements.
Chapter 16. Appendices
- Appendix A – List of Abbreviations & Acronyms
- Appendix B – Industry Classification Code Reference – Full Series
- Appendix C – Production & Capacity Data Tables
- Appendix D – End-Use & Demand Base Tables
- Appendix E – Consumption & Replacement Rate Assumptions
- Appendix F – ASP Reference Tables
- Appendix G – Manufacturing & Facility Database
- Appendix H – Import-Export Data Tables
- Appendix I – Regulatory Summary Tables
- Appendix J – Primary Research Participant List (Anonymized)
- Appendix K – Primary Research Questionnaire Framework
- Appendix L – Data Sources & Bibliography
- Appendix M – Market Size Divergence & Source Comparison
Chapter 17. Research Methodology
- 17.1 Research Framework & Philosophy
- 17.2 Secondary Research – Sources, Hierarchy & Data Extraction
- 17.3 Data Modeling – Bottom-Up & Top-Down Market Sizing
- 17.4 Primary Research – Stakeholder Framework, LOI & Sample Sizes
- 17.5 Forecast Methodology – Regression, Scenario & Sensitivity Analysis
- 17.6 Quality Control – Four-Layer Validation Framework
- 17.7 Limitations & Standard Assumptions
- 17.8 Disclaimer
