
U.S. Ultraviolet Disinfection Equipment Market Overview:
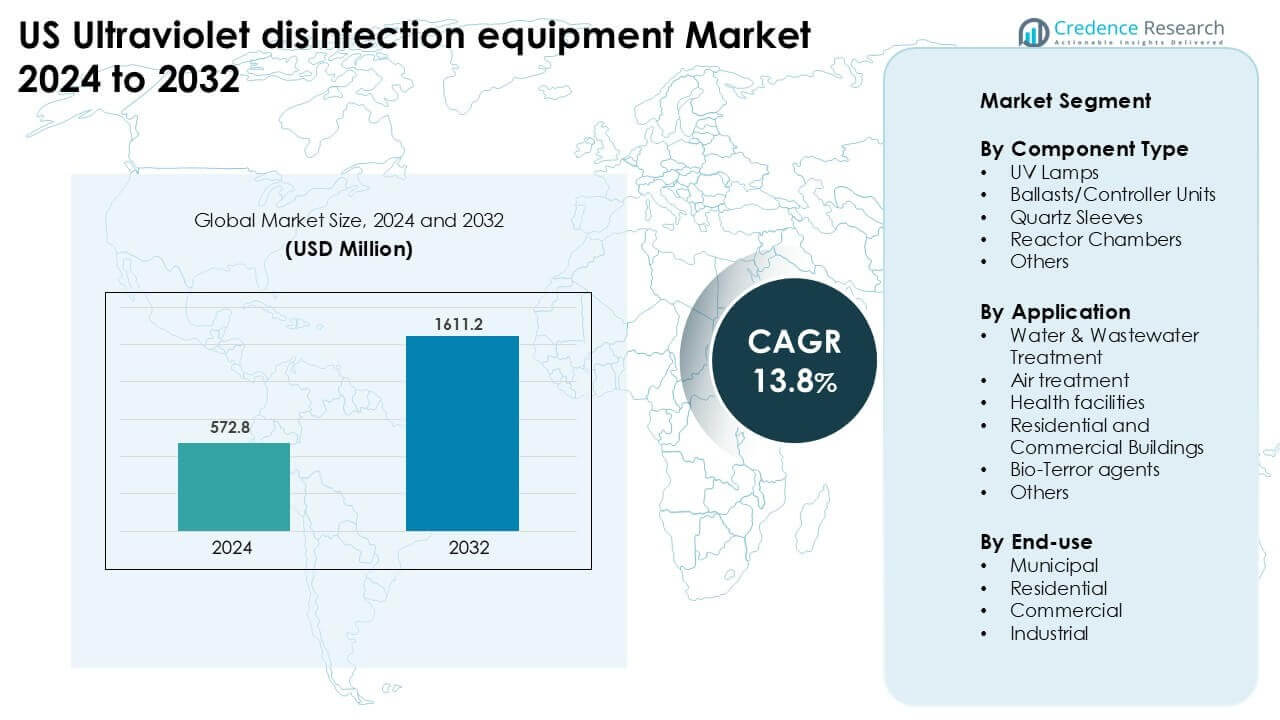
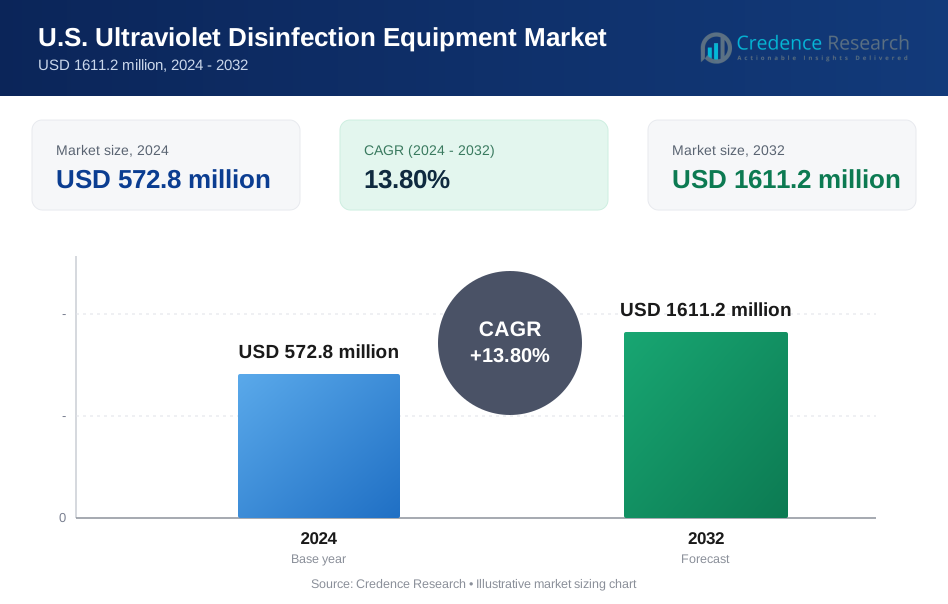
US Ultraviolet disinfection equipment Market was valued at USD 572.8 million in 2024 and is anticipated to reach USD 1611.2 million by 2032, growing at a CAGR of 13.8% during the forecast period.
| REPORT ATTRIBUTE | DETAILS |
|---|---|
| Historical Period | 2020-2024 |
| Base Year | 2025 |
| Forecast Period | 2026-2032 |
| U.S. Ultraviolet Disinfection Equipment Market Size 2024 | USD 572.8 million |
| U.S. Ultraviolet Disinfection Equipment Market, CAGR | 13.8% |
| U.S. Ultraviolet Disinfection Equipment Market Size 2032 | USD 1611.2 million |
U.S. Ultraviolet Disinfection Equipment Market Insights
- Strong demand comes from the water and wastewater segment, which holds about 55% share due to strict safety rules and the push for chemical-free treatment.
- Smart UV systems and LED-UV units gain traction as buildings and industries seek energy savings and automated control.
- Key players include Xylem Inc., Evoqua, Trojan Technologies, and Halma PLC, with competition focused on efficient lamps, durable reactors, and lower operating costs.
- The Northeast leads with 31% regional share, supported by dense cities and strict regulations, while UV lamps remain the dominant component with nearly 42% share nationwide.
U.S. Ultraviolet Disinfection Equipment Market Segmentation Analysis:
By Component Type
UV lamps lead this segment with about 42% share in 2024 due to strong use across municipal and industrial treatment systems. These lamps deliver reliable germicidal output and support continuous disinfection cycles. Growing upgrades in wastewater plants drive higher lamp replacement demand. Quartz sleeves follow because they protect lamps from fouling and improve efficiency. Ballasts and controller units gain steady growth through rising automation in disinfection setups. Reactor chambers expand with wider adoption of compact and energy-efficient UV systems across commercial facilities.
- For instance, Trojan Technologies supplied 56 UV disinfection reactor units for the Catskill‑Delaware Ultraviolet Disinfection Facility in New York, where each reactor bank treats part of the 2.2 billion gallons per day capacity using high‑output lamps designed to replace older mercury lamps with up to tenfold greater power per lamp.
By Application
Water and wastewater treatment holds the dominant position with nearly 55% share in 2024, driven by strict EPA guidelines and rising investment in municipal water safety. Utilities prefer UV due to chemical-free operation and consistent pathogen removal. Air treatment applications grow as hospitals, offices, and transit systems adopt UV for indoor safety. Health facilities use UV for surface and air disinfection in critical care areas. Residential and commercial buildings expand demand for HVAC-integrated UV units. Bio-terror agent mitigation remains a niche but strategically important use case.
- For instance, the Catskill‑Delaware Water Ultraviolet Disinfection Facility treats up to 2.2 billion gallons of drinking water daily using a bank of 56 UV reactors designed to inactivate chlorine‑resistant pathogens such as Cryptosporidium and Giardia with engineered UV dose delivery.
By End-use
Municipal end users lead with around 47% share in 2024 because large-scale treatment plants rely heavily on UV systems for regulatory compliance. Growing urban demand for safe drinking water boosts municipal installations. Industrial users expand adoption across food processing, pharmaceuticals, and electronics due to strict hygiene needs. Commercial facilities adopt UV for HVAC systems and surface sterilization. Residential users show rising interest in point-of-entry and point-of-use UV units, supported by higher awareness of waterborne contaminants and indoor air concerns.
Key Growth Drivers
Rising Need for Chemical-Free Disinfection
Growing concerns around chemical disinfectants push demand for UV systems across US municipal, commercial, and residential settings. Utilities adopt UV to avoid chemical by-products and comply with EPA regulations focused on safer water treatment. Healthcare and food industries also shift toward UV due to its ability to kill pathogens without residues or storage risks. Indoor air quality awareness further strengthens adoption in HVAC systems and air sterilizers. Schools, airports, and hospitals deploy UV to meet rising sanitation expectations. The shift toward eco-friendly methods accelerates investment in UV as a long-term, low-maintenance alternative. This strong push for safer, greener disinfection continues to shape market expansion.
- For instance, The Catskill-Delaware Water Ultraviolet Disinfection Facility (located in Eastview, NY) does utilize 56 custom TrojanUV units.
Infrastructure Upgrades in Water and Wastewater Facilities
US municipalities upgrade aging treatment infrastructure, fueling large-scale deployment of UV systems. Many existing chlorine-based systems face stricter compliance needs, creating demand for modern UV reactors that improve pathogen inactivation. Federal and state funding for water safety enhances adoption, especially in regions facing contamination challenges. High flow-rate UV systems now support advanced treatment requirements for Giardia, Cryptosporidium, and emerging pathogens. Wastewater reuse programs also rely on UV as the preferred tertiary disinfection step. Continuous investment in modernization ensures long-term growth and stable replacement cycles. These upgrades form the backbone of UV adoption across public utilities.
- For instance, the Croton Water Filtration Plant in The Bronx integrates UV disinfection as part of its treatment train with a capacity to process 320 million gallons per day, enabling compliance with drinking water microbial safety mandates for Giardia and Cryptosporidium control in a major metropolitan distribution system.
Increasing Indoor Air Quality Prioritization
Post-pandemic awareness drives heavy investment in UV-based air treatment across public and commercial buildings. UV-C integration in HVAC systems helps reduce airborne pathogens and supports healthier indoor spaces. Hospitals, office complexes, transit hubs, and educational institutions now view UV as essential for infection control. The technology offers reliable performance with low operational costs and easy retrofitting. Demand also rises for upper-room UV systems and portable units in high-traffic spaces. Corporate wellness programs and indoor air quality standards further push adoption. This sustained focus on cleaner indoor air continues to expand UV equipment penetration nationwide.
Key Trends & Opportunities
Shift Toward Smart and Energy-Efficient UV Systems
The US market sees strong movement toward intelligent UV platforms featuring sensors, remote monitoring, and automated dose control. These systems optimize energy use, extend lamp life, and ensure consistent disinfection performance. IoT-enabled units help municipal operators track system efficiency and respond to issues in real time. LED-based UV technologies also gain traction due to longer lifespan, reduced heat output, and lower power needs. Businesses seek these energy-efficient upgrades to meet sustainability targets and reduce operating costs. This trend creates major opportunities for manufacturers offering advanced, low-energy, and digitally connected UV solutions.
- For instance, Signify has over 35 years of experience in UV-C technology and offers a wide portfolio of UV-C products for professional and consumer use.
Growing Use of UV in HVAC, Healthcare, and High-Purity Industries
HVAC-integrated UV systems rise sharply as buildings aim to improve air quality while controlling operational costs. Hospitals adopt UV for critical zones like ICUs and operating rooms to reduce infection risks. Pharmaceutical and electronics industries also expand UV use for high-purity water and air requirements. Portable and automated UV robots gain popularity for surface disinfection across commercial spaces. Growth in data centers, labs, and semiconductor facilities opens new opportunities for precision UV solutions that support contamination control. These expanding applications create strong multi-sector demand and widen market opportunities across the US.
- For instance, UVDI’s V‑MAX UV‑C technology has been installed in more than 1 500 facilities worldwide including major healthcare buildings such as the Louisiana Health Sciences Center Medical Education Building where each lamp is individually tested for 9 000 hours of operational life and used to continuously disinfect HVAC and indoor air.
Emerging Opportunities in Residential Water and Air Systems
Rising consumer awareness of contaminants and airborne pathogens boosts household demand for UV-based point-of-use and point-of-entry systems. Residential HVAC UV modules gain adoption due to easy installation and measurable indoor air benefits. Homeowners seek maintenance-friendly UV solutions that avoid chemicals and provide reliable protection. Growth of smart home ecosystems creates opportunity for app-connected UV units with automated alerts. Retail and online channels expand product accessibility, supporting wider adoption. This shift toward home-based UV solutions forms a growing revenue stream for manufacturers.
Key Challenges
High Initial Costs and Maintenance Requirements
UV disinfection systems often involve higher upfront investment compared to chemical-based alternatives. Municipal projects require significant capital for lamp arrays, reactors, and control units. Lamp replacements and sleeve cleaning add ongoing maintenance costs, which smaller facilities may find challenging. Industrial users also face higher spending for energy-efficient or high-capacity UV systems. Budget constraints in local utilities slow project approvals and delay upgrades. These financial barriers remain a key challenge for broader market adoption despite long-term operational benefits.
Performance Sensitivity and Technical Limitations
UV performance depends heavily on water clarity, flow rate, and lamp intensity. Turbid water or fouled quartz sleeves can reduce effectiveness, requiring frequent monitoring and maintenance. Some pathogens show higher UV resistance, demanding precise dose control. Overexposure risks material degradation in HVAC systems if not correctly installed. LED UV technologies, while promising, still face limitations in output power for large-scale municipal use. These technical constraints require continuous operator training and proper system design, posing challenges for facilities with limited expertise.
Regional Analysis
Northeast United States
The Northeast holds about 31% share of the US ultraviolet disinfection equipment market in 2024, driven by strong municipal investments and strict state-level water quality regulations. Aging water infrastructure across New York, New Jersey, and Pennsylvania increases demand for UV upgrades in both drinking water and wastewater plants. Hospitals and research facilities adopt UV for high sterilization standards, boosting air and surface disinfection use. Dense urban housing also supports wider residential adoption of HVAC-integrated UV systems. Increased focus on public health and compliance ensures steady long-term regional growth.
Midwest United States
The Midwest accounts for nearly 28% share of the national market, supported by extensive municipal water treatment operations across Illinois, Ohio, Michigan, and Minnesota. The region has a large base of older treatment plants undergoing modernization, which accelerates UV system deployment. Manufacturing and food-processing industries use UV for hygiene, driving strong industrial adoption. Cold-weather states show rising demand for indoor air purification in commercial and institutional buildings. Growing federal funding for water safety and contamination control supports market expansion. The region continues to upgrade from legacy chemical disinfection toward UV-based systems.
South United States
The South holds about 23% share of the US market, with rapid growth driven by expanding urban populations and high water consumption across Texas, Florida, Georgia, and North Carolina. Municipal utilities increasingly adopt UV to meet regulations for pathogen control and reuse applications. Commercial facilities such as airports, schools, and hospitals invest in UV-integrated HVAC systems for air sanitation. Humid climates also boost demand for mold-reduction UV solutions. Rising residential construction and high awareness of indoor air quality strengthen consumer adoption. Industrial sectors including food, chemicals, and electronics add further demand.
West United States
The West represents nearly 18% share, influenced by strong sustainability policies and high adoption of chemical-free treatment systems. States like California, Washington, and Colorado promote advanced water reuse programs where UV plays a key role in tertiary disinfection. The region’s large healthcare, biotechnology, and semiconductor sectors rely on UV for air and high-purity water systems. Wildfire-related air quality issues increase demand for UV-based air purification in residential and commercial buildings. The region also leads in early adoption of LED-UV technologies, driven by energy efficiency goals and environmental regulations.
U.S. Ultraviolet Disinfection Equipment Market Segmentations:
By Component Type
- UV Lamps
- Ballasts/Controller Units
- Quartz Sleeves
- Reactor Chambers
- Others
By Application
- Water & Wastewater Treatment
- Air treatment
- Health facilities
- Residential and Commercial Buildings
- Bio-Terror agents
- Others
By End-use
- Municipal
- Residential
- Commercial
- Industrial
By Geography
- Midwestern United States
- Southern United States
- Western United States
- Northeastern United States
Competitive Landscape
The competitive landscape of the US ultraviolet disinfection equipment market features established players such as Xylem Inc., Evoqua Water Technologies LLC, Atlantic Ultraviolet Corporation, Halma PLC, Trojan Technologies, Kuraray Co., LTD, and several specialized UV system manufacturers. These companies compete through advanced reactor designs, higher lamp efficiency, and integration of smart monitoring technologies that improve operational reliability. Many firms expand portfolios to include LED-UV modules, modular air systems, and compact residential units to serve diverse end users. Strategic partnerships with municipal utilities, healthcare networks, and industrial clients strengthen market reach. Continuous investment in research enhances UV dose optimization, energy savings, and pathogen-inactivation performance. Manufacturers also focus on regulatory compliance, offering systems aligned with EPA, FDA, and ASHRAE standards. Rising demand for chemical-free disinfection supports strong competition centered on innovation, sustainability, and lifecycle cost reduction.
Key Player Analysis
- American Ultraviolet
- Evoqua Water Technologies LLC
- Kuraray Co., LTD
- Xylem Inc.
- Hoenle AG
- Advanced UV, Inc.
- Atlantium Technologies LTD.
- Halma PLC
- Atlantic Ultraviolet Corporation
- Trojan Technologies
Recent Developments
- In December 2025, Global Industry Analysts profiled Advanced UV, Inc. in its UV disinfection report. The study lists the company among key manufacturers serving water treatment applications. This recognition supports Advanced UV’s visibility within the U.S. ultraviolet disinfection equipment market.
- In September 2025, Dr. Hönle AG completed a group-wide rebranding to Hoenle AG with a new corporate identity and consolidated business units including Disinfection to streamline global operations and better serve industrial and UV-disinfection customers.
- In April 2025, Atlantic Ultraviolet Corporation (Relevant to comparison but not in your list) Atlantic Ultraviolet (U.S.) launched the SaniUV-Cube – a UV-C disinfection cabinet designed for commercial, industrial, and institutional disinfection of surfaces and items.
Report Coverage
The research report offers an in-depth analysis based on Component Type, Application, End-Use and Geography. It details leading market players, providing an overview of their business, product offerings, investments, revenue streams, and key applications. Additionally, the report includes insights into the competitive environment, SWOT analysis, current market trends, as well as the primary drivers and constraints. Furthermore, it discusses various factors that have driven market expansion in recent years. The report also explores market dynamics, regulatory scenarios, and technological advancements that are shaping the industry. It assesses the impact of external factors and global economic changes on market growth. Lastly, it provides strategic recommendations for new entrants and established companies to navigate the complexities of the market.
Future Outlook
- Demand for chemical-free disinfection will grow across municipal and commercial sectors.
- UV-C integration in HVAC systems will expand due to rising indoor air quality needs.
- LED-UV technology adoption will increase as efficiency and lifespan improve.
- Water reuse programs will drive higher investments in advanced UV reactors.
- Smart UV systems with sensors and remote monitoring will see wider use.
- Healthcare facilities will continue adopting UV for air and surface sterilization.
- Residential UV systems will expand with rising awareness of water and air safety.
- Industrial users will adopt UV to meet stricter hygiene and contamination standards.
- Replacement cycles for lamps and sleeves will support steady aftermarket growth.
- Sustainability regulations will encourage faster transition from chemical disinfectants to UV solutions.
Request a Free Sample
Fill in your details and we'll send you a free sample report.
- Sample data tables & charts
- Research methodology
Need a Custom Version of This Report?
Tailor the scope, geography, or segments to your exact requirements.
- Custom geography or segment scope
- Direct access to our analyst team
Frequently Asked Questions
What is the current market size for US Ultraviolet disinfection equipment Market, and what is its projected size in 2032?
At what Compound Annual Growth Rate is US Ultraviolet disinfection equipment Market projected to grow between 2024 and 2032?
Which US Ultraviolet disinfection equipment Market segment held the largest share in 2024?
What are the primary factors fueling the growth of US Ultraviolet disinfection equipment Market?
Who are the leading companies in US Ultraviolet disinfection equipment Market?
Which region commanded the largest share of US Ultraviolet disinfection equipment Market?
Table of Content
Chapter 1. Report Introduction
- 1.1 Report Description & Purpose
- 1.1.1 Report Title & Market Definition
- 1.1.2 Unique Selling Propositions (USP) & Key Differentiators
- 1.1.3 Value Proposition for Stakeholders
- 1.2 Research Objectives
- 1.2.1 Market Sizing Objectives (Volume & Revenue)
- 1.2.2 Segmentation Objectives
- 1.2.3 Competitive Intelligence Objectives
- 1.2.4 Forecast & Scenario Objectives
- 1.3 Report Scope
- 1.3.1 U.S. Ultraviolet Disinfection Equipment Scope – Types & Subtypes Covered
- 1.3.2 Geographic Scope – Regions & Countries Covered
- 1.3.3 Historical Period, Base Year & Forecast Period (2024; forecast to 2032)
- 1.3.4 Inclusions & Exclusions
- 1.4 HS Code & Classification Framework
- 1.5 Currency, Units & Pricing Basis
- 1.6 Target Stakeholders
- 1.7 Limitations & Assumptions
Chapter 2. Executive Summary
- 2.1 Global U.S. Ultraviolet Disinfection Equipment Market Snapshot
- 2.1.1 Market Size – Historical (2024) & Forecast (2024-2032) (2024: USD 572.8 million → 2032: USD 1611.2 million)
- 2.1.2 Volume & Revenue – Global Totals
- 2.1.3 Key Market Highlights – Top Five Facts
- 2.2 U.S. Ultraviolet Disinfection Equipment Market Segmentation Snapshot
- 2.2.1 Market Split by Region – 2024 vs. 2032
- 2.3 Competitive Snapshot
- 2.3.1 Top 10 Players by Revenue Share – 2024
- 2.3.2 Top 10 Players by Volume Share – 2024
- 2.3.3 Recent Strategic Developments (18-Month Summary)
- 2.4 Key Investment Highlights & Strategic Conclusions
Chapter 3. U.S. Ultraviolet Disinfection Equipment Market Dynamics & Industry Analysis
- 3.1 Market Overview & Context
- 3.1.1 U.S. Ultraviolet Disinfection Equipment Market Position in the Broader Automotive Value Chain
- 3.1.2 OEM vs. Replacement Market Dynamics
- 3.1.3 Market Maturity & Development Stage by Region
- 3.2 U.S. Ultraviolet Disinfection Equipment Market Drivers
- 3.3 U.S. Ultraviolet Disinfection Equipment Market Restraints & Challenges
- 3.4 U.S. Ultraviolet Disinfection Equipment Market Opportunities
- 3.5 Porter's Five Forces Analysis
- 3.5.1 Threat of New Entrants
- 3.5.2 Bargaining Power of Suppliers
- 3.5.3 Bargaining Power of Buyers
- 3.5.4 Threat of Substitutes
- 3.5.5 Competitive Rivalry – Intensity Assessment
- 3.6 U.S. Ultraviolet Disinfection Equipment Value Chain Analysis
- 3.6.1 Upstream – Raw Material/Input Suppliers
- 3.6.1.1 Raw Material/Input 1
- 3.6.1.2 Raw Material/Input 2
- 3.6.1.3 Raw Material/Input 3
- 3.6.2 Midstream – Production/Manufacturing/Service Delivery
- 3.6.2.1 Production/Process Overview
- 3.6.2.2 Key Facility Locations & Capacity by Manufacturer
- 3.6.3 Downstream – Distribution & End Consumer
- 3.6.3.1 Primary Channel – B2B/OEM
- 3.6.3.2 Secondary Channels – Dealer, Retail, Online, Direct
- 3.6.4 Value Chain Profitability Analysis
- 3.6.1 Upstream – Raw Material/Input Suppliers
- 3.7 PESTEL Analysis
- 3.7.1 Political Factors
- 3.7.2 Economic Factors
- 3.7.3 Social Factors
- 3.7.4 Technological Factors
- 3.7.5 Environmental Factors
- 3.7.6 Legal Factors
- 3.8 U.S. Ultraviolet Disinfection Equipment Supply Chain Analysis
- 3.8.1 Raw Material/Input Supply Risk Assessment
- 3.8.2 Manufacturing Concentration Risk (Geographic Exposure)
- 3.8.3 Trade Disruption Impact Analysis
- 3.9 Regulatory & Policy Landscape
Note: The regulatory and policy landscape section covers regulations based on their applicability to the market, U.S. Ultraviolet Disinfection Equipment category, geography, and scope of the study. Only regulatory frameworks with a material impact on operations, compliance, trade, sustainability, or market access are analyzed in detail.
Chapter 4. Key Investment Pockets & Opportunity Analysis
- 4.1 U.S. Ultraviolet Disinfection Equipment Market Attractiveness Analysis
- 4.1.1 By Region – Investment Attractiveness Matrix (Volume × CAGR)
- 4.2 Absolute Revenue Growth Opportunity
- 4.2.1 By Region – Absolute USD Growth Through 2032
- 4.3 Incremental Volume Opportunity
- 4.3.1 By Region – Incremental Volume Through 2032
- 4.3.2 Segment – Incremental Volume
- 4.4 Emerging Submarket Opportunity Deep Dive (Subject to Applicability)
- 4.5 Emerging Market Opportunity Scorecards
- 4.5.1 United States
- 4.5.2 Europe
- 4.5.3 Asia
- 4.5.4 Middle East & Africa
Note: Emerging Market Opportunity Scorecards will be included based on relevance and strategic importance. Regions listed are indicative and may vary depending on data availability and market dynamics.
Chapter 5. U.S. Ultraviolet Disinfection Equipment Import-Export Analysis & Trade Flows
- 5.1 Global Trade Overview
- 5.1.1 Global Export Value by Country (2024)
- 5.1.2 Global Export Volume by Country (2024)
- 5.1.3 Global Import Value by Country (2024)
- 5.1.4 Global Import Volume by Country (2024)
- 5.1.5 Net Trade Balance by Country (2024)
- 5.2 Export Analysis – Segment
- 5.2.1 Type 1 (HS Code)
- 5.2.2 Type 2 (HS Code)
- 5.2.3 Type 3 (HS Code)
- 5.2.4 Type 4 (HS Code)
- 5.2.5 Type 5 (HS Code)
- 5.3 Import Analysis – Segment
- 5.3.1 Type 1 (HS Code)
- 5.3.2 Type 2 (HS Code)
- 5.3.3 Type 3 (HS Code)
- 5.3.4 Type 4 (HS Code)
- 5.3.5 Type 5 (HS Code)
- 5.4 Average Unit Trade Prices
- 5.4.1 Average Export Price – Segment & Country
- 5.4.2 Average Import Price – Segment & Source Country
- 5.4.3 Price Trends (2024)
- 5.5 Key Trade Route Analysis
- 5.5.1 Trade Route 1
- 5.5.2 Trade Route 2
- 5.5.3 Trade Route 3
- 5.5.4 Trade Route 4
- 5.5.5 Trade Route 5
- 5.6 Trade Policy Impact Assessment
- 5.6.1 US Anti-Dumping & Section 301 Tariffs
- 5.6.2 EU Customs Union Impact
- 5.6.3 Major Free Trade Agreements
- 5.6.4 USMCA Rules of Origin
Note: Trade policy analysis will be included only where relevant to the U.S. Ultraviolet Disinfection Equipment market.
Chapter 6. Competitive Landscape & Company Benchmarking
- 6.1 U.S. Ultraviolet Disinfection Equipment Market Concentration & Structure
- 6.1.1 Herfindahl-Hirschman Index (HHI) – vs. 2024
- 6.1.2 Tier 1, Tier 2 & Tier 3 Market Structure
- 6.1.3 Global, Regional & Local Player Dynamics
- 6.2 U.S. Ultraviolet Disinfection Equipment Market Share Analysis – 2024
- 6.2.1 Global Revenue Share by Company
- 6.2.2 Global Volume Share by Company
- 6.2.3 Regional Revenue Share
- 6.2.4 Market Share Evolution ( vs. 2024)
- 6.2.5 OEM Segment Share by Company
- 6.2.6 Replacement Segment Share by Company
- 6.3 Production/Delivery Capacity & Facility Analysis
- 6.3.1 Global Installed Capacity
- 6.3.2 Capacity Utilization Rates
- 6.3.3 Production/Output Volume
- 6.3.4 Facility Locations & Capacity Map
- 6.3.5 Planned Capacity Additions
- 6.4 U.S. Ultraviolet Disinfection Equipment Competitive Benchmarking Matrix
- 6.4.1 Revenue, Volume, CAGR & Profitability Comparison
- 6.4.2 Channel Revenue Mix
- 6.4.3 Geographic Revenue Exposure
- 6.4.4 R&D Intensity
- 6.4.5 Sustainability Maturity
- 6.5 Strategic Developments in U.S. Ultraviolet Disinfection Equipment (Last 24 Months)
- 6.5.1 Mergers, Acquisitions & Divestments
- 6.5.2 New U.S. Ultraviolet Disinfection Equipment Launches
- 6.5.3 Facility Expansions
- 6.5.4 Strategic Alliances, Joint Ventures & Partnerships
- 6.5.5 Distribution Expansion & Market Entry
- 6.5.6 Sustainability & ESG Initiatives
- 6.6 Competitive Strategy Mapping
- 6.6.1 Leader, Challenger, Follower & Niche Classification
- 6.6.2 Pricing Strategy Comparison
- 6.6.3 Channel Strategy Matrix
Note: Strategic developments are included based on their materiality and the availability of reliable information.
Chapter 7. Global U.S. Ultraviolet Disinfection Equipment Market – By Distribution Channel
- 7.1 Segment Overview
- 7.1.1 Volume & Revenue Split by Channel (2024 & 2032)
- 7.1.2 Channel Mix Evolution (2024-2032)
Chapter 8. Regional Market Analysis – Global Overview
- 8.1 Global Regional Overview
- 8.1.1 Regional Volume Share
- 8.1.2 Regional Revenue Share
- 8.1.3 Regional Volume by Region
- 8.1.4 Regional Revenue by Region
- 8.1.5 Regional Forecast Through 2032
- 8.2 Cross-Regional Segment Analysis
- 8.2.1 By Distribution Channel
- 8.2.2 By Brand/Price Tier
Chapter 9. North America U.S. Ultraviolet Disinfection Equipment Market
- 9.1 United States
- 9.2 Canada
- 9.3 Mexico
Chapter 10. Europe U.S. Ultraviolet Disinfection Equipment Market
- 10.1 Germany
- 10.2 France
- 10.3 Italy
- 10.4 United Kingdom
- 10.5 Spain
- 10.6 Poland
- 10.7 Russia
- 10.8 Netherlands
- 10.9 Belgium
- 10.10 Sweden
- 10.11 Denmark
- 10.12 Norway
- 10.13 Rest of Europe
Chapter 11. Asia Pacific U.S. Ultraviolet Disinfection Equipment Market
- 11.1 China
- 11.2 India
- 11.3 Japan
- 11.4 South Korea
- 11.5 Thailand
- 11.6 Indonesia
- 11.7 Vietnam
- 11.8 Malaysia
- 11.9 Australia
- 11.10 Rest of Asia Pacific
Chapter 12. Latin America U.S. Ultraviolet Disinfection Equipment Market
- 12.1 Brazil
- 12.2 Argentina
- 12.3 Colombia
- 12.4 Chile
- 12.5 Rest of Latin America
Chapter 13. Middle East U.S. Ultraviolet Disinfection Equipment Market
- 13.1 Saudi Arabia
- 13.2 United Arab Emirates
- 13.3 Turkey
- 13.4 Israel
- 13.5 Iran
- 13.6 Rest of the Middle East
Chapter 14. Africa U.S. Ultraviolet Disinfection Equipment Market
- 14.1 South Africa
- 14.2 Egypt
- 14.3 Nigeria
- 14.4 Morocco
- 14.5 Rest of Africa
Chapter 15. U.S. Ultraviolet Disinfection Equipment Company Profiles
- 15.1 [Company 01]
- 15.1.1 Company Overview
- 15.1.2 Key Management Personnel
- 15.1.3 Products & Services Portfolio
- 15.1.4 Financial Performance
- 15.1.5 Key Market Focus & Geographic Presence
- 15.1.6 Recent Developments & Strategic Initiatives
Note: The company profile list is preliminary and may change based on research findings, market developments, data availability, and client requirements.
Chapter 16. Appendices
- Appendix A – List of Abbreviations & Acronyms
- Appendix B – Industry Classification Code Reference – Full Series
- Appendix C – Production & Capacity Data Tables
- Appendix D – End-Use & Demand Base Tables
- Appendix E – Consumption & Replacement Rate Assumptions
- Appendix F – ASP Reference Tables
- Appendix G – Manufacturing & Facility Database
- Appendix H – Import-Export Data Tables
- Appendix I – Regulatory Summary Tables
- Appendix J – Primary Research Participant List (Anonymized)
- Appendix K – Primary Research Questionnaire Framework
- Appendix L – Data Sources & Bibliography
- Appendix M – Market Size Divergence & Source Comparison
Chapter 17. Research Methodology
- 17.1 Research Framework & Philosophy
- 17.2 Secondary Research – Sources, Hierarchy & Data Extraction
- 17.3 Data Modeling – Bottom-Up & Top-Down Market Sizing
- 17.4 Primary Research – Stakeholder Framework, LOI & Sample Sizes
- 17.5 Forecast Methodology – Regression, Scenario & Sensitivity Analysis
- 17.6 Quality Control – Four-Layer Validation Framework
- 17.7 Limitations & Standard Assumptions
- 17.8 Disclaimer
