
API Contract Manufacturing Market Overview:
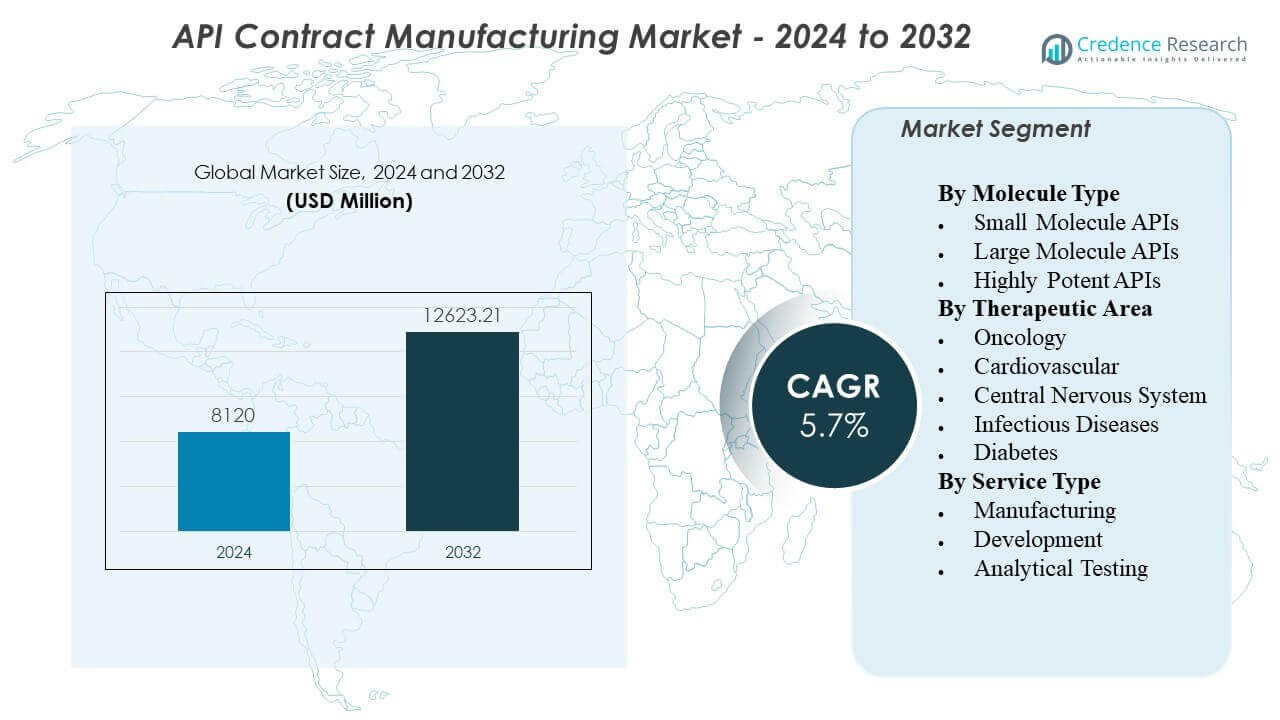
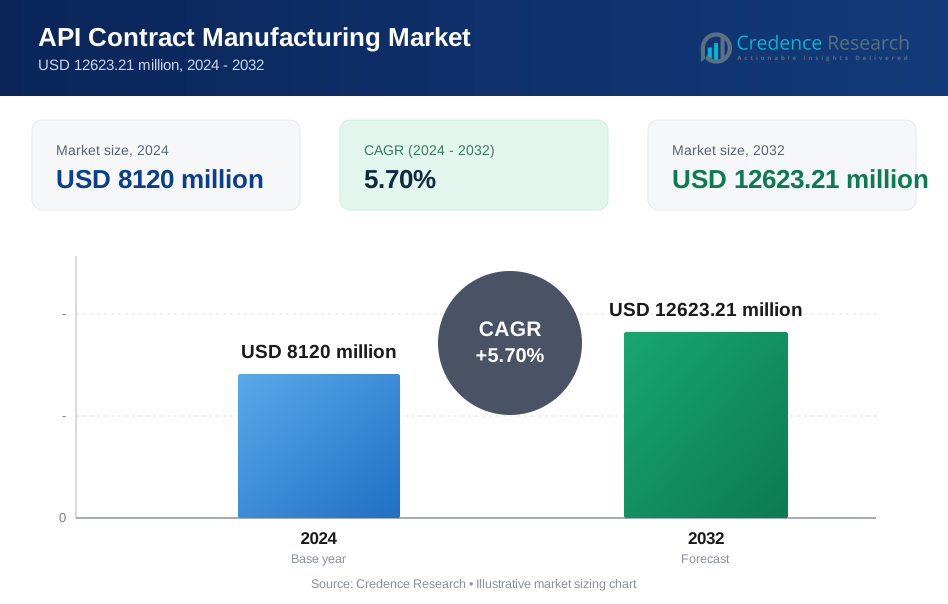
The API Contract Manufacturing Market is projected to grow from USD 8120 million in 2024 to an estimated USD 12623.21 million by 2032, with a compound annual growth rate (CAGR) of 5.70% from 2024 to 2032.
| REPORT ATTRIBUTE | DETAILS |
|---|---|
| Historical Period | 2020-2023 |
| Base Year | 2024 |
| Forecast Period | 2025-2032 |
| API Contract Manufacturing Market Size 2024 | USD 8120 million |
| API Contract Manufacturing Market, CAGR | 5.70% |
| API Contract Manufacturing Market Size 2032 | USD 12623.21 million |
Outsourced API production grows as drug makers aim to cut fixed costs and speed up launches. Sponsors rely on partners with GMP facilities, validated processes, and scalable capacity. Rising demand for high-potency APIs, controlled substances, and complex chemistries lifts the need for specialized containment and safety systems. More small and virtual pharma firms choose asset-light models and prefer external supply networks. Contract manufacturers also support lifecycle needs such as route optimization, yield improvement, and impurity control. Stable supply assurance and dual sourcing plans further push long-term manufacturing agreements.
North America leads due to strong innovator activity, high clinical trial volume, and strict quality expectations that favor experienced contract partners. Europe stays important because of mature regulatory systems, high-value patented drugs, and deep expertise in complex synthesis. Asia Pacific emerges as the fastest growth engine, led by India and China with large-scale capacity and competitive cost structures. Japan and South Korea add demand for high-quality, niche, and high-potency production. Southeast Asia gains traction as companies diversify supply chains beyond single-country reliance. Regional expansion follows the need for resilience, faster delivery, and closer-to-market manufacturing.
API Contract Manufacturing Market Insights:
- Asia-Pacific leads with 35% share, North America follows with 29%, and Europe holds 20% due to strong manufacturing bases, mature compliance, and large sponsor demand.
- Latin America is the fastest-growing region with 9% share, driven by supplier diversification, expanding pharma output, and rising regional outsourcing activity.
- Segment mix skews toward chemically synthesized APIs, where Organic holds 61% share, Inorganic holds 27%, and Others account for 12%.
- End-user split shows Pharmaceutical Industries at 66%, Research Organization at 15%, and Others at 19%, which signals demand strength from commercial supply programs.
API Contract Manufacturing Market Drivers:
Rising Outsourcing Demand To Reduce Fixed Costs And Improve Speed To Market
Pharma firms reduce capital spend by outsourcing API production. The Api Contract Manufacturing Market benefits from this shift in operating models. Sponsors avoid new plant buildouts and redirect funds to R&D. Contract partners deliver batch readiness faster than new in-house lines. CMOs offer trained teams, qualified utilities, and audited quality systems. Sponsors also gain flexibility to scale volumes by product stage. Faster tech transfer supports quicker clinical progression and launch plans. This driver stays strong across both branded and generic portfolios.
- For instance, Thermo Fisher Scientific (Patheon) utilized its "Quick to Care" program to reduce the timeline from API synthesis to clinical drug product supply to as little as 14 weeks, a significant reduction compared to the industry standard of 6 to 9 months.
Stricter Regulatory Expectations Push Sponsors Toward Proven Quality Systems
Regulators expect strong data integrity and validated controls. Sponsors prefer CMOs with mature GMP compliance and audit history. Quality by design practices reduce variability and support stable supply. Robust impurity control strengthens acceptance for regulated markets. Partners invest in validation, cleaning verification, and electronic documentation. Sponsors use these capabilities to reduce compliance risk across sites. Reliable batch release timelines support downstream formulation schedules. This driver grows with global inspection intensity and tighter reporting rules.
Complex Molecules And High Potency APIs Increase Need For Specialist Capabilities
More pipelines include potent and complex small molecules. These programs require containment, occupational safety, and precise analytical methods. CMOs expand HPAPI suites with segregated airflow and closed handling. Expert process chemistry improves yields and reduces byproducts. Advanced analytics support impurity profiling and stability studies. Sponsors choose partners who can manage multi-step synthesis and tight specs. Scale-up know-how reduces delays between lab and commercial batches. This driver rises with oncology and specialty drug growth.
- For instance, Piramal Pharma Solutions states its high-potency suites can handle compounds with OEL < 1 µg/m³ at kilo-lab scale, with capability as low as 10 ng/m³, plus reactor volumes up to 50 L and handling capacity up to 2 kg.
Supply Chain Resilience Needs Encourage Dual Sourcing And Regional Redundancy
Sponsors prioritize continuity after recent supply disruptions. Dual sourcing reduces dependence on a single plant or region. CMOs support network strategies with multiple qualified sites. Inventory buffers and reliable raw material access improve service levels. Strong vendor qualification protects against variable inputs. Sponsors also seek shorter lead times for critical intermediates. Better resilience supports long-term supply agreements and volume commitments. This driver remains central for essential medicines and chronic therapies.
API Contract Manufacturing Market Trends:
Shift Toward Integrated End To End Services From Route Design To Commercial Supply
Sponsors prefer fewer handoffs across the value chain. CMOs expand from API output into development support and tech transfer. One partner can cover route selection, scale-up, and validation. This trend improves coordination across chemistry, analytics, and quality teams. Faster issue resolution reduces cycle time and batch deviation risk. Sponsors gain clearer accountability across milestones and deliverables. The Api Contract Manufacturing Market reflects stronger demand for full-service partnerships. Integrated offerings also support lifecycle optimization and cost control.
- For instance, Lonza announced a CDMO restructuring into three platforms Integrated Biologics, Advanced Synthesis, and Specialized Modalities to align services across the development-to-commercial span.
Greater Use Of Digital Quality Systems And Real Time Process Data For Control
CMOs adopt digital batch records and electronic quality workflows. Real time data improves process visibility and faster deviation response. Predictive maintenance lowers downtime risk for critical equipment. Data integrity controls reduce manual errors and audit gaps. Advanced dashboards support right-first-time batch execution. Sponsors value transparent reporting and faster document turnaround. Digital tools also support remote audits and supplier oversight. This trend accelerates with broader pharma digital roadmaps.
Growing Preference For Long Term Strategic Partnerships Over Short Term Spot Contracts
Sponsors seek stability in capacity and supply planning. Multi-year deals secure slots for clinical and commercial demand. CMOs respond with dedicated lines and priority scheduling models. Joint governance improves communication and change control. Shared KPIs align quality, delivery, and cost targets. Sponsors also co-invest in equipment for specific chemistries. The Api Contract Manufacturing Market sees more partnership-based sourcing decisions. This trend supports stronger revenue visibility for leading CMOs.
- For instance, Novo Holdings agreed to acquire Catalent for $16.5 billion, and Novo Nordisk planned to buy three Catalent fill-finish sites for $11 billion, which shows how large buyers lock in long-term capacity through structured transactions.
Expansion Of Multi Site Manufacturing Networks To Serve Regional Markets Faster
CMOs build or acquire sites across key regions. Network footprints reduce shipping time and customs complexity. Regional presence supports local language support and regulator engagement. Sponsors value nearby production for sensitive or time-critical APIs. Multi-site strategies also reduce geopolitical and logistics exposure. Standardized processes enable smoother site-to-site transfers. This trend supports faster scale-up when demand shifts by market. Network expansion remains active in Europe, Asia, and North America.
API Contract Manufacturing Market Challenges Analysis:
Regulatory Scrutiny And Compliance Burden Create High Cost And Execution Risk
Inspections can trigger delays when systems fall short. CMOs must maintain strong documentation and data integrity. Small gaps can lead to warning letters and lost contracts. Validation and change control require deep expertise and discipline. Sponsors demand frequent audits and rapid corrective action plans. Talent shortages in quality roles increase operational stress. The Api Contract Manufacturing Market faces pressure to meet diverse regional rules. Compliance costs rise while price expectations stay tight.
Raw Material Volatility And Capacity Constraints Can Disrupt Timelines And Margins
Key starting materials face price swings and supply limits. Single-source inputs can halt production when shortages occur. Long lead times complicate project planning for multi-step synthesis. Capacity bottlenecks appear during peak demand and campaign overlaps. CMOs must balance many clients with different priority needs. Freight variability affects delivery reliability and cost. Sponsors push for firm dates, even under uncertain inputs. Margin control becomes harder when inputs shift quickly.
API Contract Manufacturing Market Opportunities:
Rising Demand For Specialty And High Potency APIs Opens Premium Service Segments
More oncology and rare disease drugs use potent compounds. CMOs can win projects with advanced containment and analytics. Sponsors pay for proven safety systems and consistent quality. Rapid scale-up capability supports faster clinical timelines. Strong impurity control helps approvals in strict markets. This opportunity favors firms with differentiated process chemistry. The Api Contract Manufacturing Market can expand through these premium programs. Capacity additions in HPAPI suites can lift long-term contracts.
Localized And Diversified Manufacturing Strategies Create New Regional Growth Paths
Sponsors diversify supply beyond single-country dependence. CMOs can add regional capacity to support near-market supply. Local sites reduce logistics risk and shorten lead times. Partnerships with regional suppliers improve raw material access. Government support for domestic pharma also drives new projects. Faster regulatory engagement improves market entry for critical drugs. This opportunity supports M&A and greenfield investments in key hubs. Contract wins grow when CMOs offer multi-region redundancy.
API Contract Manufacturing Market Segmentation Analysis:
By Molecule Type
Small Molecule APIs lead demand due to broad use across chronic and acute therapies and strong generic volumes. Large Molecule APIs grow faster as biologics expand and sponsors seek specialized fermentation, purification, and robust quality controls. Highly Potent APIs gain share with oncology pipelines and specialty drugs that require high-containment suites, strict OEL compliance, and advanced impurity control.
By Therapeutic Area
Oncology drives premium outsourcing because complex, potent compounds need strict safety and tight specifications. Cardiovascular programs sustain steady volumes and favor cost-efficient, high-throughput production. Central Nervous System APIs rely on consistent quality and supply continuity due to long treatment cycles. Infectious Diseases demand rises with antimicrobial stewardship needs and episodic outbreak response. Diabetes supports large-scale, predictable demand, which favors partners that can deliver stable output and reliable lead times.
- For instance, Lonza reported a payload-linker manufacturing suite that can handle compounds down to 1 ng/m³ OEL, with 1–50 L reactor sizes and a −80°C to +150°C temperature range, which fits stringent oncology payload requirements.
By Service Type
Manufacturing remains the core revenue stream as sponsors outsource batch production, scale-up, and commercial supply. Development services expand as clients require route selection, process optimization, and tech transfer support to reduce cycle time. Analytical Testing grows in importance because regulators expect robust method validation, impurity profiling, and stability data.
- For instance, NNIT reported that Lonza’s Batch Release Dashboard reduced batch release time by 90% and cut daily batch release management tasks from 30 hours to 30 minutes, which shows how digital workflows can tighten QA execution and release readiness.
Segmentation:
By Molecule Type
- Small Molecule APIs
- Large Molecule APIs
- Highly Potent APIs
By Therapeutic Area
- Oncology
- Cardiovascular
- Central Nervous System
- Infectious Diseases
- Diabetes
By Service Type
- Manufacturing
- Development
- Analytical Testing
By Regions
- North America
- U.S.
- Canada
- Mexico
- Europe
- Germany
- France
- U.K.
- Italy
- Spain
- Rest of Europe
- Asia Pacific
- China
- Japan
- India
- South Korea
- South-east Asia
- Rest of Asia Pacific
- Latin America
- Brazil
- Argentina
- Rest of Latin America
- Middle East & Africa
- GCC Countries
- South Africa
- Rest of the Middle East and Africa
Regional Analysis:
Asia-Pacific Leads With Large Scale Capacity And Export Driven Supply
Asia-Pacific holds a 35% market share and leads global activity. The Api Contract Manufacturing Market gains strength here due to cost-efficient production and deep process chemistry talent. India and China anchor volume output for generics and many specialty APIs. Japan and South Korea support high-quality and niche API demand with strong compliance focus. Sponsors use the region for both commercial supply and rapid scale-up needs. Government support for pharma manufacturing also supports capacity expansion. Large supplier bases for intermediates improve procurement flexibility.
North America Holds A Strong Share Through Innovation And Strict Quality Expectations
North America accounts for 29% of the global market share. The United States drives demand due to high R&D activity and strong clinical pipelines. Sponsors seek partners with proven GMP systems and reliable audit records. A mature ecosystem supports complex projects, including potent and specialty APIs. Quality expectations favor established CMOs with strong analytical depth. Supply chain resilience programs also support more local and dual-source strategies. This region benefits from close sponsor access and faster coordination.
Europe Remains A Key Hub While Latin America And MEA Expand From A Smaller Base
Europe holds a 20% market share and benefits from strong regulatory frameworks and advanced manufacturing standards. Germany and Switzerland remain important locations for high-quality API production and innovation-led programs. Latin America captures 9% share and grows through expanding pharma demand and nearshore supply options. Brazil and Mexico support regional scale and contract production needs. The Middle East & Africa holds 7% share and grows with healthcare investment and local manufacturing initiatives. Regional diversification strategies help these markets attract new projects over time.
Key Player Analysis:
- Lonza Group AG
- Catalent Inc.
- Boehringer Ingelheim
- Teva Pharmaceutical Industries
- Sun Pharmaceutical Industries
- Piramal Pharma Solutions
- AbbVie Inc.
Competitive Analysis:
The Api Contract Manufacturing Market shows strong competition between global CDMOs and integrated pharma firms with captive capacity. Large players win contracts through multi-site networks, proven GMP track records, and deep process chemistry skills. Top firms invest in high-potency containment, advanced analytics, and scalable reactors to support complex pipelines. Contract terms increasingly favor long partnerships, which raises the value of reliable delivery and audit readiness. Price pressure persists in commoditized small-molecule work, so suppliers compete on yield, cycle time, and quality metrics. New entrants face high barriers due to validation cost, talent needs, and customer qualification timelines. It rewards suppliers that combine technical depth with resilient sourcing and fast tech transfer.
Recent Developments:
- In February 2026, Lonza Group AG strengthened its Advanced Synthesis portfolio by fully integrating its Antibody-Drug Conjugate (ADC) technology platform, which includes proprietary GlycoConnect and toxSYN linker-payloads acquired from Synaffix. This update follows a landmark 2025 where the company achieved 21.7% sales growth, largely driven by the acquisition of one of the world's largest biologics sites in Vacaville, California, which secured its fifth major commercial contract in early 2026.
- In January 2026, Teva reaffirmed its intent to divest its active pharmaceutical ingredient (Teva api) business, initiating a renewed sales process after exclusive discussions with a previous buyer terminated. While the API unit remains a "held for sale" asset, Teva successfully launched the first-ever generic GLP-1 (liraglutide) in the U.S. in late 2025, leveraging its internal manufacturing expertise to capture the high-growth weight loss market.
- In December 2025, Sun Pharma announced a ₹3,000 crore ($360 million) investment to build a new greenfield formulations plant in Madhya Pradesh, India, to bolster its domestic and global supply chain. Throughout 2025, the company aggressively expanded its Contract Research and Manufacturing Services (CRAMS), positioning itself as a primary partner for global innovators in Novel Chemical Entities (NCEs).
Report Coverage:
The research report offers an in-depth analysis based on Molecule Type, Therapeutic Area, Service Type, and Region. It details leading market players, providing an overview of their business, product offerings, investments, revenue streams, and key applications. Additionally, the report includes insights into the competitive environment, SWOT analysis, current market trends, as well as the primary drivers and constraints. Furthermore, it discusses various factors that have driven market expansion in recent years. The report also explores market dynamics, regulatory scenarios, and technological advancements that are shaping the industry. It assesses the impact of external factors and global economic changes on market growth. Lastly, it provides strategic recommendations for new entrants and established companies to navigate the complexities of the market.
Future Outlook:
- CDMOs expand high-containment capacity for potent APIs, especially for oncology pipelines that require strict operator safety and low cross-contamination risk.
- Sponsors increase dual sourcing and multi-site qualification to protect supply continuity, reduce single-region exposure, and meet long-term contract commitments.
- More clients choose integrated partners that can handle route selection, scale-up, validation, and commercial supply under one quality system and one governance model.
- Analytical testing gains strategic value as regulators demand stronger impurity control, method validation, stability data, and faster response during audits and investigations.
- Digital quality tools, electronic batch records, and real-time process monitoring improve deviation control, shorten release cycles, and strengthen data integrity expectations.
- Capacity planning shifts toward flexible campaign production that can switch between products faster, support smaller clinical lots, and still meet commercial volumes.
- Process optimization becomes a key lever as sponsors push for higher yields, lower solvent use, and tighter cost targets without compromising specification control.
- Regional footprints grow to support near-market supply, reduce logistics risk, and improve coordination with customers and local regulatory bodies.
- Bioconjugate and payload-linker work expands, which lifts demand for specialist chemistry, segregation, and highly sensitive analytical characterization.
- Talent development becomes critical as firms compete for experienced chemists, QA leaders, and validation experts to sustain quality performance at scale.
Request a Free Sample
Fill in your details and we'll send you a free sample report.
- Sample data tables & charts
- Research methodology
Need a Custom Version of This Report?
Tailor the scope, geography, or segments to your exact requirements.
- Custom geography or segment scope
- Direct access to our analyst team
Frequently Asked Questions
What is the current market size for Api Contract Manufacturing Market, and what is its projected size in 2032?
At what Compound Annual Growth Rate is the Api Contract Manufacturing Market projected to grow between 2025 and 2032?
Which Api Contract Manufacturing Market segment held the largest share in 2024?
What are the primary factors fueling the growth of the Api Contract Manufacturing Market?
Who are the leading companies in the Api Contract Manufacturing Market?
Table of Content
Chapter 1. Report Introduction
- 1.1 Report Description & Purpose
- 1.1.1 Report Title & Market Definition
- 1.1.2 Unique Selling Propositions (USP) & Key Differentiators
- 1.1.3 Value Proposition for Stakeholders
- 1.2 Research Objectives
- 1.2.1 Market Sizing Objectives (Volume & Revenue)
- 1.2.2 Segmentation Objectives
- 1.2.3 Competitive Intelligence Objectives
- 1.2.4 Forecast & Scenario Objectives
- 1.3 Report Scope
- 1.3.1 API Contract Manufacturing Scope – Types & Subtypes Covered
- 1.3.2 Geographic Scope – Regions & Countries Covered
- 1.3.3 Historical Period, Base Year & Forecast Period (2024; forecast to 2032)
- 1.3.4 Inclusions & Exclusions
- 1.4 HS Code & Classification Framework
- 1.5 Currency, Units & Pricing Basis
- 1.6 Target Stakeholders
- 1.7 Limitations & Assumptions
Chapter 2. Executive Summary
- 2.1 Global API Contract Manufacturing Market Snapshot
- 2.1.1 Market Size – Historical (2024) & Forecast (2024-2032) (2024: USD 8120 million → 2032: USD 12623.21 million)
- 2.1.2 Volume & Revenue – Global Totals
- 2.1.3 Key Market Highlights – Top Five Facts
- 2.2 API Contract Manufacturing Market Segmentation Snapshot
- 2.2.1 Market Split by Region – 2024 vs. 2032
- 2.3 Competitive Snapshot
- 2.3.1 Top 10 Players by Revenue Share – 2024
- 2.3.2 Top 10 Players by Volume Share – 2024
- 2.3.3 Recent Strategic Developments (18-Month Summary)
- 2.4 Key Investment Highlights & Strategic Conclusions
Chapter 3. API Contract Manufacturing Market Dynamics & Industry Analysis
- 3.1 Market Overview & Context
- 3.1.1 API Contract Manufacturing Market Position in the Broader Automotive Value Chain
- 3.1.2 OEM vs. Replacement Market Dynamics
- 3.1.3 Market Maturity & Development Stage by Region
- 3.2 API Contract Manufacturing Market Drivers
- 3.3 API Contract Manufacturing Market Restraints & Challenges
- 3.4 API Contract Manufacturing Market Opportunities
- 3.5 Porter's Five Forces Analysis
- 3.5.1 Threat of New Entrants
- 3.5.2 Bargaining Power of Suppliers
- 3.5.3 Bargaining Power of Buyers
- 3.5.4 Threat of Substitutes
- 3.5.5 Competitive Rivalry – Intensity Assessment
- 3.6 API Contract Manufacturing Value Chain Analysis
- 3.6.1 Upstream – Raw Material/Input Suppliers
- 3.6.1.1 Raw Material/Input 1
- 3.6.1.2 Raw Material/Input 2
- 3.6.1.3 Raw Material/Input 3
- 3.6.2 Midstream – Production/Manufacturing/Service Delivery
- 3.6.2.1 Production/Process Overview
- 3.6.2.2 Key Facility Locations & Capacity by Manufacturer
- 3.6.3 Downstream – Distribution & End Consumer
- 3.6.3.1 Primary Channel – B2B/OEM
- 3.6.3.2 Secondary Channels – Dealer, Retail, Online, Direct
- 3.6.4 Value Chain Profitability Analysis
- 3.6.1 Upstream – Raw Material/Input Suppliers
- 3.7 PESTEL Analysis
- 3.7.1 Political Factors
- 3.7.2 Economic Factors
- 3.7.3 Social Factors
- 3.7.4 Technological Factors
- 3.7.5 Environmental Factors
- 3.7.6 Legal Factors
- 3.8 API Contract Manufacturing Supply Chain Analysis
- 3.8.1 Raw Material/Input Supply Risk Assessment
- 3.8.2 Manufacturing Concentration Risk (Geographic Exposure)
- 3.8.3 Trade Disruption Impact Analysis
- 3.9 Regulatory & Policy Landscape
Note: The regulatory and policy landscape section covers regulations based on their applicability to the market, API Contract Manufacturing category, geography, and scope of the study. Only regulatory frameworks with a material impact on operations, compliance, trade, sustainability, or market access are analyzed in detail.
Chapter 4. Key Investment Pockets & Opportunity Analysis
- 4.1 API Contract Manufacturing Market Attractiveness Analysis
- 4.1.1 By Region – Investment Attractiveness Matrix (Volume × CAGR)
- 4.2 Absolute Revenue Growth Opportunity
- 4.2.1 By Region – Absolute USD Growth Through 2032
- 4.3 Incremental Volume Opportunity
- 4.3.1 By Region – Incremental Volume Through 2032
- 4.3.2 Segment – Incremental Volume
- 4.4 Emerging Submarket Opportunity Deep Dive (Subject to Applicability)
- 4.5 Emerging Market Opportunity Scorecards
- 4.5.1 United States
- 4.5.2 Europe
- 4.5.3 Asia
- 4.5.4 Middle East & Africa
Note: Emerging Market Opportunity Scorecards will be included based on relevance and strategic importance. Regions listed are indicative and may vary depending on data availability and market dynamics.
Chapter 5. API Contract Manufacturing Import-Export Analysis & Trade Flows
- 5.1 Global Trade Overview
- 5.1.1 Global Export Value by Country (2024)
- 5.1.2 Global Export Volume by Country (2024)
- 5.1.3 Global Import Value by Country (2024)
- 5.1.4 Global Import Volume by Country (2024)
- 5.1.5 Net Trade Balance by Country (2024)
- 5.2 Export Analysis – Segment
- 5.2.1 Type 1 (HS Code)
- 5.2.2 Type 2 (HS Code)
- 5.2.3 Type 3 (HS Code)
- 5.2.4 Type 4 (HS Code)
- 5.2.5 Type 5 (HS Code)
- 5.3 Import Analysis – Segment
- 5.3.1 Type 1 (HS Code)
- 5.3.2 Type 2 (HS Code)
- 5.3.3 Type 3 (HS Code)
- 5.3.4 Type 4 (HS Code)
- 5.3.5 Type 5 (HS Code)
- 5.4 Average Unit Trade Prices
- 5.4.1 Average Export Price – Segment & Country
- 5.4.2 Average Import Price – Segment & Source Country
- 5.4.3 Price Trends (2024)
- 5.5 Key Trade Route Analysis
- 5.5.1 Trade Route 1
- 5.5.2 Trade Route 2
- 5.5.3 Trade Route 3
- 5.5.4 Trade Route 4
- 5.5.5 Trade Route 5
- 5.6 Trade Policy Impact Assessment
- 5.6.1 US Anti-Dumping & Section 301 Tariffs
- 5.6.2 EU Customs Union Impact
- 5.6.3 Major Free Trade Agreements
- 5.6.4 USMCA Rules of Origin
Note: Trade policy analysis will be included only where relevant to the API Contract Manufacturing market.
Chapter 6. Competitive Landscape & Company Benchmarking
- 6.1 API Contract Manufacturing Market Concentration & Structure
- 6.1.1 Herfindahl-Hirschman Index (HHI) – vs. 2024
- 6.1.2 Tier 1, Tier 2 & Tier 3 Market Structure
- 6.1.3 Global, Regional & Local Player Dynamics
- 6.2 API Contract Manufacturing Market Share Analysis – 2024
- 6.2.1 Global Revenue Share by Company
- 6.2.2 Global Volume Share by Company
- 6.2.3 Regional Revenue Share
- 6.2.4 Market Share Evolution ( vs. 2024)
- 6.2.5 OEM Segment Share by Company
- 6.2.6 Replacement Segment Share by Company
- 6.3 Production/Delivery Capacity & Facility Analysis
- 6.3.1 Global Installed Capacity
- 6.3.2 Capacity Utilization Rates
- 6.3.3 Production/Output Volume
- 6.3.4 Facility Locations & Capacity Map
- 6.3.5 Planned Capacity Additions
- 6.4 API Contract Manufacturing Competitive Benchmarking Matrix
- 6.4.1 Revenue, Volume, CAGR & Profitability Comparison
- 6.4.2 Channel Revenue Mix
- 6.4.3 Geographic Revenue Exposure
- 6.4.4 R&D Intensity
- 6.4.5 Sustainability Maturity
- 6.5 Strategic Developments in API Contract Manufacturing (Last 24 Months)
- 6.5.1 Mergers, Acquisitions & Divestments
- 6.5.2 New API Contract Manufacturing Launches
- 6.5.3 Facility Expansions
- 6.5.4 Strategic Alliances, Joint Ventures & Partnerships
- 6.5.5 Distribution Expansion & Market Entry
- 6.5.6 Sustainability & ESG Initiatives
- 6.6 Competitive Strategy Mapping
- 6.6.1 Leader, Challenger, Follower & Niche Classification
- 6.6.2 Pricing Strategy Comparison
- 6.6.3 Channel Strategy Matrix
Note: Strategic developments are included based on their materiality and the availability of reliable information.
Chapter 7. Global API Contract Manufacturing Market – By Distribution Channel
- 7.1 Segment Overview
- 7.1.1 Volume & Revenue Split by Channel (2024 & 2032)
- 7.1.2 Channel Mix Evolution (2024-2032)
Chapter 8. Regional Market Analysis – Global Overview
- 8.1 Global Regional Overview
- 8.1.1 Regional Volume Share
- 8.1.2 Regional Revenue Share
- 8.1.3 Regional Volume by Region
- 8.1.4 Regional Revenue by Region
- 8.1.5 Regional Forecast Through 2032
- 8.2 Cross-Regional Segment Analysis
- 8.2.1 By Distribution Channel
- 8.2.2 By Brand/Price Tier
Chapter 9. North America API Contract Manufacturing Market
- 9.1 United States
- 9.2 Canada
- 9.3 Mexico
Chapter 10. Europe API Contract Manufacturing Market
- 10.1 Germany
- 10.2 France
- 10.3 Italy
- 10.4 United Kingdom
- 10.5 Spain
- 10.6 Poland
- 10.7 Russia
- 10.8 Netherlands
- 10.9 Belgium
- 10.10 Sweden
- 10.11 Denmark
- 10.12 Norway
- 10.13 Rest of Europe
Chapter 11. Asia Pacific API Contract Manufacturing Market
- 11.1 China
- 11.2 India
- 11.3 Japan
- 11.4 South Korea
- 11.5 Thailand
- 11.6 Indonesia
- 11.7 Vietnam
- 11.8 Malaysia
- 11.9 Australia
- 11.10 Rest of Asia Pacific
Chapter 12. Latin America API Contract Manufacturing Market
- 12.1 Brazil
- 12.2 Argentina
- 12.3 Colombia
- 12.4 Chile
- 12.5 Rest of Latin America
Chapter 13. Middle East API Contract Manufacturing Market
- 13.1 Saudi Arabia
- 13.2 United Arab Emirates
- 13.3 Turkey
- 13.4 Israel
- 13.5 Iran
- 13.6 Rest of the Middle East
Chapter 14. Africa API Contract Manufacturing Market
- 14.1 South Africa
- 14.2 Egypt
- 14.3 Nigeria
- 14.4 Morocco
- 14.5 Rest of Africa
Chapter 15. API Contract Manufacturing Company Profiles
- 15.1 [Company 01]
- 15.1.1 Company Overview
- 15.1.2 Key Management Personnel
- 15.1.3 Products & Services Portfolio
- 15.1.4 Financial Performance
- 15.1.5 Key Market Focus & Geographic Presence
- 15.1.6 Recent Developments & Strategic Initiatives
Note: The company profile list is preliminary and may change based on research findings, market developments, data availability, and client requirements.
Chapter 16. Appendices
- Appendix A – List of Abbreviations & Acronyms
- Appendix B – Industry Classification Code Reference – Full Series
- Appendix C – Production & Capacity Data Tables
- Appendix D – End-Use & Demand Base Tables
- Appendix E – Consumption & Replacement Rate Assumptions
- Appendix F – ASP Reference Tables
- Appendix G – Manufacturing & Facility Database
- Appendix H – Import-Export Data Tables
- Appendix I – Regulatory Summary Tables
- Appendix J – Primary Research Participant List (Anonymized)
- Appendix K – Primary Research Questionnaire Framework
- Appendix L – Data Sources & Bibliography
- Appendix M – Market Size Divergence & Source Comparison
Chapter 17. Research Methodology
- 17.1 Research Framework & Philosophy
- 17.2 Secondary Research – Sources, Hierarchy & Data Extraction
- 17.3 Data Modeling – Bottom-Up & Top-Down Market Sizing
- 17.4 Primary Research – Stakeholder Framework, LOI & Sample Sizes
- 17.5 Forecast Methodology – Regression, Scenario & Sensitivity Analysis
- 17.6 Quality Control – Four-Layer Validation Framework
- 17.7 Limitations & Standard Assumptions
- 17.8 Disclaimer
