
Aquaculture Vaccine Market Overview:
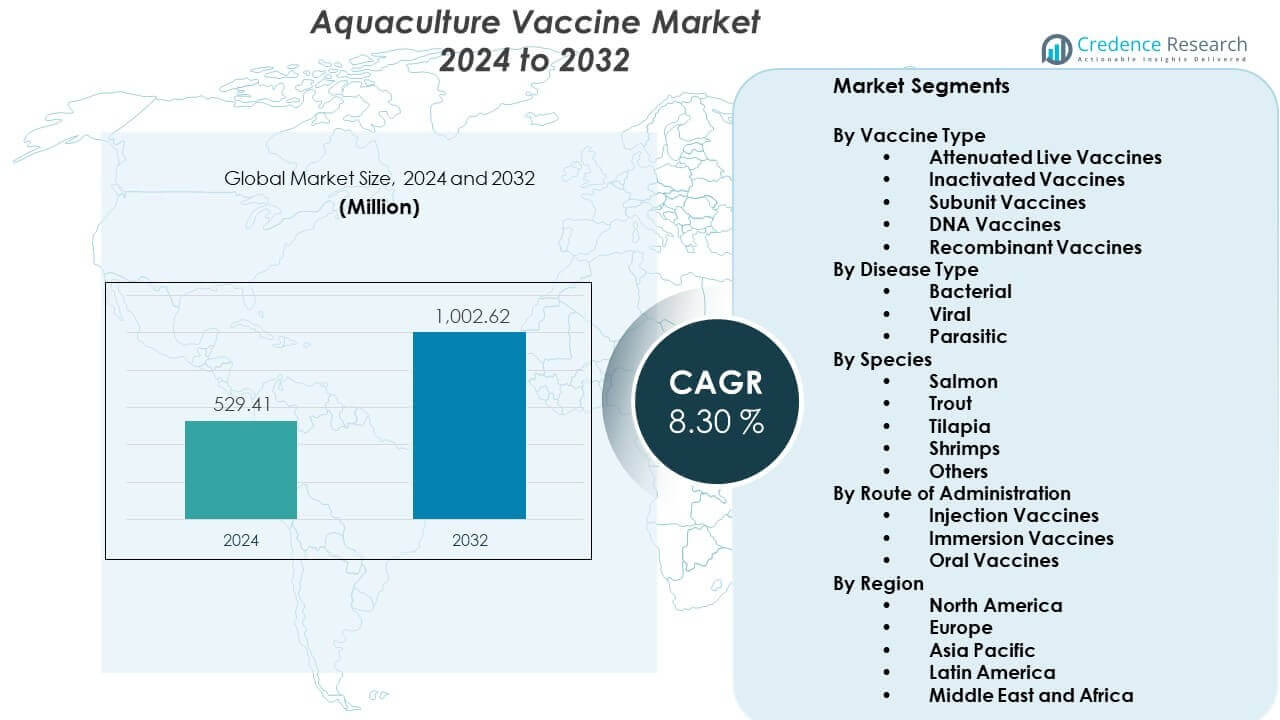
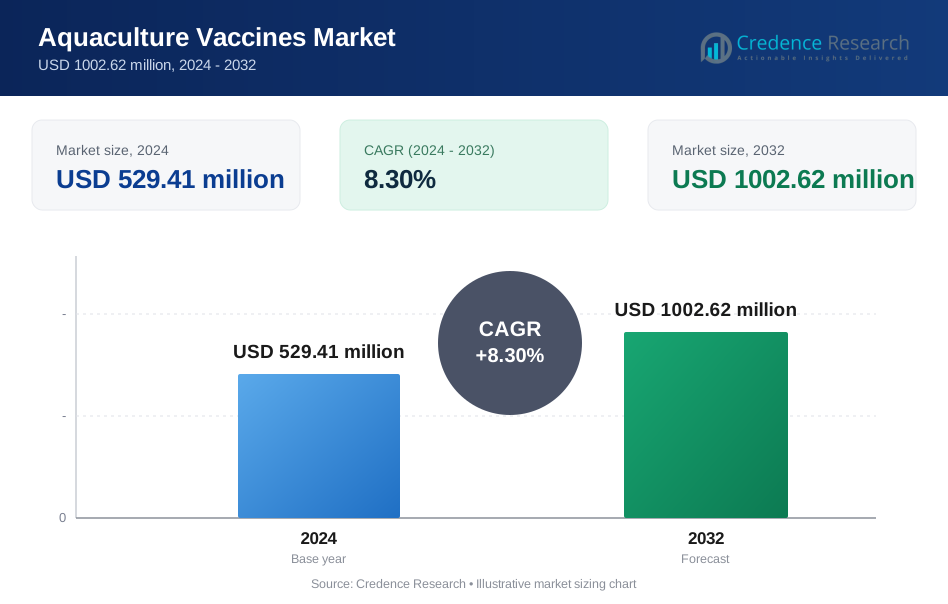
The Aquaculture Vaccine Market is projected to grow from USD 529.41 million in 2024 to an estimated USD 1002.62 million by 2032, with a CAGR of 8.30% from 2024 to 2032.
| REPORT ATTRIBUTE | DETAILS |
|---|---|
| Historical Period | 2020-2023 |
| Base Year | 2024 |
| Forecast Period | 2025-2032 |
| Aquaculture Vaccine Market Size 2024 | USD 529.41 million |
| Aquaculture Vaccine Market, CAGR | 8.30% |
| Aquaculture Vaccine Market Size 2032 | USD 1002.62 million |
The market grows due to higher fish farming intensity, frequent disease outbreaks, and the shift toward sustainable aquaculture practices. Manufacturers develop targeted vaccines for diverse species, while regulatory bodies support safer biological products. Expanding aquaculture in both freshwater and marine systems accelerates adoption as farmers seek reliable protection to reduce antibiotic dependence, improve yield consistency, and meet export standards.
Regional growth varies across major aquaculture hubs. Asia Pacific leads due to its vast aquaculture output and strong vaccine uptake in countries with large fish farms. Europe follows because producers rely on advanced immunization programs and strict health standards. North America grows steadily with rising investments in salmon farming. Emerging markets in Latin America and Africa expand adoption as local aquaculture operations scale and focus on reducing disease-related economic losses.
Aquaculture Vaccine Market Insights:
- Asia Pacific leads with 45% share due to large-scale fish and shrimp farming, followed by Europe at 25% driven by strict health standards, and North America at 18% supported by strong salmon production.
- Latin America, with 7% share, is the fastest-growing region due to rapid expansion in salmon and tilapia aquaculture and rising investments in fish health infrastructure.
- Bacterial vaccines held the largest share at around 40%, supported by high incidence of bacterial infections in major farmed species.
- Salmon species accounted for over 35% of total demand, driven by intensive farming practices and structured vaccination programs across leading production regions.
Aquaculture Vaccine Market Drivers:
Rising Disease Pressure Across Expanding Aquaculture Systems
The Aquaculture Vaccine Market grows due to higher disease incidence across intensive farming systems. Farmers adopt preventive tools to reduce mortality in fish and shrimp populations. Frequent outbreaks push producers to rely on reliable immunization strategies. The industry sees strong demand for vaccines that protect high-value species. Research groups focus on pathogens that create recurring losses for farms. The shift toward structured health programs strengthens vaccine uptake across regions. Regulatory bodies support safer biological solutions that help farmers reduce antibiotic dependence. Producers respond by upgrading vaccine portfolios that match evolving disease patterns.
Increased Shift Toward Sustainable and Antibiotic-Free Aquaculture Practices
Global aquaculture moves toward cleaner production practices that limit drug residues in seafood. The shift encourages greater adoption of vaccination programs across farming clusters. It aligns with stricter export rules that prioritize safer and healthier food choices. Market participants develop products that support responsible farming. Retail chains also promote antibiotic-free seafood labels. This support improves demand for tools that prevent bacterial and viral infections. Countries introduce guidelines that encourage controlled health management plans. The Aquaculture Vaccine Market benefits from rising preference for preventive solutions over treatment-based approaches.
- For instance, HIPRA reported 97.6% RPS for its ICTHIOVAC® VR/PD group against a virulent heterologous Vibrio anguillarum strain under European Pharmacopoeia criteria.
Growing Investments in Aquatic Animal Health Research and Vaccine Innovation
Higher investment flows fuel growth in specialized aquatic health laboratories. Researchers build next-generation vaccines tailored for species-specific pathogens. New formulations improve immune response and simplify farm deployment. Companies also design vaccines that support mass-scale immunization. DNA-based options attract attention due to flexible development timelines. This trend helps producers respond quickly to emerging diseases. Partnerships between academics and industry expand the innovation pipeline. These efforts create strong momentum for the Aquaculture Vaccine Market.
Expansion of Commercial Aquaculture Production and Integration of Health Management Solutions
Large farming enterprises scale production to meet rising seafood demand. Expanded output requires stronger disease control frameworks. Firms integrate vaccination schedules into routine farm management. Digital tools support tracking of doses and species-level health data. Hatcheries adopt vaccines that protect young stock from early infections. Governments encourage structured health programs to improve survival rates. Traders also demand consistent supply quality from producers. This need for predictable yields strengthens adoption within the Aquaculture Vaccine Market.
- For instance, MSD Animal Health notes that AquaVac ERM has seen use since 1983, with over 1 billion rainbow trout vaccinated, and cites immersion vaccination at 5 grams to protect trout for at least six months.
Aquaculture Vaccine Market Trends:
Growing Use of Advanced Delivery Technologies for Efficient Fish Immunization
Producers explore new vaccine delivery formats that improve ease of use. Automated systems help vaccinate large populations with minimal stress. Oral formulations gain attention due to simple feeding integration. Companies refine immersion techniques for small or fragile species. These methods reduce handling time during high-volume operations. Digital tools help track vaccination accuracy across farms. Technology partners design equipment that improves dose consistency. These advancements shape future expectations in the Aquaculture Vaccine Market.
- For instance, Maskon reports its fully automated vaccination machine can vaccinate and sort up to 40,000 smolts per hour with a single operator, and the unit can deliver up to four different vaccines in one process.
Rising Adoption of Multivalent Vaccines for Broad Pathogen Protection
Multivalent vaccines attract interest due to their ability to target multiple pathogens. Farmers prefer options that lower labor demands during health programs. These solutions help reduce total vaccination cycles across large farms. Developers refine combinations that maintain strong immune response. New blends protect species across diverse environmental conditions. Producers value reduced downtime during disease prevention tasks. Hatcheries also integrate multivalent products into stocking programs. This trend improves operational efficiency within the Aquaculture Vaccine Market.
Expansion of Genomic and Molecular Tools for Tailored Vaccine Development
Genomic mapping accelerates identification of high-risk pathogens in aquaculture. Molecular tools help researchers design targeted vaccine candidates. Precision development enables better immune response in species with unique traits. Labs gain faster insights into emerging disease variants. Companies adopt discovery platforms that shorten development timelines. Regional research centers customize vaccines for local farming needs. These tools increase industry focus on personalized aquatic health solutions. This shift boosts innovation in the Aquaculture Vaccine Market.
- For instance, MSD Animal Health states AQUAVAC® IridoV shows onset of immunity 10 days after vaccination at 27°C, with a duration of immunity at least 15 weeks after a single injection dose.
Increasing Industry Collaboration to Strengthen Vaccine Access and Distribution Networks
Manufacturers collaborate with feed mills and hatcheries to widen vaccine access. Joint programs help farms receive training on health management practices. Shared distribution networks improve supply reach in remote farming zones. Partnerships support streamlined packaging and cold-chain solutions. Integrated service models reduce operational complexity for producers. Firms also coordinate to forecast vaccine demand with greater accuracy. Regional alliances help adapt products to local environmental challenges. These collective efforts strengthen commercial pathways in the Aquaculture Vaccine Market.
Aquaculture Vaccine Market Challenges Analysis:
High Production Costs, Technical Barriers, and Slow Adoption Across Small-Scale Farms
Small farms face high costs when shifting to structured vaccination programs. Many producers lack access to trained specialists who manage immunization. Technical limits hinder deployment across complex aquatic systems. Some farms operate with low margins that restrict investment in preventive tools. Cold-chain requirements create barriers for remote regions. Variability in water conditions affects vaccine performance at farm level. This mix slows transition to modern health practices. Financial stress among smaller players impacts growth for the Aquaculture Vaccine Market.
Regulatory Complexity, Limited Standardization, and Rising Threat of Emerging Pathogens
Regulatory pathways differ across major aquaculture nations. Companies face lengthy approval cycles for new vaccines. Limited harmonization across markets raises cost and compliance burden. Emerging pathogens evolve quickly and strain existing formulations. Disease surveillance remains weak in many coastal and inland regions. Farms often struggle to detect early signs of infection. Slow reporting limits rapid response planning. These hurdles challenge developers operating in the Aquaculture Vaccine Market.
Aquaculture Vaccine Market Opportunities:
Rising Farm Intensification and Strong Demand for Scalable Immunization Solutions
Growing aquaculture output pushes producers toward advanced health programs. Intensified stocking practices create an urgent need for structured prevention tools. Scalable vaccines offer strong opportunity for companies targeting expanding farms. Digital tracking platforms enhance adoption across commercial operations. New entrants explore regional gaps in supply and service support. Farmers show higher willingness to invest in preventive tools. This shift strengthens long-term prospects for the Aquaculture Vaccine Market.
Expansion of Species Coverage, Regional Customization, and Emerging Market Entry Potential
Producers seek vaccines tailored for more species across freshwater and marine systems. Regional customization improves immune performance and field acceptance. Growth in developing aquaculture regions offers space for market penetration. Local partnerships help streamline regulatory progress. Hatchery expansion increases early-stage immunization demand. Strong focus on export-grade production lifts interest in effective disease control. These factors open new commercial pathways for companies within the Aquaculture Vaccine Market.
Aquaculture Vaccine Market Segmentation Analysis:
By Vaccine Type
The Aquaculture Vaccine Market expands across multiple vaccine formats that support diverse farming needs. Attenuated live vaccines offer strong immune response for fast-growing species. Inactivated vaccines remain preferred where safety and stability matter. Subunit vaccines help producers target specific pathogens with higher precision. DNA vaccines gain traction due to rapid development timelines. Recombinant vaccines draw interest from farms seeking broader protection. Each format contributes to rising adoption across commercial operations.
- For instance, Elanco’s CLYNAV label states each 0.05 mL dose contains 6.0–9.4 μg of DNA plasmid, with onset of immunity within 399 degree days after vaccination.
By Disease Type
Disease segmentation reflects strong demand for solutions that control bacterial, viral, and parasitic threats. Bacterial vaccines hold a dominant role due to frequent outbreaks that impact major species. Viral vaccines support farms facing rapid pathogen spread. Parasitic vaccines show slow but steady uptake where infestation cycles disrupt production. This structure creates steady need for improved immunization tools across farming zones.
By Species
Species-level demand centers on salmon, trout, tilapia, shrimps, and other cultured varieties. Salmon and trout farms adopt advanced vaccines due to high commercial value. Tilapia producers seek cost-effective tools for scaling operations. Shrimp hatcheries adopt selective products where disease pressure remains high. Other species follow gradual uptake as farming expands into new regions.
- For instance, CLYNAV documentation confirms the vaccine targets Atlantic salmon and specifies a 0.05 mL dose with defined DNA content to support consistent immunization control at scale.
By Route of Administration
Vaccine delivery varies across injection, immersion, and oral methods. Injection vaccines remain widely used for large fish with established handling systems. Immersion vaccines support early-stage stocking. Oral vaccines draw attention for ease of use in high-volume operations. This mix strengthens adaptability across different farm environments.
Segmentation:
By Vaccine Type
- Attenuated Live Vaccines
- Inactivated Vaccines
- Subunit Vaccines
- DNA Vaccines
- Recombinant Vaccines
By Disease Type
- Bacterial
- Viral
- Parasitic
By Species
- Salmon
- Trout
- Tilapia
- Shrimps
- Others
By Route of Administration
- Injection Vaccines
- Immersion Vaccines
- Oral Vaccines
By Region
- North America
- U.S.
- Canada
- Mexico
- Europe
- Germany
- France
- U.K.
- Italy
- Spain
- Rest of Europe
- Asia Pacific
- China
- Japan
- India
- South Korea
- South-east Asia
- Rest of Asia Pacific
- Latin America
- Brazil
- Argentina
- Rest of Latin America
- Middle East & Africa
- GCC Countries
- South Africa
- Rest of the Middle East and Africa
Regional Analysis:
Asia Pacific
The Asia Pacific region holds the largest share of the Aquaculture Vaccine Market with nearly 45% of global revenue. Strong aquaculture production in China, India, Vietnam, and Indonesia drives high vaccine consumption. Farmers in these countries adopt preventive health programs to reduce losses from bacterial and viral diseases. Governments promote regulated farming practices to support export growth. Local manufacturers expand vaccine availability across coastal and inland sectors. International companies increase partnerships to meet rising regional demand. The market benefits from rapid expansion of commercial fish and shrimp farming.
Europe
Europe accounts for roughly 25% of the global market, driven by advanced aquaculture systems and strict animal health regulations. The Aquaculture Vaccine Market in this region benefits from strong adoption among salmon producers in Norway, Scotland, and Iceland. Companies invest in premium vaccines that support high-value salmonid species. Research centers in the region develop specialized solutions for emerging pathogens. Producers rely on structured immunization programs to protect yield quality. Sustainability rules encourage reduced antibiotic usage across farms. This strengthens reliance on high-performance vaccines within large aquaculture clusters.
North America, Latin America, and Middle East & Africa
North America holds nearly 18% share, supported by expanding salmon farming in Canada and the United States. The region adopts modern immunization tools to maintain disease-free production. Latin America captures close to 7%, led by Chile’s salmon industry and growing tilapia farming across Brazil. The Aquaculture Vaccine Market in these areas gains momentum through investments in fish health infrastructure. Middle East & Africa represent around 5%, driven by emerging aquaculture projects in Gulf nations and North African countries. Limited vaccine access slows adoption, yet rising farm intensification creates new openings. Regional diversification strengthens long-term growth potential for vaccine suppliers.
Key Player Analysis:
- Zoetis
- Merck & Co., Inc. (MSD Animal Health)
- Phibro Animal Health
- Hipra
- Elanco
- Virbac
- Benchmark
- KBNP
- CAVAC
- Vaxxinova International
Competitive Analysis:
The Aquaculture Vaccine Market features strong competition driven by innovation, regulatory compliance, and expansion into emerging aquaculture regions. Leading companies focus on advanced formulations that improve immune response and streamline farm-level vaccination. Firms invest in disease-targeted research to strengthen product portfolios and protect high-value species. Strategic alliances help enhance distribution efficiency across major aquaculture hubs. New entrants explore niche species and customized vaccines to differentiate offerings. It shows rising activity in technology-driven delivery methods that support scalable deployment. Competitive pressure increases as producers seek solutions that reduce antibiotic dependence. The landscape reflects continuous investment in aquatic health science.
Recent Developments:
- In February 2026, both KBNP and CAVAC were cited as dominant regional players driving the expansion of the Asia-Pacific aquaculture vaccine market. These companies are currently focusing on developing vaccines for endemic viral diseases like Viral Nervous Necrosis (VNN), which causes significant economic losses in the finfish sectors of South Korea and China.
- In January 2026, Virbac reaffirmed its position as a major competitor in the aquaculture vaccine space, particularly in the warmwater species segment. The company is currently leveraging its R&D capabilities to develop more accessible oral vaccine formulations to reduce the stress associated with manual injection in high-density farming environments.
- In December 2025, Vaxxinova was highlighted as a leading provider of autogenous (custom) vaccines, which are tailored to the specific pathogen strains found on individual fish farms. The company is expanding its regional production hubs to provide faster diagnostic-to-vaccine turnaround times for tilapia and shrimp producers in emerging markets.
Report Coverage:
The research report offers an in-depth analysis based on Vaccine Type, Disease Type, Species, and Route of Administration. It details leading market players, providing an overview of their business, product offerings, investments, revenue streams, and key applications. Additionally, the report includes insights into the competitive environment, SWOT analysis, current market trends, as well as the primary drivers and constraints. Furthermore, it discusses various factors that have driven market expansion in recent years. The report also explores market dynamics, regulatory scenarios, and technological advancements that are shaping the industry. It assesses the impact of external factors and global economic changes on market growth. Lastly, it provides strategic recommendations for new entrants and established companies to navigate the complexities of the market.
Future Outlook:
- Demand for preventive health solutions will rise as aquaculture operations scale and producers seek stable output across diverse species and environments.
- Adoption of recombinant, DNA-based, and next-generation vaccine platforms will accelerate as companies pursue enhanced immunity and faster development cycles.
- Growth in oral and immersion vaccination methods will strengthen due to their practicality, reduced labor needs, and suitability for high-volume commercial farming systems.
- Use of multivalent vaccines will expand as farms aim to reduce handling stress, streamline health programs, and protect against multiple pathogens in a single dose.
- Asia Pacific will continue to shape innovation priorities, driven by its dominant production volume and rapid shift toward structured aquatic health management.
- Strategic partnerships between vaccine manufacturers, hatcheries, and research bodies will intensify to support early-stage immunization and improve survival rates.
- Regulatory agencies will push for reduced antibiotic usage, creating stronger reliance on preventive vaccination frameworks and improved disease surveillance programs.
- Digital health monitoring tools will integrate with vaccination programs, allowing producers to track immune performance, environmental risks, and disease indicators in real time.
- Industry expansion will extend into new species, with vaccines targeting region-specific pathogens to support diversification of global aquaculture portfolios.
- Emerging regions in Africa and Latin America will offer promising long-term growth opportunities due to rising investment in aquaculture infrastructure and health management capacity.
Request a Free Sample
Fill in your details and we'll send you a free sample report.
- Sample data tables & charts
- Research methodology
Need a Custom Version of This Report?
Tailor the scope, geography, or segments to your exact requirements.
- Custom geography or segment scope
- Direct access to our analyst team
Frequently Asked Questions
What is the current market size for the Aquaculture Vaccines market, and what is its projected size in 2032?
At what Compound Annual Growth Rate is the Aquaculture Vaccine Market projected to grow between 2025 and 2032?
Which Aquaculture Vaccine Market segment held the largest share in 2024?
What are the primary factors fueling the growth of the Aquaculture Vaccine Market?
Who are the leading companies in the Aquaculture Vaccine Market?
Which region commanded the largest share of the Aquaculture Vaccine Market in 2024?
Table of Content
Chapter 1. Report Introduction
- 1.1 Report Description & Purpose
- 1.1.1 Report Title & Market Definition
- 1.1.2 Unique Selling Propositions (USP) & Key Differentiators
- 1.1.3 Value Proposition for Stakeholders
- 1.2 Research Objectives
- 1.2.1 Market Sizing Objectives (Volume & Revenue)
- 1.2.2 Segmentation Objectives
- 1.2.3 Competitive Intelligence Objectives
- 1.2.4 Forecast & Scenario Objectives
- 1.3 Report Scope
- 1.3.1 Aquaculture Vaccines Scope – Types & Subtypes Covered
- 1.3.2 Geographic Scope – Regions & Countries Covered
- 1.3.3 Historical Period, Base Year & Forecast Period (2024; forecast to 2032)
- 1.3.4 Inclusions & Exclusions
- 1.4 HS Code & Classification Framework
- 1.5 Currency, Units & Pricing Basis
- 1.6 Target Stakeholders
- 1.7 Limitations & Assumptions
Chapter 2. Executive Summary
- 2.1 Global Aquaculture Vaccines Market Snapshot
- 2.1.1 Market Size – Historical (2024) & Forecast (2024-2032) (2024: USD 529.41 million → 2032: USD 1002.62 million)
- 2.1.2 Volume & Revenue – Global Totals
- 2.1.3 Key Market Highlights – Top Five Facts
- 2.2 Aquaculture Vaccines Market Segmentation Snapshot
- 2.2.1 Market Split by Region – 2024 vs. 2032
- 2.3 Competitive Snapshot
- 2.3.1 Top 10 Players by Revenue Share – 2024
- 2.3.2 Top 10 Players by Volume Share – 2024
- 2.3.3 Recent Strategic Developments (18-Month Summary)
- 2.4 Key Investment Highlights & Strategic Conclusions
Chapter 3. Aquaculture Vaccines Market Dynamics & Industry Analysis
- 3.1 Market Overview & Context
- 3.1.1 Aquaculture Vaccines Market Position in the Broader Automotive Value Chain
- 3.1.2 OEM vs. Replacement Market Dynamics
- 3.1.3 Market Maturity & Development Stage by Region
- 3.2 Aquaculture Vaccines Market Drivers
- 3.3 Aquaculture Vaccines Market Restraints & Challenges
- 3.4 Aquaculture Vaccines Market Opportunities
- 3.5 Porter's Five Forces Analysis
- 3.5.1 Threat of New Entrants
- 3.5.2 Bargaining Power of Suppliers
- 3.5.3 Bargaining Power of Buyers
- 3.5.4 Threat of Substitutes
- 3.5.5 Competitive Rivalry – Intensity Assessment
- 3.6 Aquaculture Vaccines Value Chain Analysis
- 3.6.1 Upstream – Raw Material/Input Suppliers
- 3.6.1.1 Raw Material/Input 1
- 3.6.1.2 Raw Material/Input 2
- 3.6.1.3 Raw Material/Input 3
- 3.6.2 Midstream – Production/Manufacturing/Service Delivery
- 3.6.2.1 Production/Process Overview
- 3.6.2.2 Key Facility Locations & Capacity by Manufacturer
- 3.6.3 Downstream – Distribution & End Consumer
- 3.6.3.1 Primary Channel – B2B/OEM
- 3.6.3.2 Secondary Channels – Dealer, Retail, Online, Direct
- 3.6.4 Value Chain Profitability Analysis
- 3.6.1 Upstream – Raw Material/Input Suppliers
- 3.7 PESTEL Analysis
- 3.7.1 Political Factors
- 3.7.2 Economic Factors
- 3.7.3 Social Factors
- 3.7.4 Technological Factors
- 3.7.5 Environmental Factors
- 3.7.6 Legal Factors
- 3.8 Aquaculture Vaccines Supply Chain Analysis
- 3.8.1 Raw Material/Input Supply Risk Assessment
- 3.8.2 Manufacturing Concentration Risk (Geographic Exposure)
- 3.8.3 Trade Disruption Impact Analysis
- 3.9 Regulatory & Policy Landscape
Note: The regulatory and policy landscape section covers regulations based on their applicability to the market, Aquaculture Vaccines category, geography, and scope of the study. Only regulatory frameworks with a material impact on operations, compliance, trade, sustainability, or market access are analyzed in detail.
Chapter 4. Key Investment Pockets & Opportunity Analysis
- 4.1 Aquaculture Vaccines Market Attractiveness Analysis
- 4.1.1 By Region – Investment Attractiveness Matrix (Volume × CAGR)
- 4.2 Absolute Revenue Growth Opportunity
- 4.2.1 By Region – Absolute USD Growth Through 2032
- 4.3 Incremental Volume Opportunity
- 4.3.1 By Region – Incremental Volume Through 2032
- 4.3.2 Segment – Incremental Volume
- 4.4 Emerging Submarket Opportunity Deep Dive (Subject to Applicability)
- 4.5 Emerging Market Opportunity Scorecards
- 4.5.1 United States
- 4.5.2 Europe
- 4.5.3 Asia
- 4.5.4 Middle East & Africa
Note: Emerging Market Opportunity Scorecards will be included based on relevance and strategic importance. Regions listed are indicative and may vary depending on data availability and market dynamics.
Chapter 5. Aquaculture Vaccines Import-Export Analysis & Trade Flows
- 5.1 Global Trade Overview
- 5.1.1 Global Export Value by Country (2024)
- 5.1.2 Global Export Volume by Country (2024)
- 5.1.3 Global Import Value by Country (2024)
- 5.1.4 Global Import Volume by Country (2024)
- 5.1.5 Net Trade Balance by Country (2024)
- 5.2 Export Analysis – Segment
- 5.2.1 Type 1 (HS Code)
- 5.2.2 Type 2 (HS Code)
- 5.2.3 Type 3 (HS Code)
- 5.2.4 Type 4 (HS Code)
- 5.2.5 Type 5 (HS Code)
- 5.3 Import Analysis – Segment
- 5.3.1 Type 1 (HS Code)
- 5.3.2 Type 2 (HS Code)
- 5.3.3 Type 3 (HS Code)
- 5.3.4 Type 4 (HS Code)
- 5.3.5 Type 5 (HS Code)
- 5.4 Average Unit Trade Prices
- 5.4.1 Average Export Price – Segment & Country
- 5.4.2 Average Import Price – Segment & Source Country
- 5.4.3 Price Trends (2024)
- 5.5 Key Trade Route Analysis
- 5.5.1 Trade Route 1
- 5.5.2 Trade Route 2
- 5.5.3 Trade Route 3
- 5.5.4 Trade Route 4
- 5.5.5 Trade Route 5
- 5.6 Trade Policy Impact Assessment
- 5.6.1 US Anti-Dumping & Section 301 Tariffs
- 5.6.2 EU Customs Union Impact
- 5.6.3 Major Free Trade Agreements
- 5.6.4 USMCA Rules of Origin
Note: Trade policy analysis will be included only where relevant to the Aquaculture Vaccines market.
Chapter 6. Competitive Landscape & Company Benchmarking
- 6.1 Aquaculture Vaccines Market Concentration & Structure
- 6.1.1 Herfindahl-Hirschman Index (HHI) – vs. 2024
- 6.1.2 Tier 1, Tier 2 & Tier 3 Market Structure
- 6.1.3 Global, Regional & Local Player Dynamics
- 6.2 Aquaculture Vaccines Market Share Analysis – 2024
- 6.2.1 Global Revenue Share by Company
- 6.2.2 Global Volume Share by Company
- 6.2.3 Regional Revenue Share
- 6.2.4 Market Share Evolution ( vs. 2024)
- 6.2.5 OEM Segment Share by Company
- 6.2.6 Replacement Segment Share by Company
- 6.3 Production/Delivery Capacity & Facility Analysis
- 6.3.1 Global Installed Capacity
- 6.3.2 Capacity Utilization Rates
- 6.3.3 Production/Output Volume
- 6.3.4 Facility Locations & Capacity Map
- 6.3.5 Planned Capacity Additions
- 6.4 Aquaculture Vaccines Competitive Benchmarking Matrix
- 6.4.1 Revenue, Volume, CAGR & Profitability Comparison
- 6.4.2 Channel Revenue Mix
- 6.4.3 Geographic Revenue Exposure
- 6.4.4 R&D Intensity
- 6.4.5 Sustainability Maturity
- 6.5 Strategic Developments in Aquaculture Vaccines (Last 24 Months)
- 6.5.1 Mergers, Acquisitions & Divestments
- 6.5.2 New Aquaculture Vaccines Launches
- 6.5.3 Facility Expansions
- 6.5.4 Strategic Alliances, Joint Ventures & Partnerships
- 6.5.5 Distribution Expansion & Market Entry
- 6.5.6 Sustainability & ESG Initiatives
- 6.6 Competitive Strategy Mapping
- 6.6.1 Leader, Challenger, Follower & Niche Classification
- 6.6.2 Pricing Strategy Comparison
- 6.6.3 Channel Strategy Matrix
Note: Strategic developments are included based on their materiality and the availability of reliable information.
Chapter 7. Global Aquaculture Vaccines Market – By Distribution Channel
- 7.1 Segment Overview
- 7.1.1 Volume & Revenue Split by Channel (2024 & 2032)
- 7.1.2 Channel Mix Evolution (2024-2032)
Chapter 8. Regional Market Analysis – Global Overview
- 8.1 Global Regional Overview
- 8.1.1 Regional Volume Share
- 8.1.2 Regional Revenue Share
- 8.1.3 Regional Volume by Region
- 8.1.4 Regional Revenue by Region
- 8.1.5 Regional Forecast Through 2032
- 8.2 Cross-Regional Segment Analysis
- 8.2.1 By Distribution Channel
- 8.2.2 By Brand/Price Tier
Chapter 9. North America Aquaculture Vaccines Market
- 9.1 United States
- 9.2 Canada
- 9.3 Mexico
Chapter 10. Europe Aquaculture Vaccines Market
- 10.1 Germany
- 10.2 France
- 10.3 Italy
- 10.4 United Kingdom
- 10.5 Spain
- 10.6 Poland
- 10.7 Russia
- 10.8 Netherlands
- 10.9 Belgium
- 10.10 Sweden
- 10.11 Denmark
- 10.12 Norway
- 10.13 Rest of Europe
Chapter 11. Asia Pacific Aquaculture Vaccines Market
- 11.1 China
- 11.2 India
- 11.3 Japan
- 11.4 South Korea
- 11.5 Thailand
- 11.6 Indonesia
- 11.7 Vietnam
- 11.8 Malaysia
- 11.9 Australia
- 11.10 Rest of Asia Pacific
Chapter 12. Latin America Aquaculture Vaccines Market
- 12.1 Brazil
- 12.2 Argentina
- 12.3 Colombia
- 12.4 Chile
- 12.5 Rest of Latin America
Chapter 13. Middle East Aquaculture Vaccines Market
- 13.1 Saudi Arabia
- 13.2 United Arab Emirates
- 13.3 Turkey
- 13.4 Israel
- 13.5 Iran
- 13.6 Rest of the Middle East
Chapter 14. Africa Aquaculture Vaccines Market
- 14.1 South Africa
- 14.2 Egypt
- 14.3 Nigeria
- 14.4 Morocco
- 14.5 Rest of Africa
Chapter 15. Aquaculture Vaccines Company Profiles
- 15.1 [Company 01]
- 15.1.1 Company Overview
- 15.1.2 Key Management Personnel
- 15.1.3 Products & Services Portfolio
- 15.1.4 Financial Performance
- 15.1.5 Key Market Focus & Geographic Presence
- 15.1.6 Recent Developments & Strategic Initiatives
Note: The company profile list is preliminary and may change based on research findings, market developments, data availability, and client requirements.
Chapter 16. Appendices
- Appendix A – List of Abbreviations & Acronyms
- Appendix B – Industry Classification Code Reference – Full Series
- Appendix C – Production & Capacity Data Tables
- Appendix D – End-Use & Demand Base Tables
- Appendix E – Consumption & Replacement Rate Assumptions
- Appendix F – ASP Reference Tables
- Appendix G – Manufacturing & Facility Database
- Appendix H – Import-Export Data Tables
- Appendix I – Regulatory Summary Tables
- Appendix J – Primary Research Participant List (Anonymized)
- Appendix K – Primary Research Questionnaire Framework
- Appendix L – Data Sources & Bibliography
- Appendix M – Market Size Divergence & Source Comparison
Chapter 17. Research Methodology
- 17.1 Research Framework & Philosophy
- 17.2 Secondary Research – Sources, Hierarchy & Data Extraction
- 17.3 Data Modeling – Bottom-Up & Top-Down Market Sizing
- 17.4 Primary Research – Stakeholder Framework, LOI & Sample Sizes
- 17.5 Forecast Methodology – Regression, Scenario & Sensitivity Analysis
- 17.6 Quality Control – Four-Layer Validation Framework
- 17.7 Limitations & Standard Assumptions
- 17.8 Disclaimer
