Market Overview:
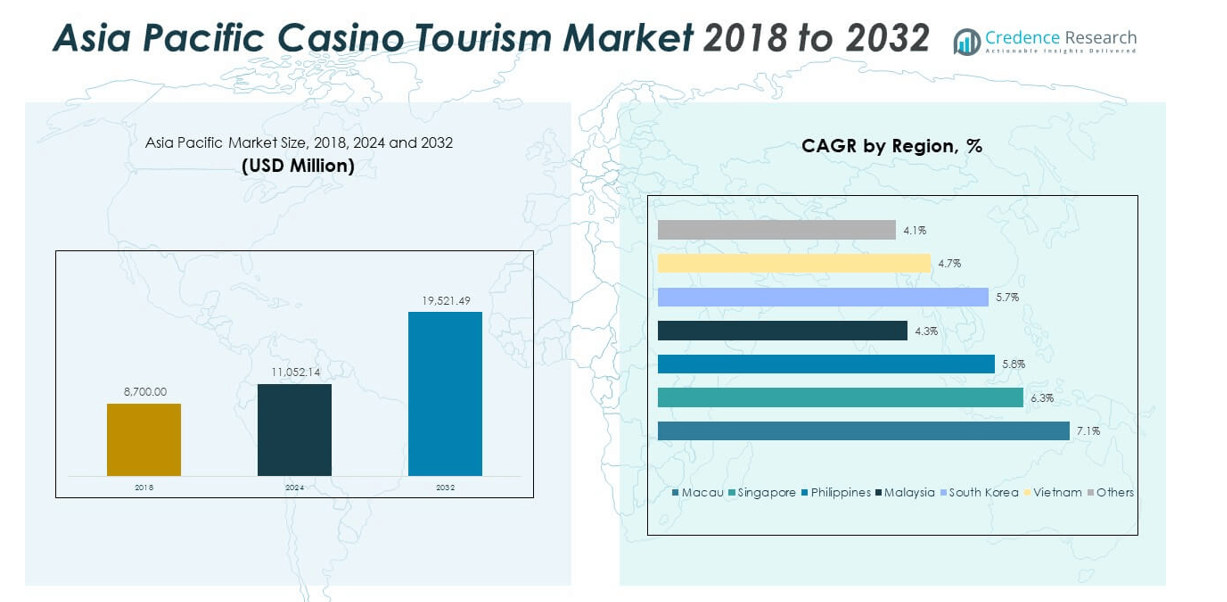
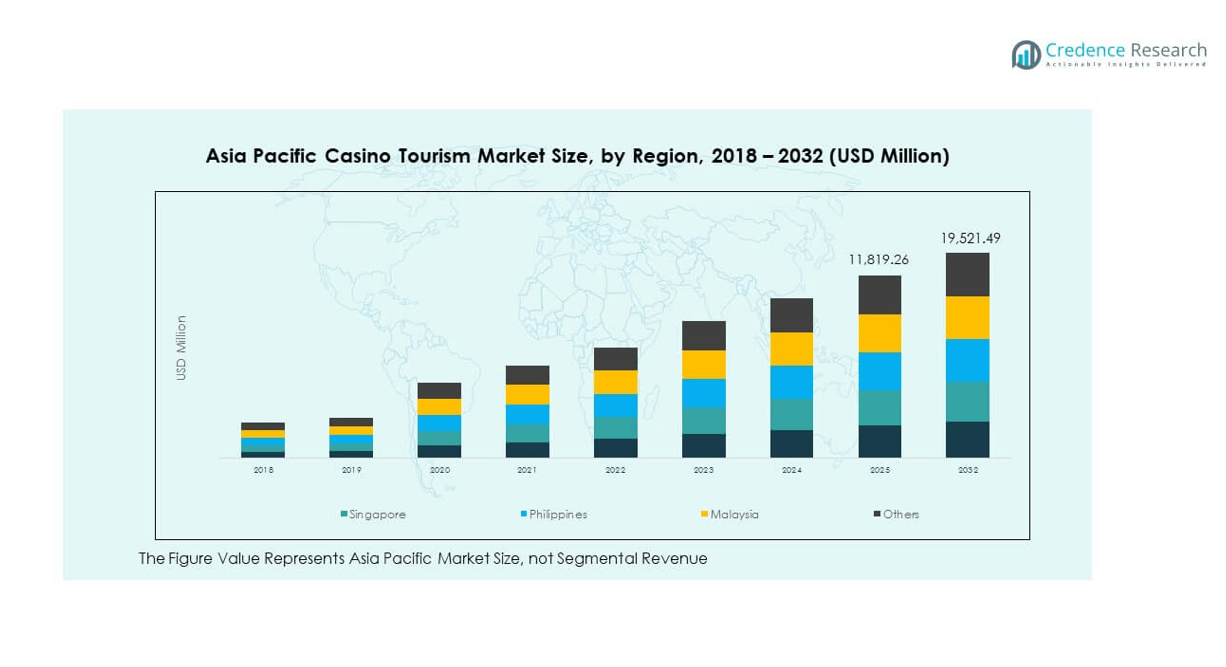
The Asia Pacific Casino Tourism Market size was valued at USD 8,700.00 million in 2018 to USD 11,052.14 million in 2024 and is anticipated to reach USD 19,521.49 million by 2032, at a CAGR of 7.43% during the forecast period.
| REPORT ATTRIBUTE |
DETAILS |
| Historical Period |
2020-2023 |
| Base Year |
2024 |
| Forecast Period |
2025-2032 |
| Asia Pacific Casino Tourism Market Size 2024 |
USD 11,052.14 million |
| Asia Pacific Casino Tourism Market, CAGR |
7.43% |
| Asia Pacific Casino Tourism Market Size 2032 |
USD 19,521.49 million |
Strong tourism spending, rising disposable income, and broad adoption of integrated resort models drive growth across major countries. Large casino clusters attract travelers who seek leisure, gaming, dining, and entertainment in one location. Governments support tourism-centric development to increase foreign arrivals and diversify revenue streams. Digital engagement tools simplify booking and improve visitor experience. Growing interest in theme-driven properties draws younger groups. Premium hospitality upgrades raise occupancy across peak seasons. These forces collectively push demand for casino-based travel.
East Asia remains the core hub due to established destinations and strong international arrivals. Macau leads due to mature infrastructure and high brand visibility. Singapore maintains steady traction with strict regulations and strong global connectivity. Japan shows rising interest as new integrated resort plans advance. Emerging opportunities appear in the Philippines and South Korea due to supportive policies and rising entertainment-focused tourism. Other Southeast Asian markets gain attention as operators expand portfolios to capture cross-border travelers seeking varied leisure experiences.
Market Insights:
- The Asia Pacific Casino Tourism Market grew from USD 8,700 million in 2018 to an estimated USD 11,052.14 million in 2024 and is projected to reach USD 19,521.49 million by 2032, expanding at a 43% CAGR, supported by rising tourism and integrated resort development.
- East Asia dominates with 55% share, driven by Macau, Singapore, and Japan’s tourism-led infrastructure; Southeast Asia follows with 30% share due to rapid resort expansion; Oceania and South Asia hold 15% share, supported by Australia’s strong domestic tourism.
- Southeast Asia stands out as the fastest-growing region with a 30% share, fueled by the Philippines’ large integrated resort clusters and Vietnam’s pro-tourism policies supporting casino-led travel growth.
- From the chart, Singapore contributes roughly 25% of the visual regional stack, reflecting strong international arrivals and premium casino tourism positioning.
- The Others category holds about 35%, making it the largest visible segment in the chart due to combined contributions from multiple emerging markets across the broader Asia Pacific.
Access crucial information at unmatched prices!
Request your sample report today & start making informed decisions powered by Credence Research Inc.!
Download Sample
Market Drivers:
Strong Expansion Of Integrated Resort Developments Across High-Traffic Tourism Corridors
The Asia Pacific Casino Tourism Market benefits from rapid expansion of integrated resorts that combine gaming, leisure, and hospitality. Developers invest in large complexes that draw domestic and international travelers. Governments support projects that strengthen tourism revenue and diversify economic streams. Travelers prefer multi-experience venues that merge casinos with retail, dining, and entertainment. Operators introduce premium suites and unique attractions to lift stay duration. Digital reservation platforms help streamline visitor movement across resort zones. Cross-border travelers search for resort clusters with distinct themes and strong service quality. Integrated assets secure high occupancy across holiday seasons and reinforce destination appeal.
- For instance, Marina Bay Sands in Singapore operates over 2,500 luxury rooms and attracts more than 45 million visitors annually, supported by a theatre seating 2,155 guests and a convention space spanning 1.3 million square feet.
Rising Demand Driven By Higher Disposable Income And Growing Travel Culture In Emerging Economies
Higher consumer spending supports steady growth in entertainment-focused travel. Young adults explore cross-border trips that include gaming zones and live events. Strong urban income growth fuels adoption of short leisure breaks. The Asia Pacific Casino Tourism Market gains stable traction from travelers seeking curated experiences. Operators introduce flexible packages that combine tours, dining, and casino access. Airlines expand low-cost routes that link major gaming hubs. Governments promote tourism corridors to support regional economic goals. The market aligns well with rising interest in premium lifestyle experiences.
- For instance, AirAsia operates thousands of weekly flights across Southeast Asia and connects major tourism destinations through routes that supported over 63 million annual passengersin 2024 across its regional network.
Continuous Government Support Toward Tourism-Led Infrastructure Development
Governments create favorable policies that promote long-term tourism expansion. Infrastructure upgrades strengthen airport capacity and improve direct access to gaming cities. Visa relaxation programs attract travelers from wider geographies. Strong focus on urban mobility ensures smooth movement across casino districts. The Asia Pacific Casino Tourism Market gains resilience from steady public investment. Authorities encourage responsible gaming frameworks to maintain social trust. Strategic tourism campaigns improve global visibility for leading destinations. Regulators support controlled licensing expansion to meet rising demand.
Increasing Adoption Of Digital Engagement And Smart Service Platforms Across Major Destinations
Digital transformation lifts customer engagement and strengthens visitor convenience. Operators adopt analytics tools to track preferences and tailor loyalty programs. Smart hotel systems improve check-in speed and room personalization. Gamified mobile platforms promote on-site activities and increase time spent at attractions. The Asia Pacific Casino Tourism Market aligns with rising digital participation across tourism groups. Cashless systems support faster transactions across casino floors. AI-powered concierge services guide travelers across resort zones. Digital marketing campaigns reach high-intent travelers across key regions.
Market Trends:
Growing Shift Toward Entertainment-Rich Casino Ecosystems Beyond Traditional Gaming Models
Destinations introduce large entertainment zones that combine concerts, festivals, and themed attractions. Travelers expect varied leisure choices within each resort. Operators design event calendars that target both domestic and international groups. The Asia Pacific Casino Tourism Market gains value from entertainment-led tourism growth. Family-friendly facilities widen visitor segments and lift seasonal occupancy. Branded dining zones enhance culinary appeal across resorts. Multi-sensory shows drive longer on-site engagement. These entertainment models strengthen the competitive positioning of major hubs.
- For instance, Galaxy Entertainment Group’s Galaxy Macau features over 120 dining outlets, multiple entertainment venues, and a 575,000-square-foot retail zone that supports over 20 million annual guest visits.
Rapid Integration Of Wellness, Lifestyle, And Premium Hospitality Experiences
Casino destinations add wellness zones, spas, and relaxation facilities to attract luxury-driven visitors. Travelers prioritize immersive experiences that balance recreation and comfort. Operators curate themed stays that include wellness programs and premium suites. The Asia Pacific Casino Tourism Market benefits from rising interest in lifestyle-focused tourism. Premium lounges and concierge services elevate visitor satisfaction. Lifestyle-driven upgrades help resorts differentiate their offerings. Curated shopping districts attract high-spending travelers. These trends support a strong shift toward holistic leisure environments.
- For instance, Wynn Macau operates a Forbes Five-Star spa recognized for premium wellness programs and hosts over 1,000 luxury rooms and suites that support strong demand from high-net-worth travelers.
Growing Influence Of Digital Marketing, Social Media Promotions, And Influencer-Led Travel Discovery
Travelers rely on digital channels to explore new casino destinations. Social media campaigns shape perception and create strong destination pull. Influencers highlight unique attractions that appeal to younger travelers. The Asia Pacific Casino Tourism Market gains visibility from real-time content sharing. Digital reviews influence booking choices across key routes. Online travel agencies amplify promotional reach for major hubs. Gamified promotions improve conversion across targeted groups. Destinations use immersive digital storytelling to elevate brand recall.
Increasing Emphasis On Sustainable Tourism, Green Building Designs, And Eco-Friendly Visitor Programs
Resorts adopt green construction materials and efficient energy systems. Travelers show higher awareness of responsible tourism practices. Destinations introduce waste reduction frameworks to meet environmental goals. The Asia Pacific Casino Tourism Market aligns with rising sustainability expectations. Operators integrate smart lighting and water systems to lower resource usage. Certifications support trust among global travelers. Eco-friendly programs help attract conscious visitors. Sustainability messaging strengthens long-term brand positioning.
Market Challenges Analysis:
Regulatory Constraints, Policy Uncertainty, And Licensing Restrictions Across Major Destinations
Regulatory complexity limits fast expansion across certain hubs. Governments enforce strict licensing rules that reduce project momentum. Operators must navigate compliance requirements across multiple jurisdictions. The Asia Pacific Casino Tourism Market faces delays when policies shift or new controls emerge. High due-diligence needs increase project cost and planning time. Tourism strategies change with political transitions, which creates uncertainty. Advertising controls limit promotional flexibility across regions. These challenges slow expansion despite rising demand.
Economic Fluctuations, Competitive Pressure, And Social Concerns Linked To Responsible Gaming
Regional economic swings reduce travel budgets and impact casino footfall. Strong competition from rising destinations challenges established hubs. Travelers compare offerings across countries before selecting a route. The Asia Pacific Casino Tourism Market adapts to concerns about social impact and responsible gaming. Operators invest in monitoring frameworks to meet compliance. Public scrutiny shapes policy dialogue in key cities. External shocks disrupt airline traffic and visitor flow. These constraints influence long-term stability for operators.
Market Opportunities:
Expansion Into Emerging Tourism Corridors Supported By New Integrated Resort Licenses
New markets open opportunities for long-term growth and diversified revenue streams. Policymakers in emerging countries consider controlled casino licensing to boost tourism. The Asia Pacific Casino Tourism Market gains room to expand into under-served travel corridors. Operators target cities that show rising preference for lifestyle and entertainment travel. Infrastructure upgrades help unlock new visitor clusters. Partnerships with local stakeholders improve early-stage entry. These openings support broader regional penetration.
High Potential For Premium Hospitality, Digital Experiences, And Theme-Driven Resort Differentiation
Destinations explore themed resorts that offer immersive attractions. Travelers search for premium hospitality and curated experiences. The Asia Pacific Casino Tourism Market aligns well with digital tools that enhance convenience. Smart platforms create deeper engagement with guests. Unique attractions improve competitive strength for new properties. Loyalty programs help retain returning visitors. These opportunities strengthen revenue growth across future cycles.
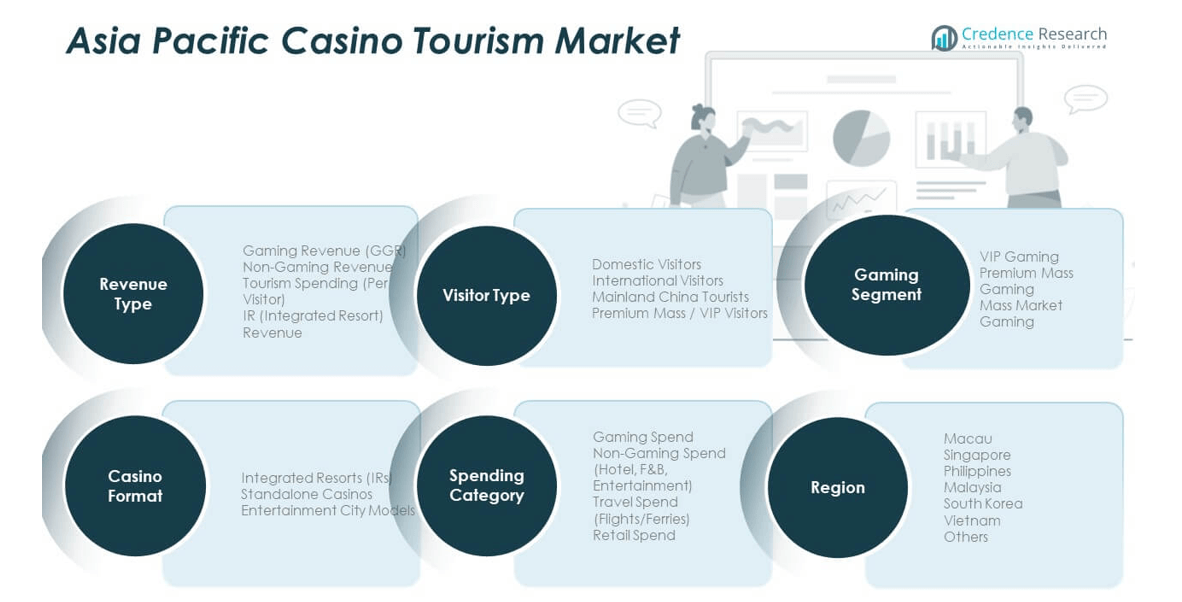
Market Segmentation Analysis:
By Game Type
The Asia Pacific Casino Tourism Market expands through strong participation across multiple game formats. 3 Card Poker and Blackjack attract players seeking skill-based experiences, while American Roulette maintains steady engagement among tourists who prefer chance-driven games. Casino Stud Poker appeals to visitors who want traditional table formats supported by structured gameplay. The others segment gains traction through regional variations and themed games that enhance visitor interest. Destinations invest in diverse gaming floors to meet the expectations of both seasoned players and casual tourists.
- For instance, IGT supplies over 40,000 electronic table gaming units globally, including Asia Pacific casinos that integrate multi-game formats into large gaming halls.
By Casino Type
Commercial casinos dominate due to large-scale integrated resorts that attract international travelers with premium entertainment. Tribal casinos show stable demand in countries where cultural tourism supports gaming activity. Limited stakes casinos appeal to price-sensitive visitors who prefer controlled budgets. I-gaming expands quickly through digital platforms that provide remote access and flexible gaming choices. The others segment includes niche formats that operate within smaller tourism clusters across regional markets.
- For instance, Entain’s digital gaming platforms serve active customers worldwide, with regulated Asia-Pacific markets adopting its online gaming and sports platforms supported by advanced risk-management systems.
By End-user
Gambling Enthusiasts drive frequent visitation through strong interest in high-engagement games and exclusive events. Social Exuberant visitors seek group experiences and combine gaming with entertainment activities. Dabblers represent casual players who explore gaming floors with low spending commitments. Lottery Loyalists maintain consistent demand for number-based games that offer simpler formats. The others segment includes diverse travelers who participate in gaming occasionally during leisure trips.
By Age Group and Tour Type
Younger groups between 18–35 years create strong momentum due to interest in entertainment-led tourism, while the 35–50 years segment supports premium gaming and hospitality packages. Older groups maintain preference for relaxed gaming formats with structured offerings. Independent Travellers lead overall movement across destinations, while Package Travellers and Tour Groups contribute steady demand through planned itineraries that integrate casino visits.
Segmentation:
By Game Type
- 3 Card Poker
- American Roulette
- Blackjack
- Casino Stud Poker
- Others
By Casino Type
- Commercial
- Tribal
- Limited Stakes
- I-gaming
- Others
By End-user
- Gambling Enthusiasts
- Social Exuberant
- Dabblers
- Lottery Loyalists
- Others
By Age Group
- 18–25 Years
- 25–35 Years
- 35–50 Years
- 50–65 Years
- 65 Years and Above
By Tour Type
- Independent Traveller
- Package Traveller
- Tour Group
- Others
By Country (Asia Pacific Coverage)
- China
- Japan
- South Korea
- India
- Australia
- Thailand
- Indonesia
- Vietnam
- Malaysia
- Philippines
- Taiwan
- Rest of Asia Pacific
Regional Analysis:
East Asia Leading With Strong Market Concentration
The Asia Pacific Casino Tourism Market records its highest share in East Asia, holding nearly 55% of the regional revenue. Macau anchors this leadership with large integrated resorts that attract long-haul and short-haul travelers throughout the year. Singapore supports the region’s dominance through strict regulatory frameworks and consistent premium tourism inflow. Japan strengthens future potential with planned resort developments that aim to lift international visitation. South Korea contributes steady volume through mid-scale casinos and rising entertainment tourism. The market benefits from strong airport connectivity and mature hospitality infrastructure that sustain high conversion rates among visitors.
Southeast Asia Strengthening Its Position As A High-Growth Cluster
Southeast Asia accounts for roughly 30% of the Asia Pacific share, supported by rising tourism demand and active resort expansion. The Philippines leads this subregion with large multi-resort districts that attract travelers from East Asia and Western markets. Vietnam gains traction through tourism-oriented policies that encourage casino development in designated zones. Malaysia maintains steady engagement through established resorts that appeal to regional travelers. Thailand and Indonesia explore structured approval pathways that could elevate their long-term role in this sector. This subregion evolves quickly due to rising disposable income and strong interest in entertainment-driven travel.
South Asia And Oceania Offering Niche Growth With Steady Expansion
South Asia and Oceania jointly contribute around 15% of the regional mix in the Asia Pacific Casino Tourism Market. Australia holds the largest share within this group, supported by strong domestic tourism and upscale casino properties. India shows rising interest through urban leisure travel, driven by a younger demographic exploring diverse tourism experiences. New Zealand maintains niche contributions through integrated entertainment zones. Smaller markets within this cluster work on regulatory clarity to attract international operators. The region benefits from a growing interest in destination-led travel that blends gaming, lifestyle experiences, and broader tourism activities.
Shape Your Report to Specific Countries or Regions & Enjoy 30% Off!
Key Player Analysis:
- Aristocrat
- Crown Resorts
- Entain
- Galaxy Entertainment
- Genting Group
- IGT
- Light and Wonder
- Melco
- Sands China
- SJM
- SkyCity Entertainment Group
- Wynn Macau
Competitive Analysis:
The Asia Pacific Casino Tourism Market reflects strong competition among integrated resort operators, gaming technology providers, and regional hospitality groups. Major players invest in larger gaming floors, premium entertainment areas, and upgraded accommodation to attract high-value travelers. It gains momentum from firms that deploy strong branding strategies, loyalty programs, and data-driven customer engagement tools. Operators enhance competitiveness by introducing themed attractions, live entertainment shows, and diverse culinary offerings across resort properties. Digital integration strengthens service delivery and improves visitor flow management. New entrants focus on differentiated experiences to secure visibility within high-growth tourism corridors. Established brands leverage long-standing reputations and strategic partnerships to reinforce leadership positions across the region.
Recent Developments:
- In April 2024, Aristocrat Leisure Limited completed the acquisition of Neo Group Ltd (formerly NeoGames S.A.). This milestone acquisition aligns with Aristocrat’s ‘build and buy’ growth strategy and strengthens its global online Real Money Gaming presence. NeoGames will be integrated with Aristocrat’s digital arm under the new business unit “Aristocrat Interactive,” marking a significant expansion in online gaming capabilities for the Asia Pacific and global markets.
- In 2025, Entain plc continued to scale its presence in Asia Pacific via strategic partnerships and operational growth. Notably, Entain operates the TAB NZ brand through a long-term strategic partnership with TAB New Zealand, providing proprietary technology and services for both retail and online gaming in the region.
Report Coverage:
The research report offers an in-depth analysis based on game type, casino type, end-user profile, age group, and tour type. It details leading market players, providing an overview of their business, product offerings, investments, revenue streams, and key applications. Additionally, the report includes insights into the competitive environment, SWOT analysis, current market trends, as well as the primary drivers and constraints. Furthermore, it discusses various factors that have driven market expansion in recent years. The report also explores market dynamics, regulatory scenarios, and technological advancements that are shaping the industry. It assesses the impact of external factors and global economic changes on market growth. Lastly, it provides strategic recommendations for new entrants and established companies to navigate the complexities of the market.
Future Outlook:
- Demand for entertainment-led integrated resorts will rise as travelers seek multi-experience destinations.
- Digital engagement tools will expand adoption, improving booking journeys and personalized visitor services.
- Premium hospitality upgrades will gain traction, driven by travelers seeking curated luxury experiences.
- I-gaming platforms will secure wider participation with improved connectivity and regulatory progress.
- Tourism campaigns will increase visibility for emerging destinations aiming to attract international travelers.
- Sustainability adoption will strengthen as operators invest in resource-efficient resort designs.
- Competition will intensify with more resort approvals across developing tourism corridors.
- Data-driven loyalty programs will enhance retention among frequent visitors and international travelers.
- Cross-border partnerships will expand integrated travel routes and visitor mobility.
- The market will gain resilience through broader entertainment offerings that reduce dependence on gaming alone.


