Makeup use and myopia shape regional lens demand
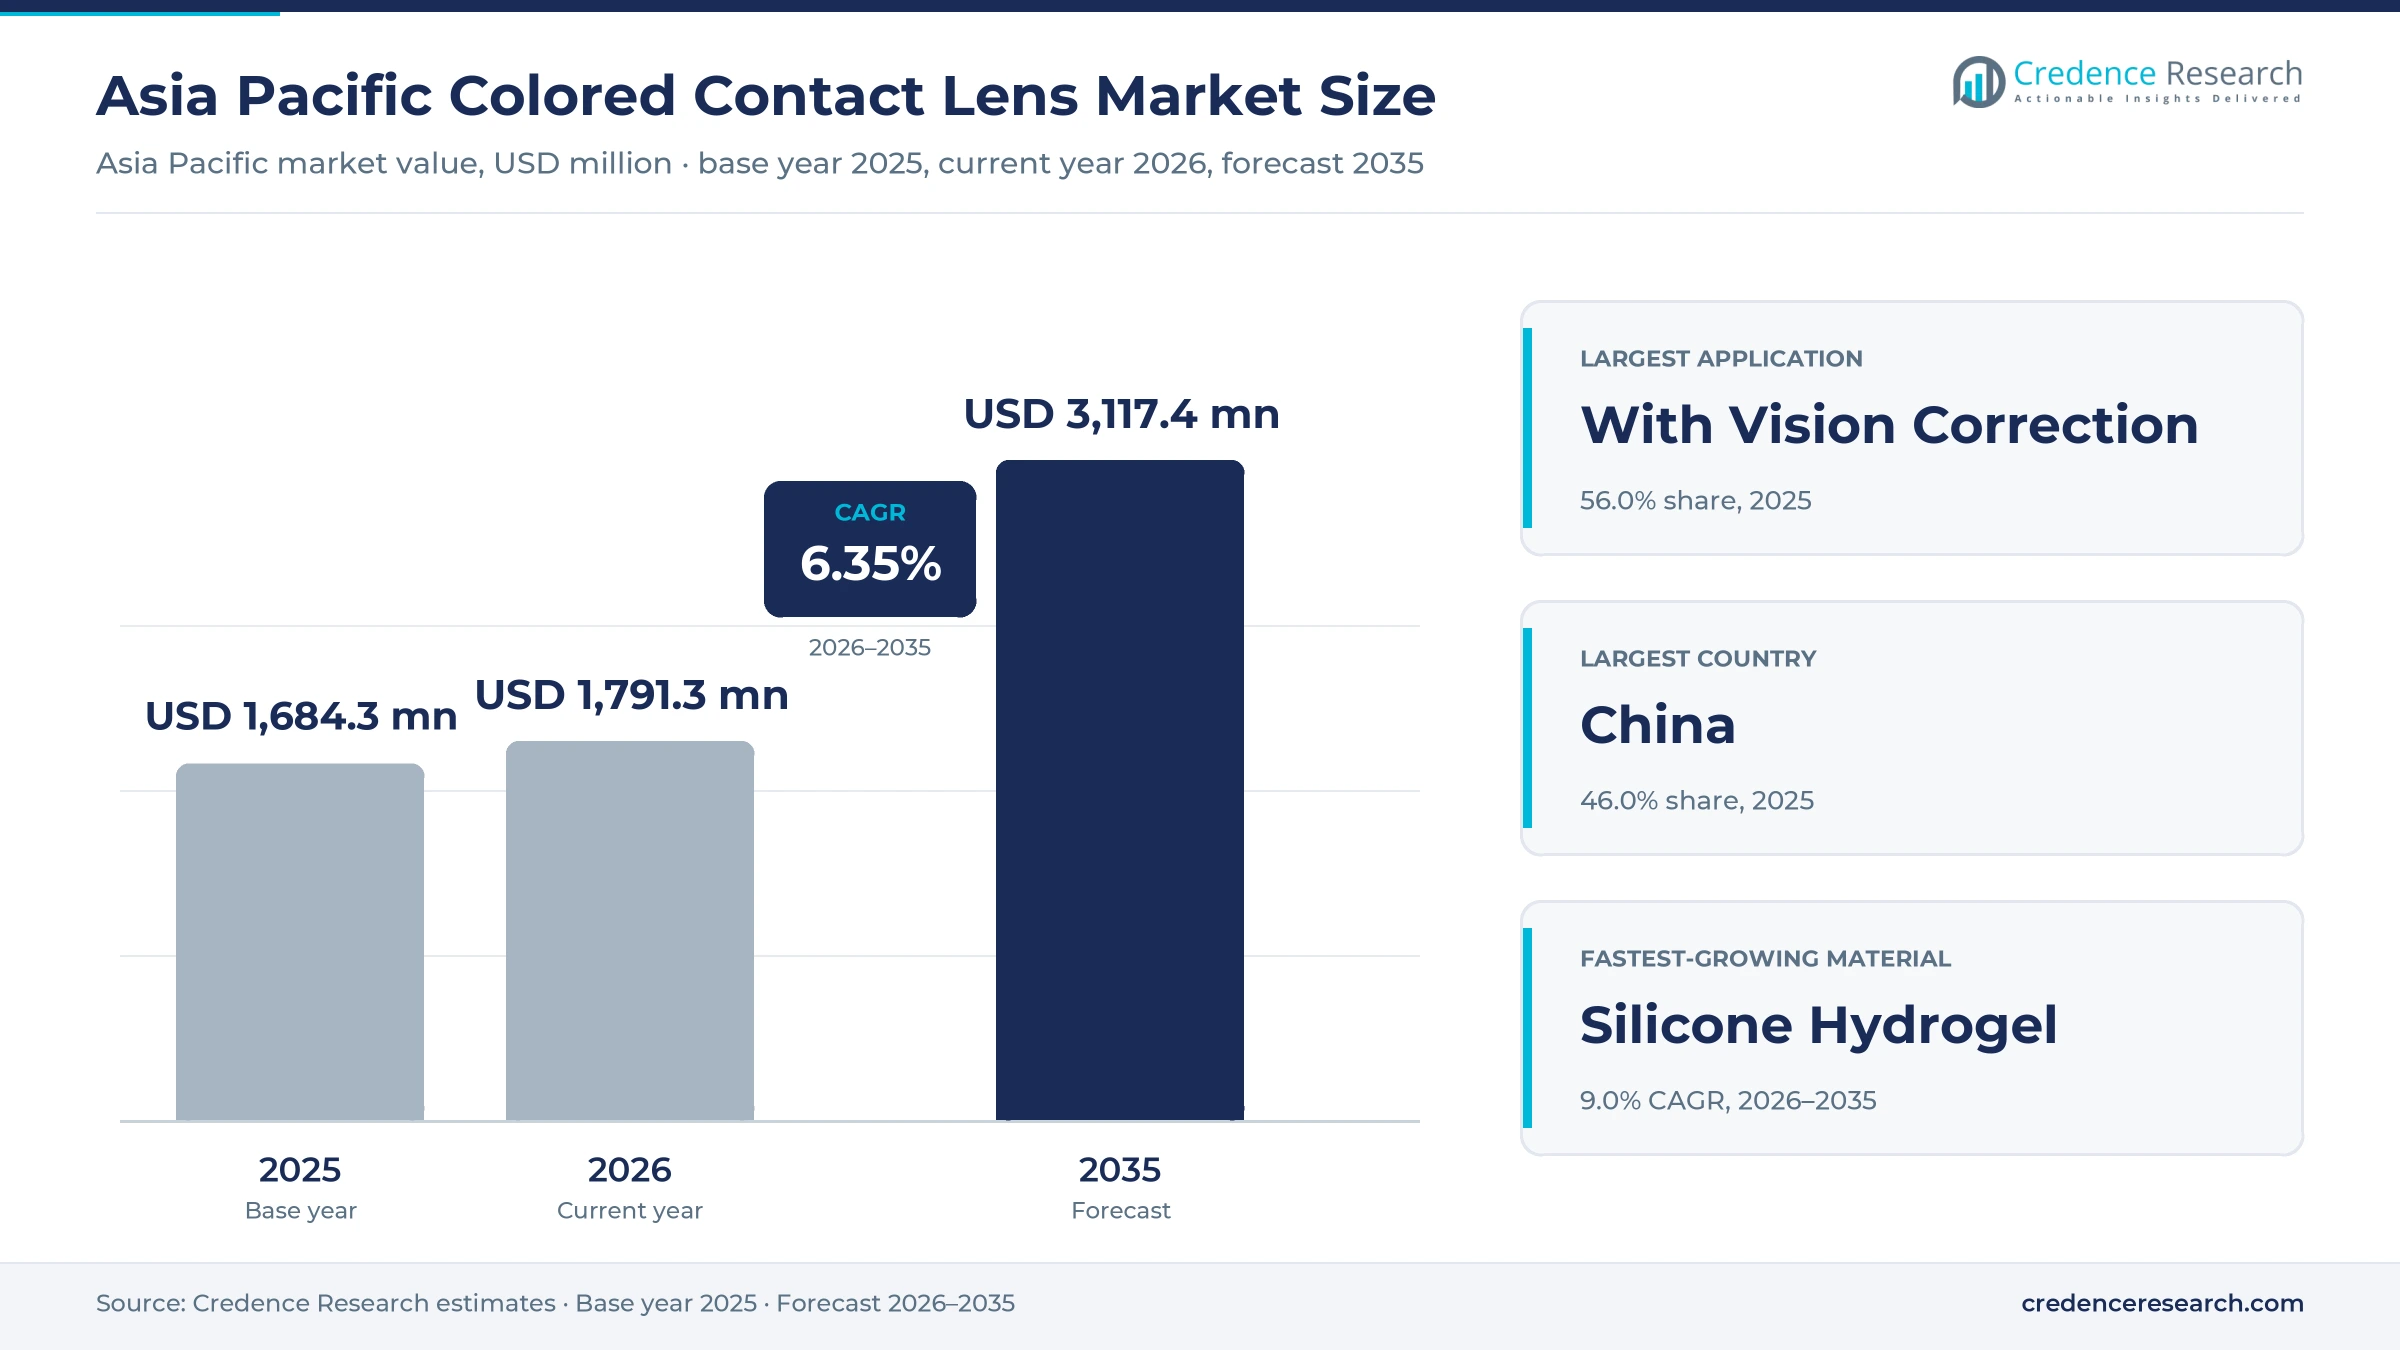
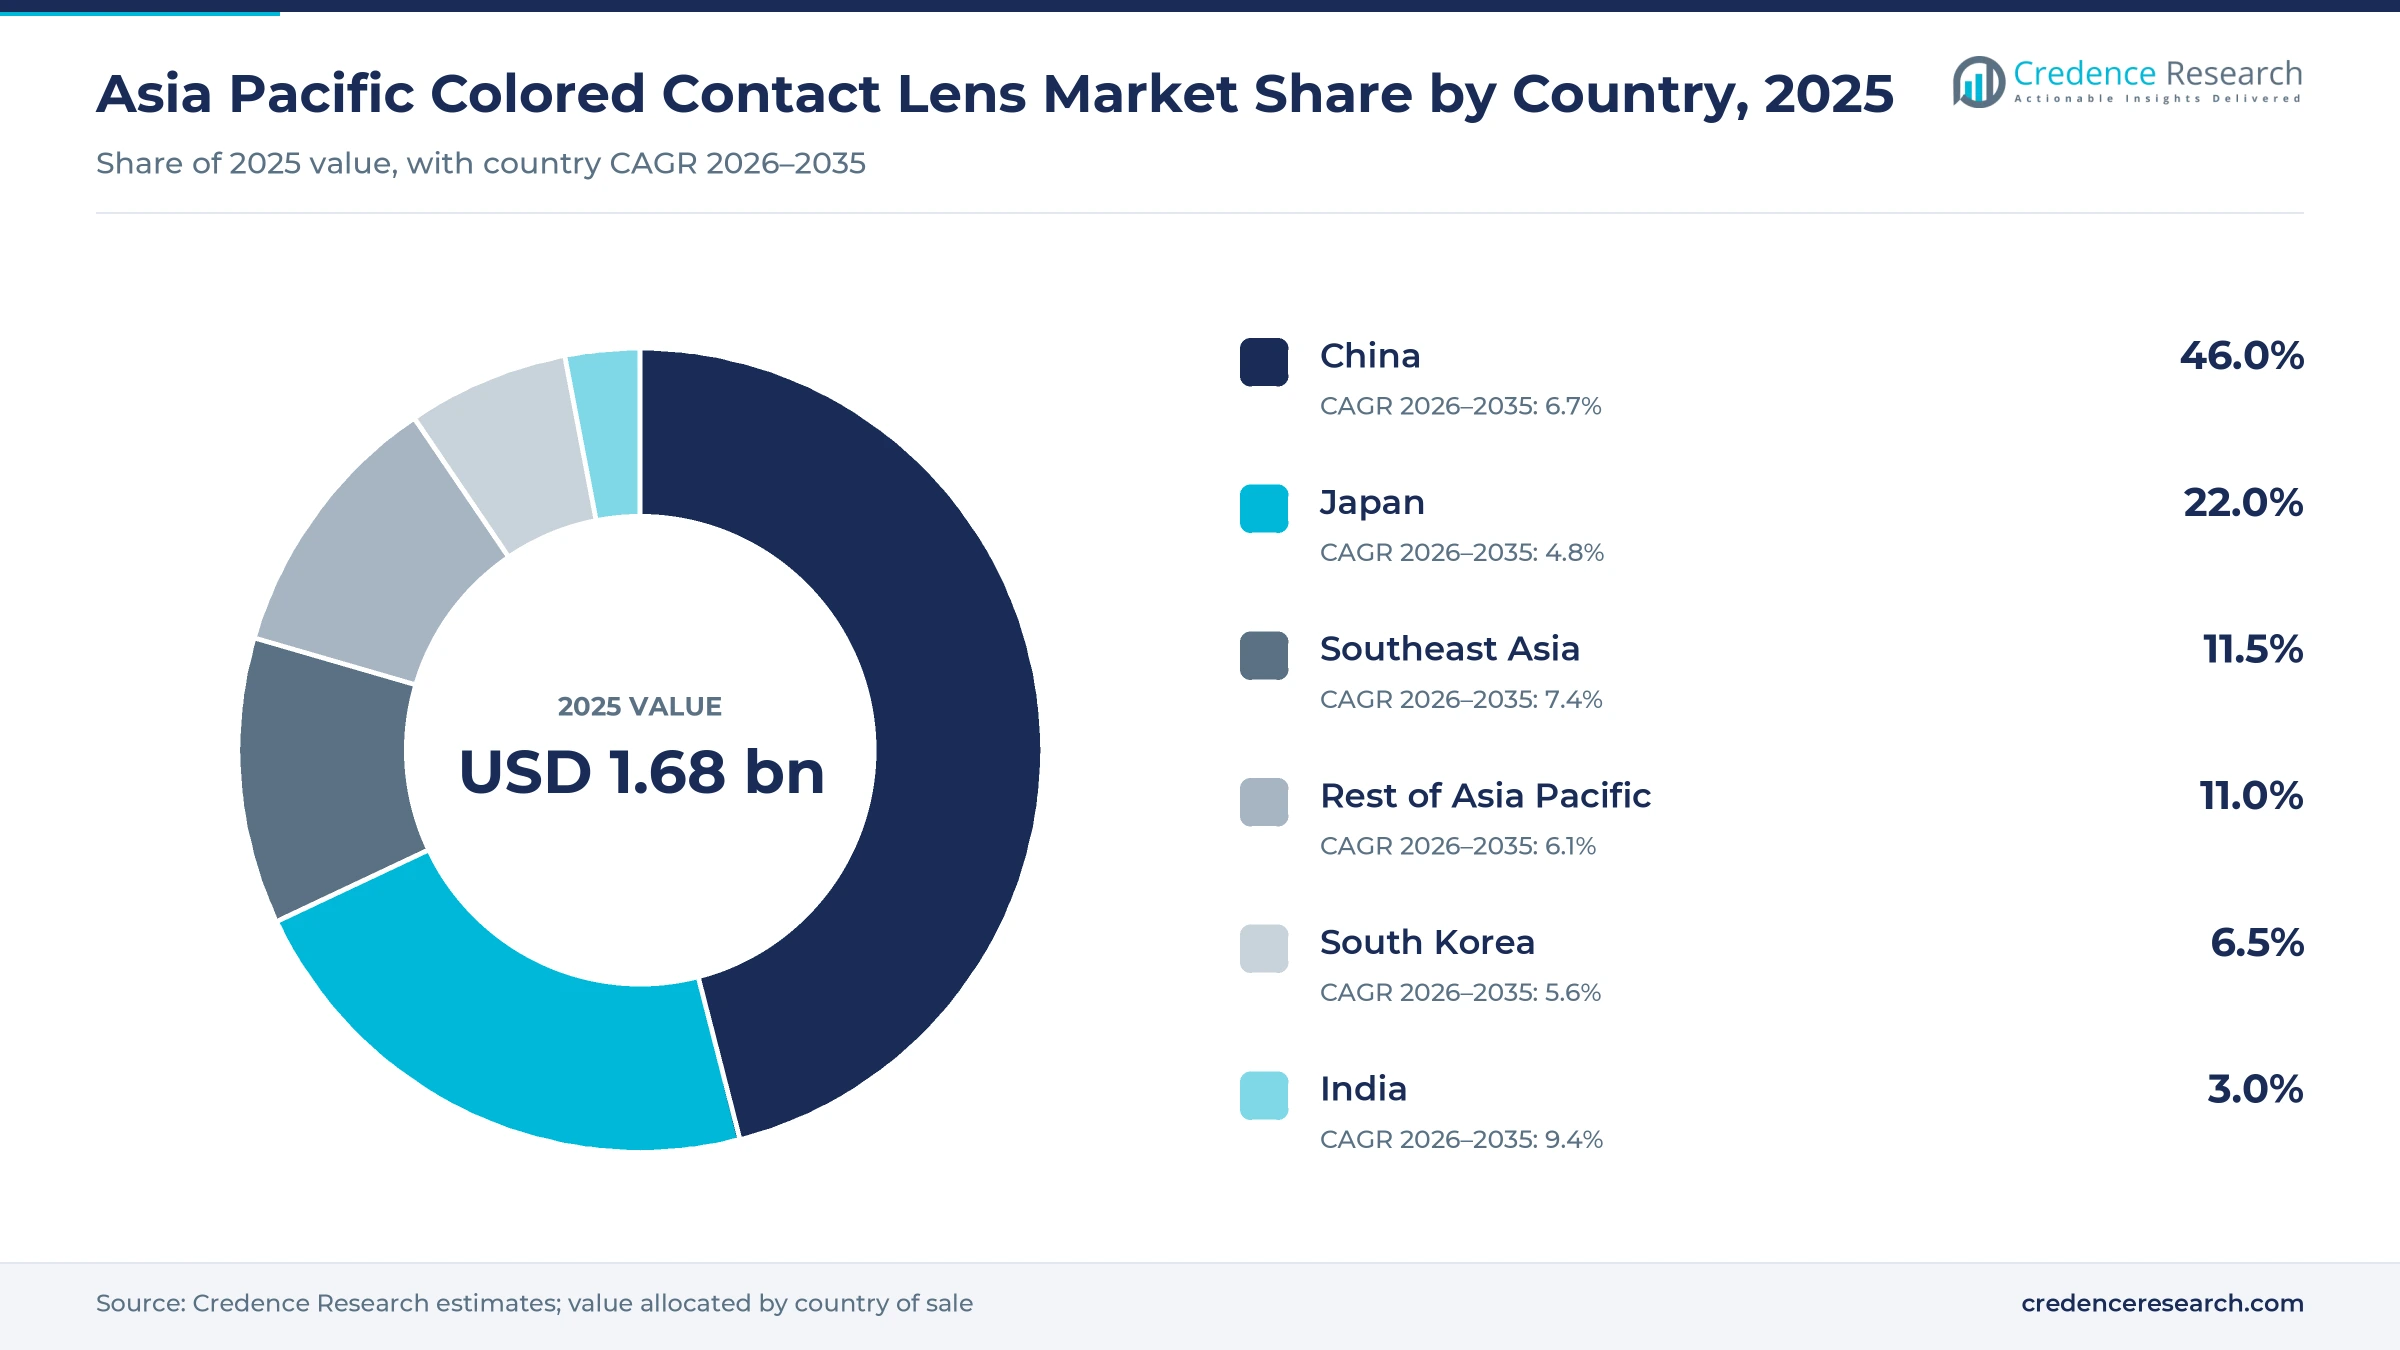
The Asia Pacific colored contact lens market was valued at USD 1.68 billion in 2025 and is projected to increase from USD 1.79 billion in 2026 to USD 3.12 billion by 2035, registering a CAGR of 6.35% during 2026–2035. Demand comes from young adults who wear tinted and patterned lenses as part of daily makeup, and from myopic wearers who want color and correction in one product. China held the largest country share, 46.0% in 2025, because domestic factories and online brands have pushed the price of a daily ten-pack sharply lower. India is the fastest-growing country at 9.4% a year, from a small base of optical-store and online buyers. Regulation shapes every channel, since China, Japan and Malaysia treat cosmetic lenses as medical devices, and South Korea and Malaysia bar online sales. Silicone hydrogel color lenses, which pass more oxygen to the cornea than older hydrogels, are the main product change now reaching shelves.
Makeup habits and high myopia rates anchor demand
The market counts the value of colored, tinted and patterned contact lenses sold in China, Japan, South Korea, India, Southeast Asia and the rest of Asia Pacific. It covers plano lenses worn only for appearance and powered lenses that correct myopia, astigmatism or presbyopia while changing iris color or apparent size. Daily, two-week, monthly and longer replacement lenses are all included in the estimate.
Clear lenses, lens care solutions, eye drops, spectacles and orthokeratology lenses are excluded from the count. Value moves from lens makers in Taiwan, South Korea, Japan, China and Malaysia, many of them contract manufacturers, to brand owners, then through optical chains, drugstores, variety stores, e-commerce platforms and eye clinics to wearers.
Asia Pacific Colored Contact Lens Market Insights
- The Asia Pacific colored contact lens market rises from USD 1.68 billion in 2025 to USD 3.12 billion by 2035, a 6.35% CAGR during 2026–2035, as silicone hydrogel color lenses widen daily wear.
- China held 46.0% of 2025 value, because domestic factories and online brands such as moody and Kilala sell daily lenses at low prices per pack.
- With Vision Correction held 56.0% of 2025 value, as China reported a 51.9% myopia rate among children and adolescents in 2022.
- Visco Vision is building its largest capacity expansion to date, mainly for color lenses, with new output due from the third quarter of 2026.
- South Korea and Malaysia bar online sales of contact lenses, so store networks keep the lead even as Chinese e-commerce grows fastest.
Corrective soft lenses lead as silicone hydrogel gains
Soft lenses dominate as rigid and hybrid designs stay clinical
Based on product, the market is categorized into soft contact lenses, rigid gas permeable lenses, and hybrid lenses. Soft Contact Lenses led with 96.0% of 2025 value because pigments print easily inside thin, flexible materials and Chinese factories turn out nearly 200 million colored lenses a month, up from about 10 million five years earlier, according to China News Service in July 2024. Soft Contact Lenses also grow fastest at 6.4% a year, as Interojo aims to lift production yield from 62% in 2024 to 85% by 2027, Asia Business Daily reported in September 2025, which cuts unit costs. Rigid and hybrid color designs remain small niches fitted by specialists.
Corrective color lenses lead as toric designs widen the range
Based on application, the market is categorized into with vision correction and without vision correction. With Vision Correction led with 56.0% of 2025 value because many colored lens buyers in East Asia are also myopic, and China's National Health Commission put the myopia rate among children and adolescents at 51.9% in 2022, People's Daily reported. With Vision Correction also grows fastest at 6.7% a year, as Menicon launched 1DAY Menicon Rei Toric, a daily color lens for astigmatism with powers down to -10.00D, in Japan on Feb. 26, 2025. Plano fashion lenses keep a large share, but they face the tightest rules on online sale.
Hydrogel still leads while silicone hydrogel colors scale
Based on material, the market is categorized into hydrogel, silicone hydrogel and other polymers. Hydrogel led with 74.0% of 2025 value because most printed color designs were first approved in hydrogel, and Interojo still sells hydrogel color lenses in Japan while it awaits approval of silicone hydrogel versions, Asia Business Daily reported in September 2025. Silicone Hydrogel grows fastest at 9.0% a year, as Ruierkang received Chinese registration for a silicone hydrogel lens in 2023 that passes eight times the oxygen of standard hydrogel, China News Service reported. Makers that master pigment printing in silicone hydrogel can charge more per box.
Licensed stores lead while e-commerce adds volume in China
Based on distribution channel, the market is categorized into retail stores, online stores and others. Retail Stores led with 58.0% of 2025 value because Japan has required a prefectural sales license and a designated sales manager for cosmetic lenses since Nov. 4, 2009, according to the Ministry of Health, Labour and Welfare, and South Korea bars e-commerce sales of contact lenses. Online Stores grow fastest at 7.9% a year, as Kilala roughly doubled its sales on Pinduoduo during the 2024 midyear 618 festival, China News Service reported. Clinics and hospitals make up most of the others group.
| Segment Group | Leading Sub-segment | Share, 2025 | Fastest-growing Sub-segment | CAGR, 2026–2035 |
|---|---|---|---|---|
| By Product | Soft Contact Lenses | 96.0% | Soft Contact Lenses | 6.4% |
| By Application | With Vision Correction | 56.0% | With Vision Correction | 6.7% |
| By Material | Hydrogel | 74.0% | Silicone Hydrogel | 9.0% |
| By Distribution Channel | Retail Stores | 58.0% | Online Stores | 7.9% |
Price per wearing day separates mass and premium lenses
Colored lenses are sold per box, and buyers compare the price per wearing day across daily disposables, two-week pairs and monthly pairs. Japanese daily color ten-packs list at about JPY 165 to JPY 169 per lens, while Chinese daily packs now sell for about CNY 4 per lens. Brand strength, the number of designs, silicone hydrogel material and licensed store costs move list prices. Brand owners therefore protect margins through new designs and premium materials, because contract supply keeps the cost of a basic hydrogel lens low.
| Product and market | Typical price or fee | Basis |
|---|---|---|
| Daily color lens ten-pack, China | About CNY 40, from about CNY 100 five years earlier | China News Service, July 2024 |
| O&ME daily color lens ten-pack, Japan | JPY 1,650 incl. tax | Bic Camera listing, November 2026 |
| EverColor 1day Milimore ten-pack, Japan | JPY 1,694 incl. tax | Bic Camera listing, November 2026 |
| Bausch + Lomb Lacelle Premium, box of two, India | INR 1,031.25 MRP | Tata 1mg listing, November 2026 |
| Aqualens color lens trial pack, India | From INR 99 | Silicon India report on Aqualens |
Request a Free Sample
Fill in your details and we'll send you a free sample report.
- Sample data tables & charts
- Research methodology
Online beauty buyers, myopia and new capacity lift demand
Chinese beauty buyers treat color lenses as daily makeup
Chinese buyers increasingly treat colored lenses as a daily makeup item rather than an occasional costume, which raises the number of boxes bought each year. Runtong passed one million orders on Pinduoduo during the 2024 618 festival, up 50% from a year earlier, according to China News Service. Interojo is growing direct sales in China through Douyin and Xiaohongshu, the short-video and lifestyle platforms where lens looks are shown on camera, Asia Business Daily reported in September 2025. Kilala roughly doubled its Pinduoduo sales in the same festival, and buyers who match lenses with eye makeup and skin care purchases tend to rotate several designs. Brands with fast design cycles and strong platform content gain most from this habit.
High myopia keeps powered color lenses in demand
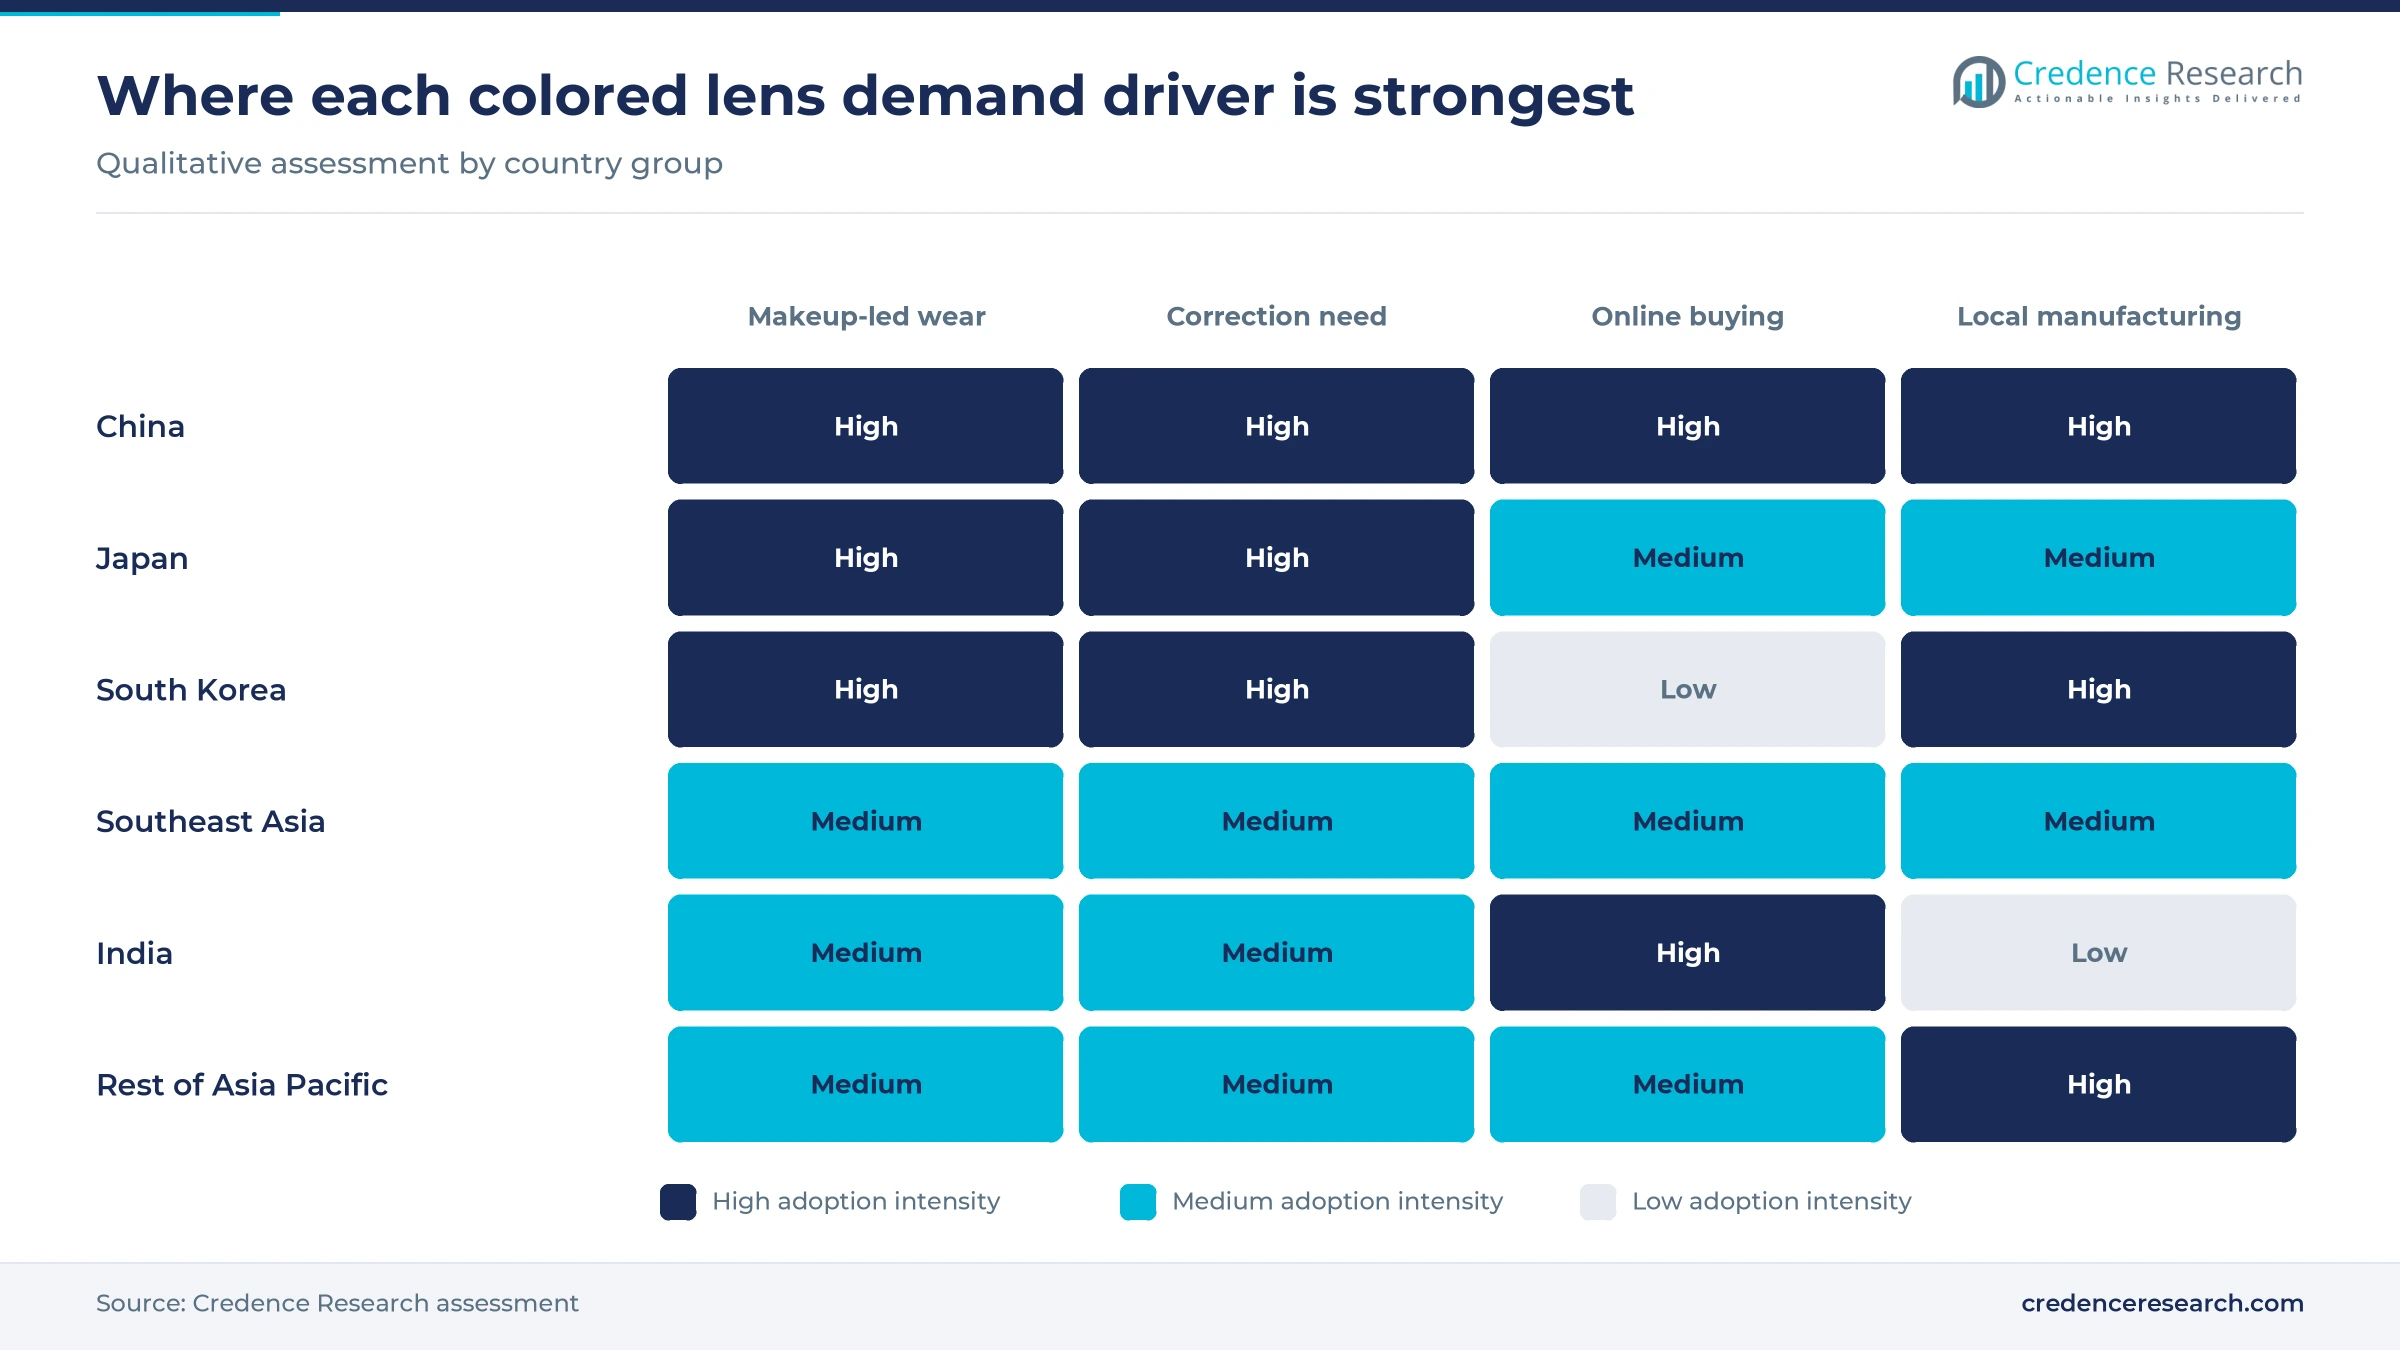
High myopia rates in East Asia mean many wearers need correction, so every powered color design competes with plain clear lenses for the same eye. China's myopia rate among children and adolescents stood at 51.9% in 2022, and the National Health Commission issued a revised myopia prevention guideline in June 2024, People's Daily reported. The guideline notes that multifocal soft lenses only slow progression, so most myopic teenagers will still need correction as adults, alongside myopia treatment in childhood. Japan has an estimated 15 million to 18 million contact lens users, according to the Consumer Affairs Agency in September 2021. Makers that offer wide power ranges in popular designs keep these wearers from switching back to clear lenses.
Contract makers add capacity for Asian brand owners
Contract manufacturers in Taiwan, South Korea and Malaysia are adding lines, which lets brand owners launch new designs without building plants. Visco Vision plans to lift monthly capacity from about 49 million pieces to 55 million in the third quarter of 2026 and 63 million in the first quarter of 2027, mainly at its Malaysian site, United Daily News reported in March 2026. The company serves more than 30 Japanese OEM and subsidiary customers and says rising Asian demand for color lenses has left its existing lines nearly full. South Korea exported USD 227.7 million of contact lenses of all types in 2023, according to WITS data. Brand owners without plants gain speed, while contract makers carry the capital risk.
Southeast Asian hubs widen regional distribution
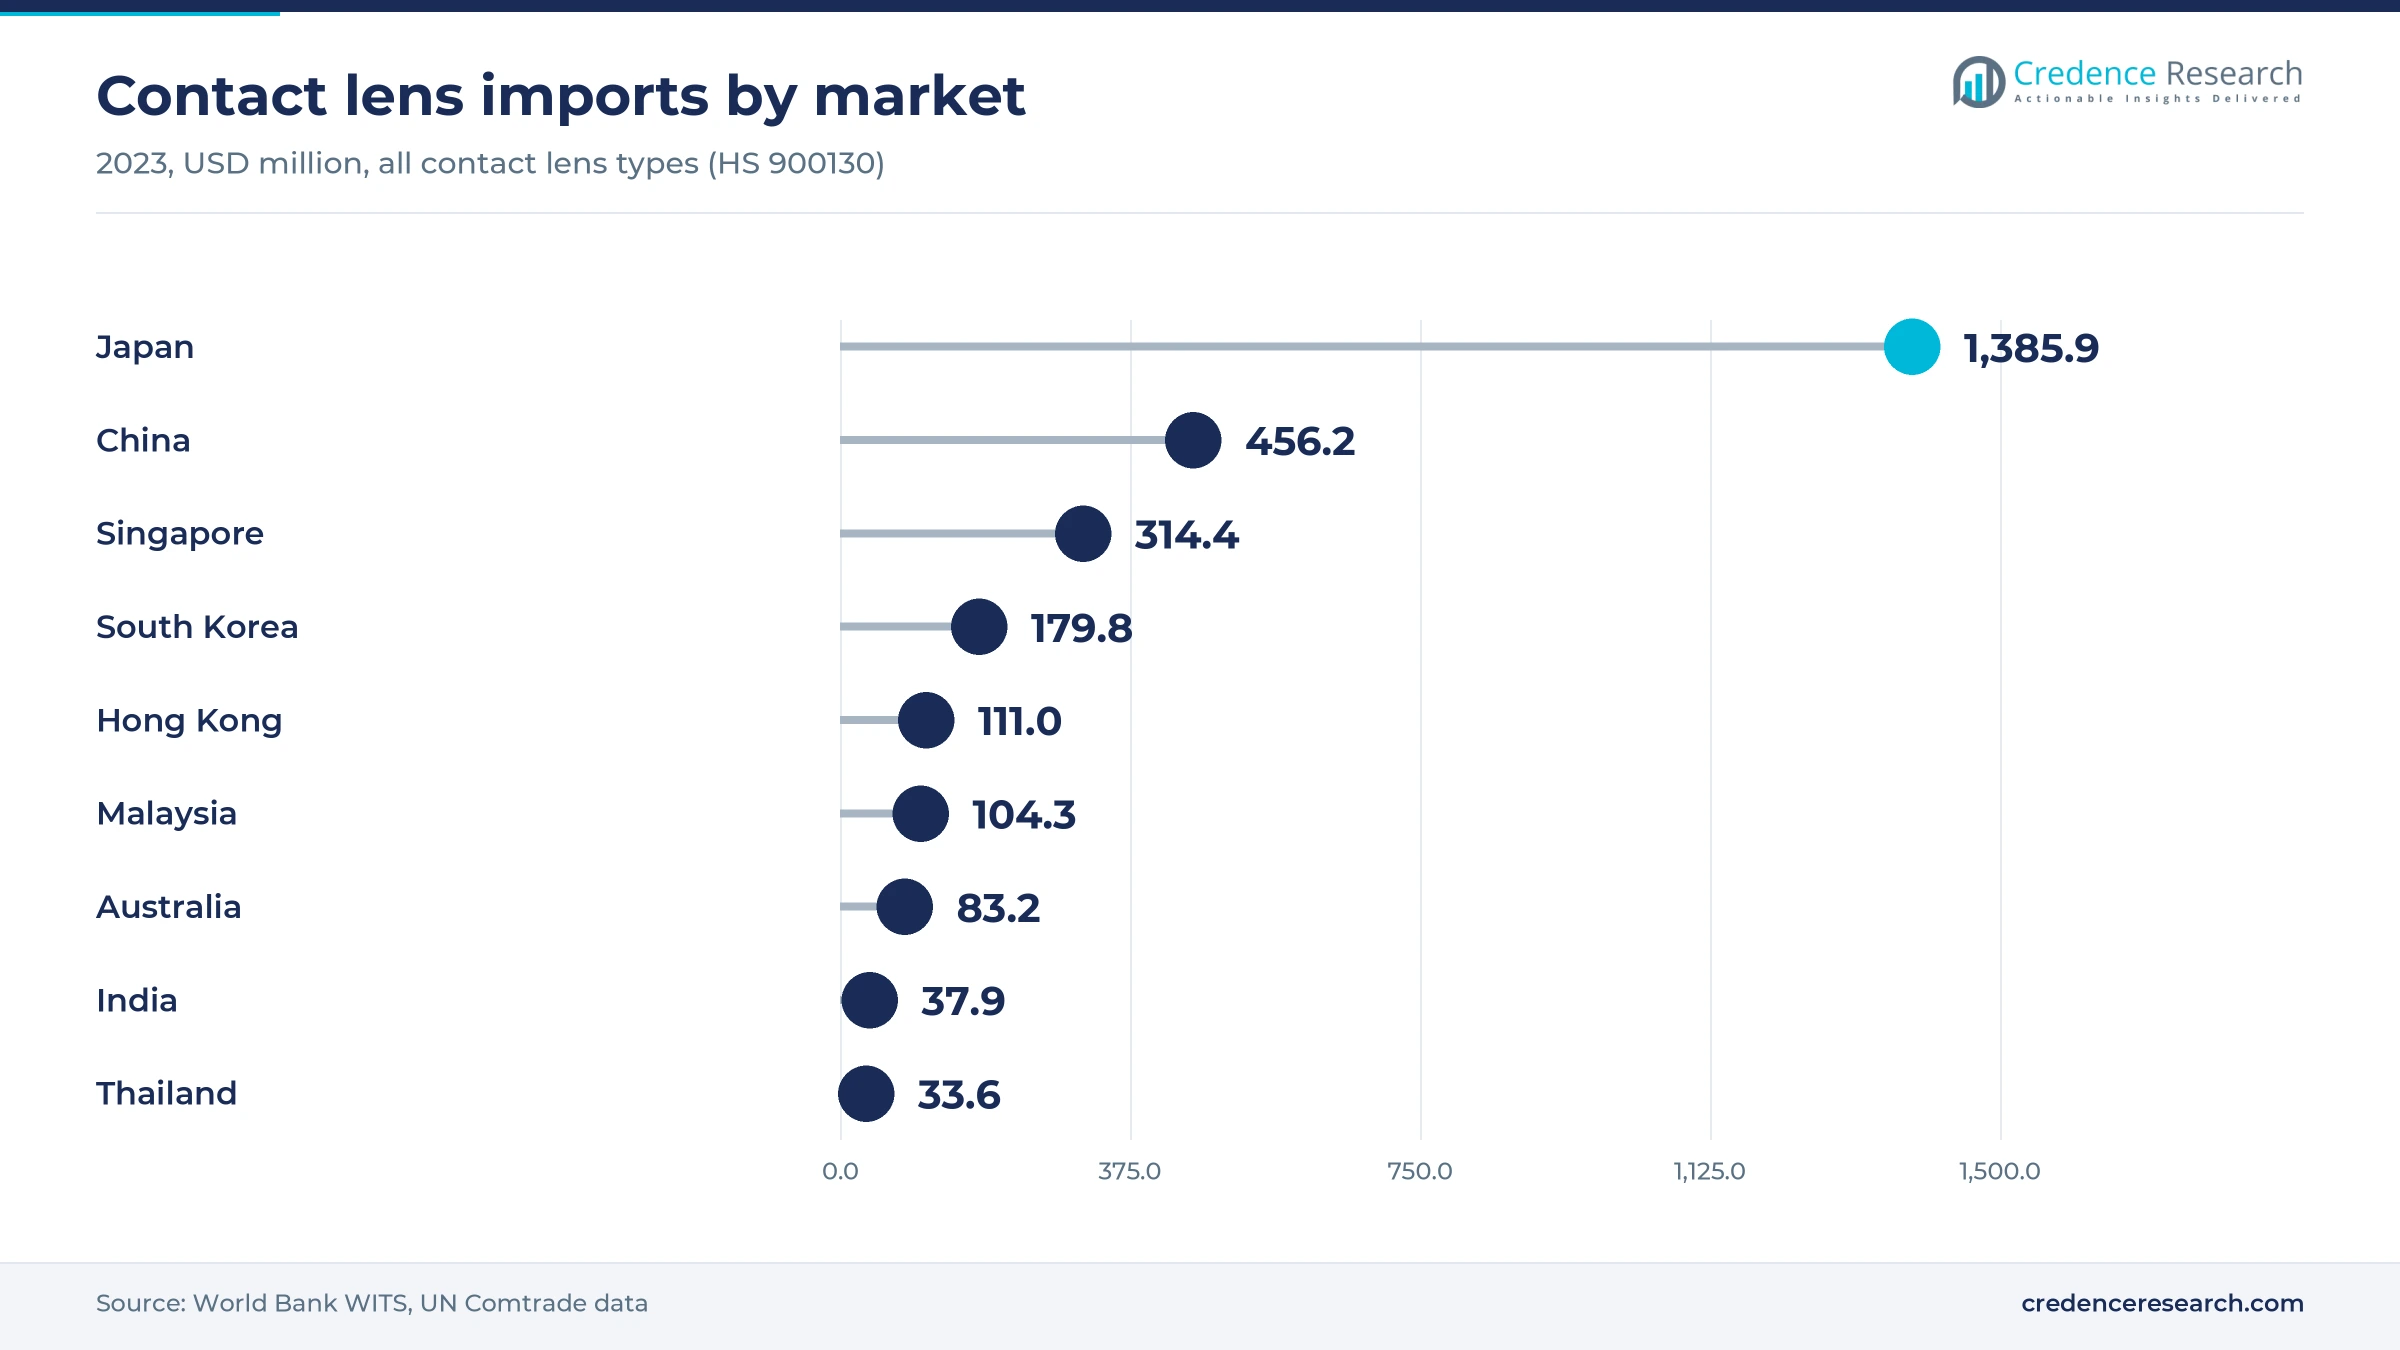
Southeast Asia combines regional distribution hubs with fast-growing consumer markets, which shortens delivery times for brands selling across the region. Singapore imported USD 314.4 million and exported USD 553.0 million of contact lenses of all types in 2023, according to World Bank WITS trade data, which marks its role as a re-export and logistics base. Malaysia exported USD 191.3 million of lenses in 2023, while Thailand imported USD 33.6 million and the Philippines USD 5.8 million. Southeast Asia grows at 7.4% a year in the Credence Research model. Distributors with registered products in several countries benefit most, because each market requires its own medical device filing.
Silicone hydrogel and corrective designs reshape ranges
Makers shift color designs to silicone hydrogel
Lens makers are shifting color designs from hydrogel to silicone hydrogel to address dryness during long days of wear. Interojo is focusing on silicone hydrogel color lenses, which carry the highest technical barriers, and a securities analyst expects in-house ink, binder and laser processes to save it about KRW 10 billion a year, Asia Business Daily reported in September 2025. Visco Vision says its lines have run above 90% utilization and that its new lines will mainly make silicone hydrogel color lenses, United Daily News reported in March 2026. Chinese makers are moving the same way, as the Ruierkang registration noted above shows. Makers that can print stable pigments in these materials gain pricing power.
Corrective designs move into color ranges
Japanese makers are moving toric and multifocal optics into color ranges to keep wearers who need more than simple myopia correction. Menicon launched the 2WEEK Menicon Rei multifocal in Japan in February 2023 and said the age range of colored lens users had widened. Its daily toric color lens followed on Feb. 26, 2025, with powers down to -10.00D, and Visco Vision says two to five customers have adopted its astigmatism lens line, United Daily News reported in March 2026. This shift favors makers with optical design depth, because a toric color lens must hold its pattern and its axis at the same time.
India opens through low-cost trial packs
India offers an opening because colored lens use is still low and online optical chains are lowering the cost of a first trial. Lenskart's Aqualens brand sells zero-power and powered color lenses with trial packs starting at INR 99 through its own site, Lenskart, Flipkart and Amazon, Silicon India reported. India imported USD 37.9 million of contact lenses of all types in 2023, about 17.3 million pieces, according to WITS data, so the installed base remains small. A two-lens box of Bausch + Lomb Lacelle Premium carries an MRP of INR 1,031.25 on Tata 1mg, so the trial pack sharply lowers the first purchase price. Brands that pair cheap trial packs with optometrist fitting in eyewear retail chains can convert first-time buyers into repeat wearers.
Licensed supply can replace gray-market lenses
Enforcement against unlicensed online sellers creates an opening for brands with registered products and traceable supply. Thai police and the Food and Drug Administration seized 322,500 unlicensed contact lenses worth THB 16.8 million at a Samut Prakan fulfillment warehouse on Oct. 16, 2025, The Nation reported. A 2022 study in Eye South East Asia found that only 17.65% of 252 monthly colored lens listings on a Thai e-marketplace gave usage and storage information. Japan's health ministry warns that lenses bought from overseas have not been checked for quality under its device law. Registered brands can win buyers who now look for proof of approval.
Sales bans, price deflation and approvals limit growth
Online sales bans cap reach in Korea and Malaysia
Bans on online lens sales cut off the cheapest route to young buyers in two markets. South Korea's Constitutional Court upheld the e-commerce ban in the Medical Technicians Act by an 8-to-1 vote in April 2024, Asia Business Daily reported. Malaysia's Medical Device Authority said in March 2025 that it would approve no online advertising or sale of contact lenses, with fines of up to RM200,000. Online-first brands are most exposed, because they must build store partnerships instead.
Price deflation compresses margins in China
Falling prices in China mean unit growth does not turn into equal value growth. A daily ten-pack that cost about CNY 100 five years before 2024 sold for about CNY 40 in 2024, China News Service reported, after the factory expansion described above. Mid-sized domestic brands without their own plants are most exposed, because they buy from the same contract makers as rivals and compete mainly on price. Value growth depends on moving buyers to silicone hydrogel and branded designs.
Medical device approvals slow new entrants
Every market treats colored lenses as medical devices, which adds approval time and cost to each new material or design. China has required registration certificates and production qualifications for colored lenses since April 1, 2012, and classes them as Class III devices, China News Service reported. Interojo still awaited Japanese approval for silicone hydrogel color lenses in September 2025. Small brands with many designs face the highest cost per launch, and approval delays can leave a new design off the shelf for a full season.
U.S. tariffs hit Asian contract makers
U.S. tariffs reduce export orders for Asian lens makers and can push spare capacity back into regional markets at lower prices. Visco Vision said U.S. demand fell in 2025 because of tariffs and earlier stockpiling by customers, and it was renegotiating growth plans with them, United Daily News reported in March 2026. Taiwanese and Korean contract makers with high U.S. exposure are most affected. Asian brand owners may gain cheaper supply, while margins at contract makers come under pressure.
China leads value while India grows from a small base
| Country | Value, 2025 (USD billion) | Share, 2025 | CAGR, 2026–2035 |
|---|---|---|---|
| China | 0.77 | 46.0% | 6.7% |
| Japan | 0.37 | 22.0% | 4.8% |
| Southeast Asia | 0.19 | 11.5% | 7.4% |
| Rest of Asia Pacific | 0.19 | 11.0% | 6.1% |
| South Korea | 0.11 | 6.5% | 5.6% |
| India | 0.05 | 3.0% | 9.4% |
China leads on volume and low daily lens prices
China held a 46.0% share of 2025 value and grows at 6.7% a year through 2035. Domestic brands such as Kilala, moody and Runtong sell mainly through e-commerce, while imported brands compete at higher prices. China also imported USD 456.2 million of contact lenses of all types in 2023, about 1.39 billion pieces, according to WITS data, which shows how much premium supply still comes from abroad. Growth is moderate in value because domestic price competition offsets strong unit demand.
Japan buys through licensed stores and imports
Japan held a 22.0% share of 2025 value and grows at 4.8% a year, the slowest regional pace. Japan imported USD 1.39 billion of contact lenses of all types in 2023, about 4.49 billion pieces, according to WITS data, a total dominated by clear corrective lenses, so it far exceeds colored lens spending. Taiwanese contract makers such as Visco Vision, which serves more than 30 Japanese customers, supply many color brands. Menicon and Seed make color ranges at home, while Alcon sells its FreshLook daily color series. Mature wear rates leave growth to premium materials and corrective designs.
Southeast Asia combines hubs and regulated retail
Southeast Asia held 11.5% of 2025 value and grows at 7.4% a year through 2035. Singapore and Malaysia serve as supply hubs, while Thailand, Indonesia, Vietnam and the Philippines are the main consuming markets. In the Philippines, Johnson & Johnson sells 1-Day Acuvue Define by prescription through its authorized distributor GB Vision Care, the Acuvue Philippines site states. Published value data for the Philippines and Vietnam are thin, so their estimates rest mainly on import data and listed prices.
South Korea is a design and manufacturing base
South Korea held a 6.5% share of 2025 value and grows at 5.6% a year through 2035. The domestic market for all contact lenses was about KRW 280 billion, and Acuvue, CooperVision and Bausch + Lomb held about 80% of it, Korea Economic Daily reported in March 2022, using 2021 data. Interojo, Geo Medical and other local makers sell much of their color output abroad. Domestic growth is slow because the online sales ban keeps purchases inside optical shops.
India grows fastest from a small installed base
India held a 3.0% share of 2025 value and is the fastest-growing country at 9.4% a year. India's drug regulator issued notice GSR 754(E), which required optical shops selling lenses to hold a registration certificate, and Bausch & Lomb India asked for a five- to six-month transition, BioSpectrum India reported in October 2022. Bausch + Lomb, Aqualens and Johnson & Johnson compete for first-time buyers. Wider registration of optical shops should support legitimate supply over the forecast period.
Taiwan and Australia anchor the remaining demand
Rest of Asia Pacific held 11.0% of 2025 value and grows at 6.1% a year through 2035. Taiwan, reported as Other Asia in WITS data, exported USD 518.4 million of contact lenses in 2023, the home base of contract makers such as Pegavision, Visco Vision and St. Shine Optical. Australia imported USD 83.2 million and Hong Kong USD 111.0 million of lenses in 2023. Hong Kong demand includes re-exports, so its local colored lens spending is an evidence gap.
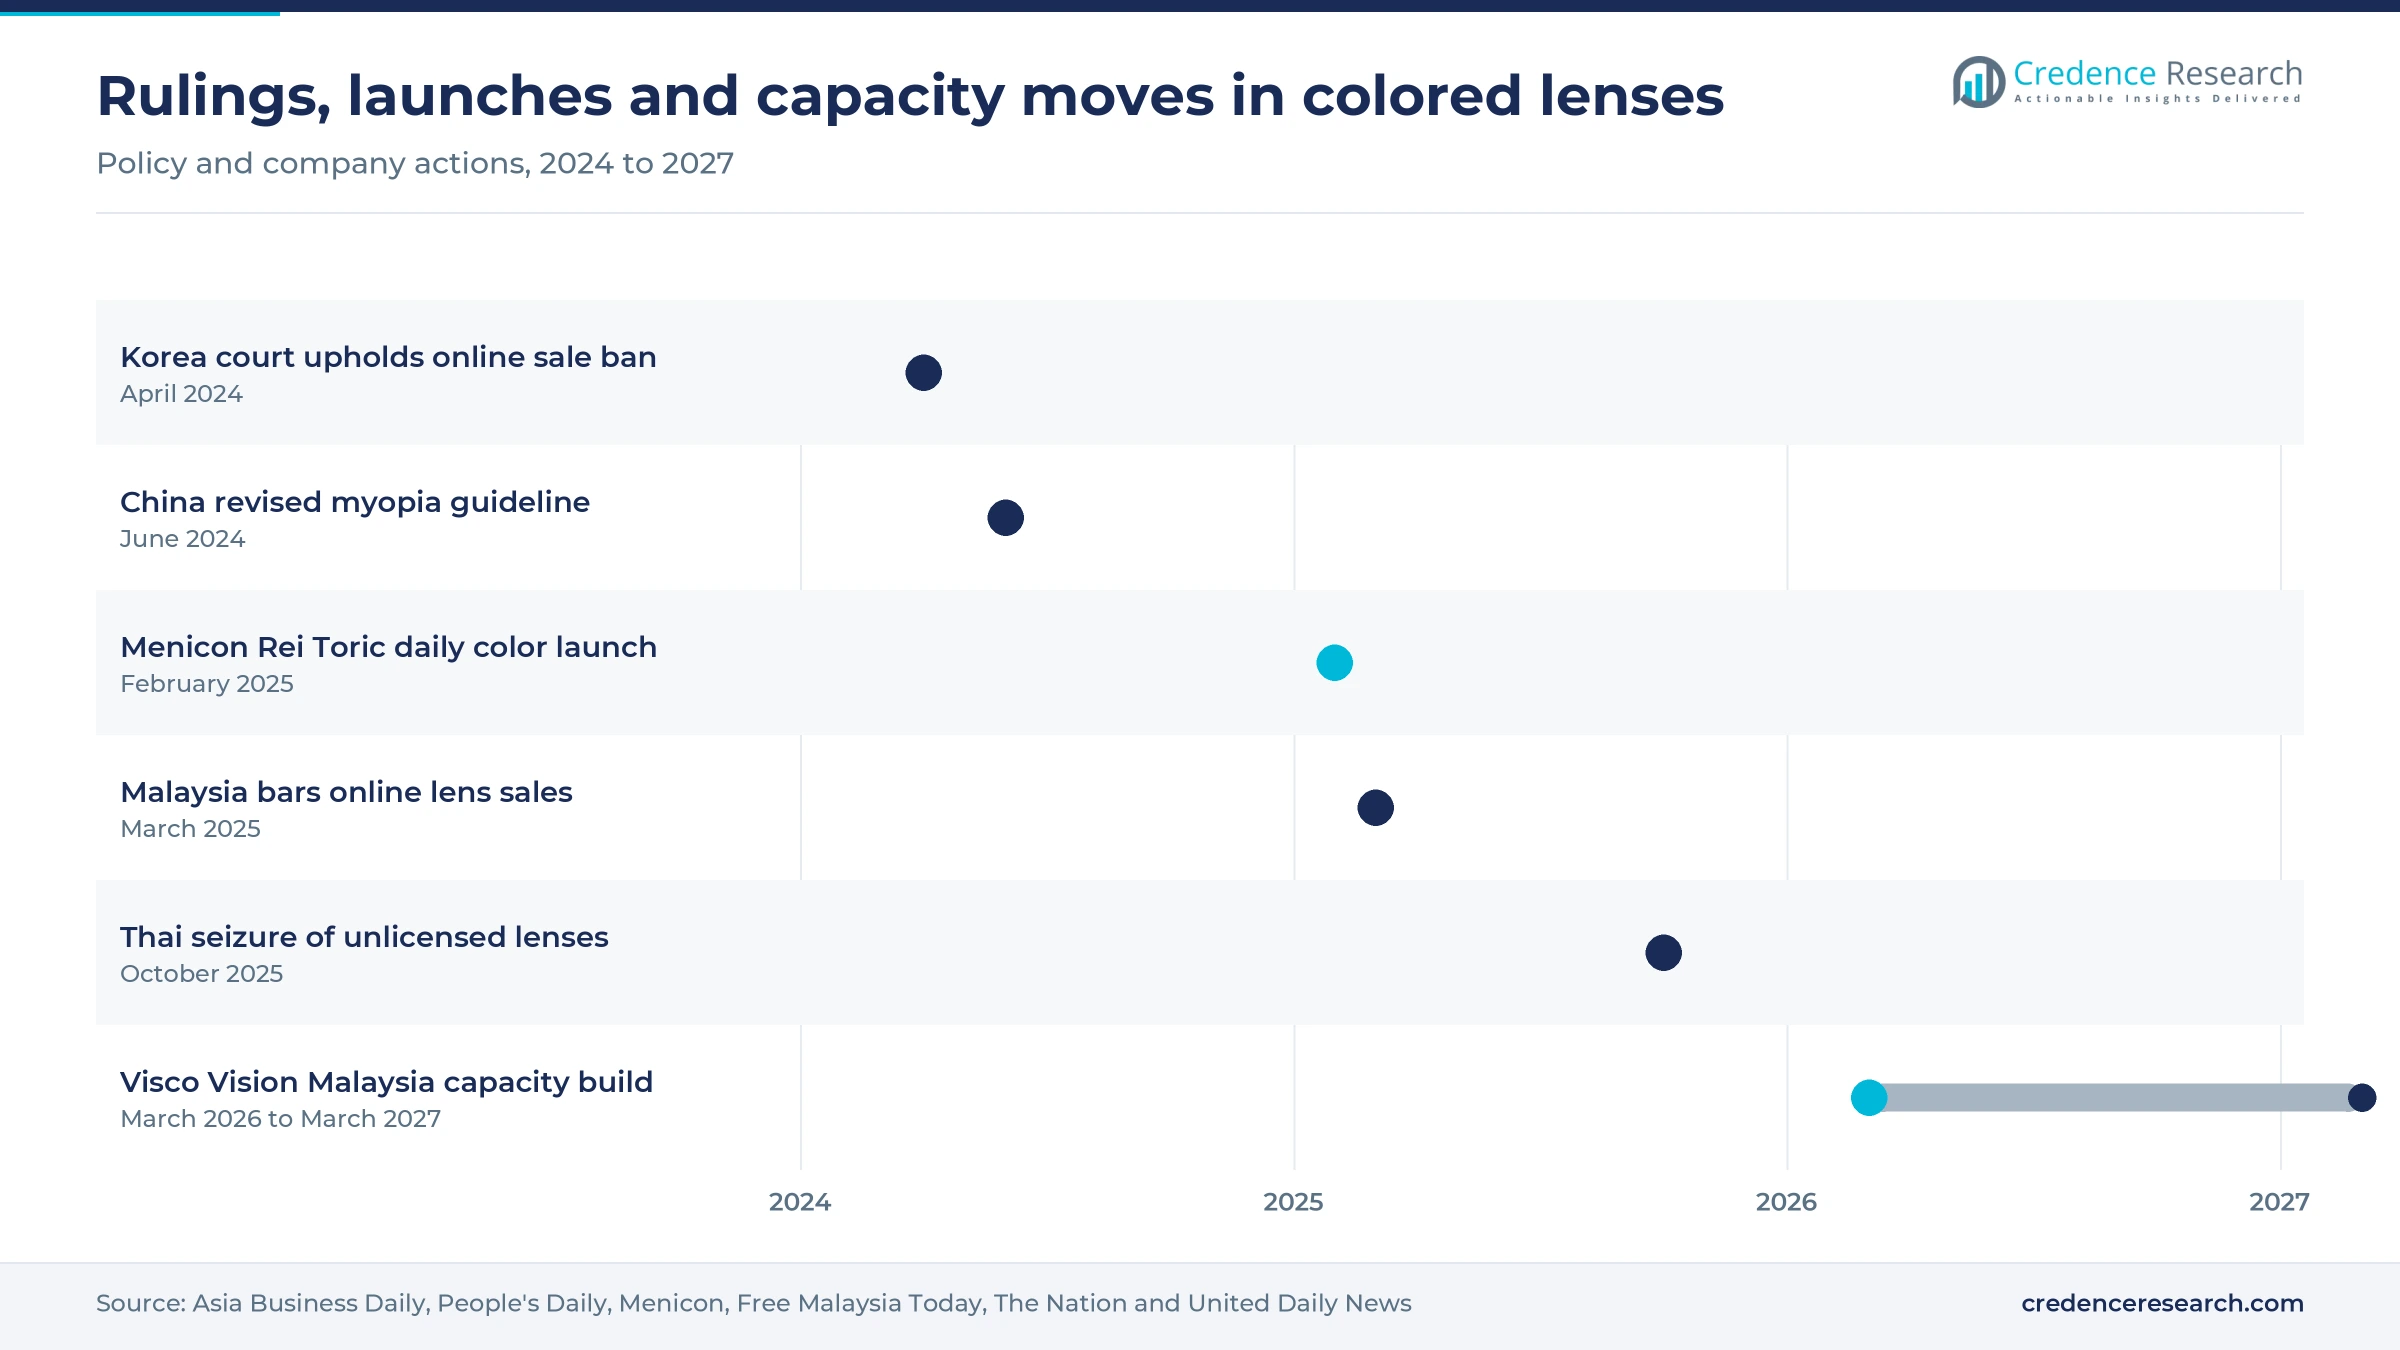
Rulings, launches and capacity moves, 2024 to 2026
| Development | Status and market relevance |
|---|---|
| In April 2024, South Korea's Constitutional Court upheld the ban on online contact lens sales by an 8-to-1 vote. | Completed ruling; the e-commerce ban stays in force. |
| In February 2025, Menicon launched 1DAY Menicon Rei Toric, a daily color lens for astigmatism, in Japan. | Commercial launch through MELS Plan member shops. |
| In March 2025, Malaysia's Medical Device Authority said it would approve no online advertising or sale of contact lenses. | Policy in force; enforcement targets e-commerce platforms. |
| In October 2025, Thai police and the Food and Drug Administration seized 322,500 unlicensed lenses in Samut Prakan. | Completed enforcement action against an online fulfillment warehouse. |
| In March 2026, Visco Vision started its largest capacity expansion, mainly at its Malaysian site. | Under construction; new output expected from the third quarter of 2026. |
Encapsulated pigments and breathable materials
- Encapsulated pigment layers keep the printed color sealed inside the lens matrix, so the pigment does not touch the cornea or the eyelid, a feature Menicon and Johnson & Johnson both promote.
- Silicone hydrogel materials pass several times more oxygen than standard hydrogels, which supports longer daily wear and lets brands charge more for each box.
- Toric and multifocal color optics correct astigmatism or presbyopia while keeping the printed pattern aligned on the eye, which widens the group of wearers who can buy color.
- Laser processing and AI vision inspection raise yield on printed lenses and cut scrap, which Interojo is adding to its plants as it internalizes ink and binder processes.
Need a Custom Version of This Report?
Tailor the scope, geography, or segments to your exact requirements.
- Custom geography or segment scope
- Direct access to our analyst team
Contract makers supply brands that compete on design
Competition in the Asia Pacific colored contact lens market splits into four groups. Multinationals, including Johnson & Johnson Vision, Alcon and Bausch + Lomb, compete through prescription brands, eye care professionals and comfort technologies. Japanese makers Menicon and Seed sell color series through licensed store networks, often with celebrity campaigns and fixed-fee plans. Contract makers such as Visco Vision, St. Shine Optical, Pegavision and Interojo supply many brand owners and compete on yield, design range and silicone hydrogel capability. Chinese online brands, led by moody and Kilala, compete on design turnover, platform content and price per box. Geo Medical represents the Korean makers that export branded color lenses. Retailers judge suppliers on registration status, design freshness and price per wearing day, which favors groups that control both production and brand.
Who makes the lenses that brands sell?
Supply is split between multinational lens makers, Japanese and Korean makers with their own brands, contract manufacturers and asset-light brand owners. Many Japanese and Chinese color brands do not own plants and buy finished lenses from makers in Taiwan, South Korea, Malaysia and China. Entry barriers sit in device approvals, pigment printing know-how and yield, while design and marketing are cheap to copy. Margins sit mostly with brand owners that control popular designs, and contract makers earn returns tied to utilization. Contract makers also handle sterilization and blister packaging, which adds to the capital they must commit.
Lens makers and brand owners buyers shortlist in the region
| Company | Type | Role in the market |
|---|---|---|
| Johnson & Johnson Vision (Johnson & Johnson) | Multinational lens maker | Sells 1-Day Acuvue Define color-enhancing lenses by prescription in Asian markets |
| Alcon | Multinational lens maker | Sells FreshLook daily color lenses in Japan and other Asian markets |
| Bausch + Lomb | Multinational lens maker | Sells Lacelle color lenses in India and colored lenses in China |
| Menicon Co., Ltd. | Japanese lens maker | Makes and sells the Menicon Rei daily, two-week and toric color series |
| Seed Co., Ltd. | Japanese lens maker | Sells Belleme and other color contact lens brands in Japan |
| Interojo | Korean lens maker | Makes hydrogel and silicone hydrogel color lenses for Claren and OEM partners |
| Visco Vision Inc. | Taiwanese contract maker | Makes color and silicone hydrogel lenses in Taiwan and Malaysia for over 30 Japanese customers |
| St. Shine Optical | Taiwanese contract maker | Makes daily disposable and color lenses in Taiwan for brand owners in Japan and Asia |
| Pegavision | Taiwanese contract maker | Makes daily and silicone hydrogel lenses, including color designs, for brand owners |
| moody | Chinese online brand | Sells short-replacement colored lenses through Tmall and other Chinese platforms |
| Kilala | Chinese domestic brand | Sells colored lenses through Pinduoduo and other Chinese e-commerce platforms |
| Geo Medical | Korean lens maker | Makes GEO-branded color lenses sold in Asia and through export retailers |
Material upgrades matter more than price cuts
Credence Research's view is that material upgrades, not lower prices, will decide value growth in Asia Pacific colored lenses through 2035. China supplies the most volume, but its daily lens prices have already fallen sharply, so brands there must sell silicone hydrogel and corrective designs to grow value. Japan stays the most profitable market per wearer, while India adds new buyers from a low base. Buyers should expect contract makers to offer more silicone hydrogel color designs as new Malaysian and Taiwanese capacity starts production.
Estimates rest on trade, price and regulatory data
The report uses 2025 as the base year and 2026 to 2035 as the forecast period. Values are measured at brand-owner selling prices, below retail shelf prices, which is why China's value is lower than its output of about 200 million lenses a month would suggest at retail. Market values come from the Credence Research model, and the country, product, application, material and channel splits are Credence Research estimates informed by public data. Sources include World Bank WITS trade data, health ministry and regulator notices, court rulings, company product releases, retailer price listings and regional news publishers. No interviews or surveys were used to build these estimates.
Value growth shifts to silicone hydrogel and India
Credence Research expects Asia Pacific colored lens value to reach USD 3.12 billion by 2035 as silicone hydrogel color lenses and corrective designs gain share. India should keep the fastest pace, while China remains the largest source of value. Silicone hydrogel grows at 9.0% a year during 2026–2035, as contract makers in Taiwan and Malaysia add lines for it, and online stores gain where law allows them. The main risks are continued price deflation in China and export swings caused by U.S. tariffs.
Material upgrades and Chinese pricing set the range
The range to 2035 depends on how fast wearers move to silicone hydrogel color lenses and on whether Chinese price competition keeps pulling down value per box. Wider online access outside South Korea and Malaysia would lift plano lens volume, while stricter enforcement against unlicensed sellers would shift value to registered brands. India matters more to the upside than to the base case, because its installed base is still small.
| Scenario | CAGR, 2026–2035 | Value, 2035 | What has to hold |
|---|---|---|---|
| Downside | 4.8% | USD 2.72 billion | Chinese daily lens prices keep falling and silicone hydrogel colors stay a premium niche |
| Base | 6.35% | USD 3.12 billion | Silicone hydrogel uptake, toric color launches and capacity additions continue at the 2025 and 2026 pace |
| Upside | 7.6% | USD 3.48 billion | Silicone hydrogel colors become standard in Japan and China and Indian trial buyers convert quickly |
Frequently Asked Questions
How big is the Asia Pacific colored contact lens market?
Which country leads colored contact lens demand in Asia Pacific?
Which country grows fastest?
Are cosmetic contact lenses without power regulated in Asia Pacific?
How large is the Philippines contact lens market?
Why are silicone hydrogel color lenses gaining share?
What are the main challenges for suppliers?
Who are the main companies in this market?
Table of Content
Chapter 1 Market Segmentation
- 1.1 Segmentation Framework
- 1.1.1 Product and Service Classification
- 1.1.2 Application and End-Use Classification
- 1.1.3 Technology and Solution Classification
- 1.1.4 Customer and Distribution Channel Classification
- 1.1.5 Geographic Segmentation
- 1.1.6 Market Segment Definitions and Boundaries
- 1.2 By Product
- 1.2.1 Soft Contact Lenses
- 1.2.2 Rigid Gas Permeable Lenses
- 1.2.3 Hybrid Lenses
- 1.3 By Application
- 1.3.1 With Vision Correction
- 1.3.2 Without Vision Correction
- 1.4 By Material
- 1.4.1 Hydrogel
- 1.4.2 Silicone Hydrogel
- 1.4.3 Other Polymers
- 1.5 By Country
- 1.5.1 China
- 1.5.2 Japan
- 1.5.3 South Korea
- 1.5.4 Southeast Asia
- 1.5.5 India
- 1.5.6 Rest of Asia Pacific
Chapter 2 Introduction
- 2.1 Report Objectives and Scope
- 2.2 Product Definition and Industry Terminology
- 2.3 Market Inclusions and Exclusions
- 2.4 Research Process
- 2.4.1 Primary Research and Expert Interviews
- 2.4.2 Secondary Research and Source Review
- 2.4.3 Top-Down and Bottom-Up Estimation
- 2.4.4 Data Triangulation and Verification
- 2.5 Market Size Measurement Basis
- 2.5.1 2025: USD 1.68 billion → 2035: USD 3.12 billion
- 2.6 Historical and Forecast Reference Periods
- 2.6.1 Historical Period: 2018-2025
- 2.6.2 Base Year: 2025
- 2.6.3 Forecast Period: 2025-2035
- 2.7 Research Assumptions and Limitations
Chapter 3 Executive Summary
- 3.1 Market Snapshot and Key Findings
- 3.2 Base-Year Market Size, 2025
- 3.3 Forecast Market Size, 2035
- 3.4 Revenue and Volume Growth Outlook
- 3.5 Key Demand and Supply Indicators
- 3.6 Leading Market Segments
- 3.7 Fastest-Growing Market Opportunities
- 3.8 Regional Performance Highlights
- 3.9 Technology and Industry Transformation
- 3.10 Competitive Landscape Summary
- 3.11 Analyst View and Strategic Implications
Chapter 4 Asia Pacific Colored Contact Lens Market Trends and Developments
- 4.1 Historical Industry Development, 2018-2025
- 4.2 Recent Market Trends and Developments
- 4.3 Demand and Customer Behavior Trends
- 4.4 Technology and Product Innovation
- 4.5 Artificial Intelligence, Automation and Digitalization
- 4.6 Local Manufacturing and Supply Chain Realignment
- 4.7 Industry Partnerships, Mergers and Acquisitions
- 4.8 Sustainability and Circular Economy Developments
- 4.9 Government and Private Sector Investment Trends
- 4.10 Emerging Business Models and Commercialization
- 4.11 Industry Developments and Announcements
Chapter 5 Asia Pacific Colored Contact Lens Market Production, Supply and Demand Analysis
- 5.1 Demand Trend and Consumption Analysis, 2018-2025
- 5.2 Demand Forecast, 2025-2035
- 5.3 Production and Output Trend, 2018-2025
- 5.4 Production and Output Forecast, 2025-2035
- 5.5 Installed Capacity and Capacity Utilization
- 5.6 Company-Wise Production Plants and Statistics
- 5.6.1 Installed Production Capacity
- 5.6.2 Actual Production
- 5.6.3 Planned Capacity and Expansion Targets
- 5.7 Supply Chain Structure and Procurement Trends
- 5.8 Supply-Demand Gap and Bottlenecks
- 5.9 Import Dependence and Sourcing Structure
- 5.10 Contract Manufacturing and Outsourcing
- 5.11 Regional Supply and Demand Concentration
Chapter 6 Asia Pacific Colored Contact Lens Market Pricing Analysis
- 6.1 Pricing Structure and Measurement
- 6.2 Historical Pricing Trends, 2018-2025
- 6.3 Pricing Outlook, 2025-2035
- 6.4 Average Selling Price and Unit Economics
- 6.5 Pricing by Product and Market Segment
- 6.6 Geographic Pricing Differences
- 6.7 Key Input, Energy, Labor and Logistics Costs
- 6.8 Contract Pricing and Purchasing Models
- 6.9 Pricing Sensitivity and Competitive Positioning
- 6.10 Price, Margin and Profitability Implications
Chapter 7 Asia Pacific Colored Contact Lens Market Dynamics
- 7.1 Market Growth Drivers
- 7.1.1 Demand-Side Drivers
- 7.1.2 Technology and Innovation Drivers
- 7.1.3 Infrastructure and Investment Drivers
- 7.1.4 Regulatory and Policy Drivers
- 7.2 Market Restraints
- 7.2.1 Cost and Affordability Constraints
- 7.2.2 Technology and Adoption Barriers
- 7.2.3 Supply Chain and Operational Constraints
- 7.3 Market Challenges
- 7.3.1 Competitive Pressure and Margin Erosion
- 7.3.2 Skills, Infrastructure and Implementation Gaps
- 7.4 Emerging Market Opportunities
- 7.5 Market Dynamics Impact and Time-Horizon Assessment
Chapter 8 Asia Pacific Colored Contact Lens Value Chain Analysis
- 8.1 Industry Value Chain Overview
- 8.2 Upstream Suppliers and Critical Inputs
- 8.3 Technology and Component Providers
- 8.4 Manufacturing or Service Delivery
- 8.5 Distribution, Channel Partners and Integrators
- 8.6 Downstream Applications and End Users
- 8.7 Value Addition and Profit Pools
- 8.8 Vertical Integration and Outsourcing
- 8.9 Supplier Concentration and Risk
- 8.10 Supply Chain Localization and Resilience
Chapter 9 Asia Pacific Colored Contact Lens Market Regulations and Policies
- 9.1 Relevant Laws, Standards and Compliance Frameworks
- 9.2 Product, Service, Safety and Quality Requirements
- 9.3 Government Policies, Incentives and Subsidies
- 9.4 Imports, Exports and Trade Barriers
- 9.5 Public Procurement and Local Content Requirements
- 9.6 Environmental and Sustainability Compliance
- 9.7 Upcoming Policy Changes and Market Implications
Chapter 10 Asia Pacific Colored Contact Lens Market Hotspots and Opportunities
- 10.1 Market Opportunity Mapping and Growth Hotspots
- 10.2 High-Growth Applications and Customer Groups
- 10.3 Underserved Markets and White-Space Opportunities
- 10.4 Emerging Technology and Product Opportunities
- 10.5 New Capacity and Investment Hotspots
- 10.6 Market Entry and Expansion Opportunities
- 10.7 Distribution and Partnership Opportunities
- 10.8 Near-Term and Long-Term Commercial Potential
- 10.9 Opportunity Attractiveness and Execution Risks
Chapter 11 Asia Pacific Colored Contact Lens Market Outlook, 2025-2035
- 11.1 Market Size and Analysis
- 11.1.1 Revenue (Market Measurement: 2025: USD 1.68 billion → 2035: USD 3.12 billion)
- 11.1.2 Market Volume and Quantity Sold
- 11.1.3 Historical Market Size, 2018-2025
- 11.1.4 Base-Year Market Size, 2025
- 11.2 Market Forecast, 2025-2035
- 11.2.1 Revenue Forecast to 2035
- 11.2.2 Volume Forecast to 2035
- 11.2.3 CAGR and Year-on-Year Growth
- 11.2.4 Incremental Revenue Opportunity
- 11.3 Forecast Assumptions and Scenario Analysis
- 11.3.1 Base-Case Forecast
- 11.3.2 Optimistic and Conservative Scenarios
- 11.3.3 Technology, Pricing and Policy Sensitivities
- 11.4 Market Attractiveness and Growth Outlook
Chapter 12 Asia Pacific Colored Contact Lens Market Segmentation and Outlook
- 12.1 Segmentation Summary and Market Shares, 2025
- 12.2 Largest and Fastest-Growing Segments
- 12.3 By Product - Market Size and Forecast, 2025-2035
- 12.3.1 Segment Definition and Scope
- 12.3.2 Historical Market Size, 2018-2025
- 12.3.3 Revenue Forecast, 2025-2035
- 12.3.4 Volume Forecast, 2025-2035
- 12.3.5 Base-Year Market Share, 2025
- 12.3.6 Segment CAGR and Growth Drivers
- 12.3.7 Subsegment Market Size and Forecast
- 12.3.7.1 Soft Contact Lenses
- 12.3.7.2 Rigid Gas Permeable Lenses
- 12.3.7.3 Hybrid Lenses
- 12.3.8 Subsegment Pricing and Adoption Trends
- 12.3.9 Leading Suppliers and Competition
- 12.3.10 Regional Demand and Opportunities
- 12.4 By Application - Market Size and Forecast, 2025-2035
- 12.4.1 Segment Definition and Scope
- 12.4.2 Historical Market Size, 2018-2025
- 12.4.3 Revenue Forecast, 2025-2035
- 12.4.4 Volume Forecast, 2025-2035
- 12.4.5 Base-Year Market Share, 2025
- 12.4.6 Segment CAGR and Growth Drivers
- 12.4.7 Subsegment Market Size and Forecast
- 12.4.7.1 With Vision Correction
- 12.4.7.2 Without Vision Correction
- 12.4.8 Subsegment Pricing and Adoption Trends
- 12.4.9 Leading Suppliers and Competition
- 12.4.10 Regional Demand and Opportunities
- 12.5 By Material - Market Size and Forecast, 2025-2035
- 12.5.1 Segment Definition and Scope
- 12.5.2 Historical Market Size, 2018-2025
- 12.5.3 Revenue Forecast, 2025-2035
- 12.5.4 Volume Forecast, 2025-2035
- 12.5.5 Base-Year Market Share, 2025
- 12.5.6 Segment CAGR and Growth Drivers
- 12.5.7 Subsegment Market Size and Forecast
- 12.5.7.1 Hydrogel
- 12.5.7.2 Silicone Hydrogel
- 12.5.7.3 Other Polymers
- 12.5.8 Subsegment Pricing and Adoption Trends
- 12.5.9 Leading Suppliers and Competition
- 12.5.10 Regional Demand and Opportunities
- 12.6 By Country - Market Size and Forecast, 2025-2035
- 12.6.1 Segment Definition and Scope
- 12.6.2 Historical Market Size, 2018-2025
- 12.6.3 Revenue Forecast, 2025-2035
- 12.6.4 Volume Forecast, 2025-2035
- 12.6.5 Base-Year Market Share, 2025
- 12.6.6 Segment CAGR and Growth Drivers
- 12.6.7 Subsegment Market Size and Forecast
- 12.6.7.1 China
- 12.6.7.2 Japan
- 12.6.7.3 South Korea
- 12.6.7.4 Southeast Asia
- 12.6.7.5 India
- 12.6.7.6 Rest of Asia Pacific
- 12.6.8 Subsegment Pricing and Adoption Trends
- 12.6.9 Leading Suppliers and Competition
- 12.6.10 Regional Demand and Opportunities
- 12.7 Segment Growth Comparison
- 12.8 Segment Attractiveness and Priority Matrix
Chapter 13 Asia Pacific Colored Contact Lens End-Use and Application Market Outlook
- 13.1 End-Use Industry and Customer Demand Structure
- 13.2 Leading Applications and Customer Groups
- 13.3 End-Use Market Size, Share and Forecast
- 13.4 Major End-Use Industry Deep Dives
- 13.4.1 Customer Requirements and Use Cases
- 13.4.2 Demand and Replacement Cycles
- 13.4.3 Technical and Regulatory Considerations
- 13.4.4 Purchasing and Procurement Models
- 13.4.5 Leading Vendors and Distribution Channels
- 13.4.6 Forecast and Commercial Opportunities
- 13.5 Emerging Applications and Cross-Segment Demand
- 13.6 End-Use Industry Investment Priorities
Chapter 14 Asia Pacific Colored Contact Lens Geographic Market Outlook, 2025-2035
- 14.1 Regional Market Size and Country-Level Shares, 2025
- 14.2 Country Market Size Comparison, 2025
- 14.3 Country Market Forecasts, 2025-2035
- 14.4 Subregional Industrial and Demand Clusters
- 14.5 Intra-Regional Pricing and Cost Differences
- 14.6 Cross-Border Trade and Supply Networks
- 14.7 Regional Supply and Demand Balances
- 14.8 Country Opportunity Comparison and Prioritization
Note: Every listed country is covered on the structure shown under the first country.
Chapter 15 Asia Pacific Colored Contact Lens Technology, Innovation and Sustainability Outlook
- 15.1 Technology Landscape and Maturity
- 15.2 Product, Process and Service Innovation
- 15.3 AI, Automation and Digital Tools in the Industry
- 15.4 Technology Adoption and Performance Benchmarking
- 15.5 Innovation Pipeline and R&D Investment
- 15.6 Patent and Intellectual Property Trends
- 15.7 Energy Efficiency and Resource Management
- 15.8 Sustainability, Recycling and Circularity
- 15.9 Technology Roadmap, 2025-2035
- 15.10 Risks of Obsolescence and Technology Substitution
Chapter 16 Asia Pacific Colored Contact Lens Market Key Strategic Imperatives
- 16.1 Growth and Market Entry Priorities
- 16.2 High-Return Products and Segments
- 16.3 Pricing, Profitability and Cost Optimization
- 16.4 Technology Investment and Product Differentiation
- 16.5 Supply Chain Localization and Resilience
- 16.6 Distribution and Customer Acquisition
- 16.7 Partnership, Acquisition and Capacity Strategy
- 16.8 Regional Expansion Priorities
- 16.9 Short-, Medium- and Long-Term Actions
Chapter 17 Competition Outlook
- 17.1 Industry Competition Characteristics
- 17.2 Market Structure and Concentration
- 17.3 Market Share and Competitive Positioning, 2025
- 17.4 Company-Wise Revenue and Product Benchmarking
- 17.5 Production and Service Capacity Benchmarking
- 17.6 Technology, Pricing and Differentiation
- 17.7 Regional Footprint and Distribution Strength
- 17.8 Mergers, Acquisitions and Strategic Alliances
- 17.9 New Entrants and Competitive Threats
- 17.10 Porter's Five Forces and Industry Attractiveness
- 17.11 Competitive Outlook, 2025-2035
Chapter 18 Company Profiles
- 18.1 Company Coverage and Selection Criteria
- 18.2 Johnson & Johnson Vision (Johnson & Johnson)
- 18.2.1 Business Description
- 18.2.2 Company Ownership and Geographic Presence
- 18.2.3 Product and Service Portfolio
- 18.2.4 Manufacturing and Operating Footprint
- 18.2.5 Production Capacity and Expansion Plans
- 18.2.6 Financial Performance and Investment
- 18.2.7 Market Share and Competitive Position
- 18.2.8 Technology and Innovation Capabilities
- 18.2.9 Strategic Alliances or Partnerships
- 18.2.10 Recent Developments
- 18.2.11 Growth Strategy and Outlook
- 18.3 Alcon
- 18.4 Bausch + Lomb
- 18.5 Menicon Co., Ltd.
- 18.6 Seed Co., Ltd.
- 18.7 Interojo
- 18.8 Visco Vision Inc.
- 18.9 St. Shine Optical
- 18.10 Pegavision
- 18.11 moody
- 18.12 Kilala
- 18.13 Geo Medical
- 18.14 Other Relevant Market Participants
Note: Every listed company is profiled on the structure shown under the first company. The company list is preliminary and may change based on research findings, market developments, data availability and client requirements.
Chapter 19 Disclaimer
- 19.1 Research and Forecast Disclaimer
- 19.2 Data Source and Estimation Limitations
Note: The depth of individual sections depends on data availability for this market. Volume, capacity, trade and other unit-based metrics are included where applicable.