| REPORT ATTRIBUTE |
DETAILS |
| Historical Period |
2020-2023 |
| Base Year |
2024 |
| Forecast Period |
2025-2032 |
| Asia Pacific Pea Proteins Market Size 2024 |
USD 663.06 Million |
| Asia Pacific Pea Proteins Market, CAGR |
13.54% |
| Asia Pacific Pea Proteins Market Size 2032 |
USD 1,830.93 Million |
Market Overview:
The Asia Pacific Pea Proteins Market is projected to grow from USD 663.06 million in 2024 to an estimated USD 1,830.93 million by 2032, with a compound annual growth rate (CAGR) of 13.54% from 2024 to 2032.
Several factors are driving the expansion of the pea protein market in Asia Pacific. A significant shift towards plant-based diets, influenced by health consciousness and environmental sustainability concerns, is evident. Consumers are increasingly opting for plant-based proteins like pea protein due to their health benefits and lower environmental impact compared to animal-based proteins. Additionally, the prevalence of lactose intolerance in many Asia Pacific countries has heightened the demand for dairy-free protein sources, further boosting the adoption of pea protein. The growing vegan and vegetarian populations, particularly in countries like India and China, also contribute to the increased demand for pea protein as a viable dietary supplement.
The Asia Pacific region exhibits diverse trends in the pea protein market, influenced by varying dietary habits, economic conditions, and cultural preferences. China holds a significant share of the market, driven by its large population and increasing health awareness. The country’s rapid urbanization and rising disposable incomes are contributing to the demand for plant-based protein products. India, with its substantial vegetarian population, is also witnessing a surge in pea protein consumption, particularly in urban areas where health and fitness trends are gaining momentum. Southeast Asian nations, such as Indonesia and Malaysia, are emerging as promising markets due to their growing middle class and shifting dietary patterns towards plant-based foods. Australia and New Zealand continue to lead in the adoption of plant-based proteins, supported by strong health and wellness trends and a well-established plant-based food industry.
Access crucial information at unmatched prices!
Request your sample report today & start making informed decisions powered by Credence Research Inc.!
Download Sample
Market Insights:
- The Asia Pacific Pea Proteins Market is expected to grow significantly, reaching an estimated USD 1,830.93 million by 2032, driven by a compound annual growth rate (CAGR) of 13.54% from 2024 to 2032.
- The global pea proteins market is projected to grow from USD 2,229.15 million in 2024 to USD 5,618.92 million by 2032, at a CAGR of 12.25%.
- The shift towards plant-based diets is one of the key factors fueling market growth, as consumers increasingly prioritize health and sustainability over traditional animal-based proteins.
- Lactose intolerance in many Asia Pacific countries is boosting the demand for dairy-free protein alternatives, with pea protein becoming a popular choice due to its high-quality nutritional profile.
- The growth of vegan and vegetarian populations, especially in countries like India and China, is contributing to the rise in pea protein consumption, particularly in urban areas.
- Environmental sustainability concerns are driving consumers to opt for plant-based proteins like pea protein, which offer a lower environmental footprint compared to animal agriculture.
- The competition from other plant-based proteins, such as soy and rice, presents a challenge, as these alternatives are more widely recognized and cost-effective.
- Despite the growing demand, limited consumer awareness of pea protein’s benefits remains a challenge, requiring targeted efforts to educate consumers and increase market acceptance.
Market Drivers:
Health Consciousness and Dietary Shifts
One of the primary drivers behind the growth of the Asia Pacific pea protein market is the increasing health consciousness among consumers. As more individuals become aware of the negative impacts of excessive animal protein consumption, the demand for plant-based alternatives like pea protein has surged. The shift toward healthier, more sustainable diets is becoming a significant trend, with many consumers opting for plant-based proteins due to their lower cholesterol, fat content, and overall health benefits. For instance, companies like Beyond Meat have expanded their offerings with pea protein-based chicken substitutes to meet this demand for clean-label vegan options. This movement is particularly notable in urban areas, where busy lifestyles and a higher prevalence of lifestyle diseases have contributed to a greater focus on diet and wellness.
Lactose Intolerance and Dairy-Free Preferences
Lactose intolerance is another key factor driving the demand for pea protein in the Asia Pacific region. A large portion of the population in countries such as China, Japan, and India experiences some level of lactose intolerance, making dairy consumption challenging. As a result, many consumers are turning to dairy alternatives like pea protein, which provides a high-quality protein source without the digestive issues associated with dairy. The increasing popularity of dairy-free diets, particularly among health-conscious and environmentally aware consumers, is accelerating the adoption of plant-based protein products.
Vegan and Vegetarian Population Growth
The growing vegan and vegetarian populations in the Asia Pacific region are contributing significantly to the rise in demand for pea protein. Countries like India, with a strong cultural preference for vegetarian diets, are witnessing a notable shift toward plant-based alternatives. Pea protein, being a versatile and sustainable source of protein, is increasingly incorporated into various food products targeting the vegan and vegetarian consumer base. As these dietary patterns continue to gain traction, pea protein serves as a reliable and cost-effective protein source, further propelling its popularity in the region.
Environmental Sustainability and Ethical Considerations
Environmental concerns and ethical considerations are increasingly influencing consumer choices in the Asia Pacific market. As awareness of the environmental impact of animal agriculture grows, many consumers are opting for plant-based protein sources like pea protein to reduce their carbon footprint and contribute to more sustainable food systems. Additionally, ethical concerns regarding animal welfare are pushing consumers to seek plant-based protein options. For instance, Benson Hill’s AI-powered breeding program aim to develop yellow peas with higher nutritional density and efficiency in land use. This shift is reflected in the growing preference for pea protein, which offers a eco-friendlier and cruelty-free alternative to traditional animal-based proteins. As sustainability continues to be a significant focus, pea protein is gaining ground as a viable solution for environmentally conscious consumers in the region.
Market Trends:
Expansion of Product Applications
The Asia Pacific pea protein market is witnessing a significant diversification in product applications. Beyond traditional uses in plant-based meat alternatives and dairy substitutes, pea protein is increasingly incorporated into a wide array of food and beverage products, including snacks, bakery items, and ready-to-eat meals. For instance, Daily Harvest recently launched an Organic Pea Protein Powder in the region, offering a single-ingredient, USDA-certified organic product specifically designed to be added to smoothies and breakfast bowls, meeting consumer demand for clean-label, additive-free protein options. This expansion is driven by the growing consumer demand for convenient, nutritious, and plant-based options. Manufacturers are innovating to develop clean-label products that cater to health-conscious consumers seeking transparency and minimal processing in their food choices.
Technological Advancements in Processing
Advancements in processing technologies are enhancing the functionality and appeal of pea protein. Innovations such as improved extraction methods and the development of textured and hydrolyzed pea proteins are enabling the creation of products that closely mimic the taste and texture of animal-based proteins. For instance, Ingredion, for example, has developed VITESSENCE® Pea 100 HD, a non-hydrolyzed pea protein that reduces chalky and gritty textures and improves mouthfeel in protein bars. These technological improvements are expanding the versatility of pea protein in various applications, from meat analogs to beverages and nutritional supplements. As a result, pea protein is becoming a more attractive option for both manufacturers and consumers seeking plant-based alternatives.
Growth in Sports Nutrition and Supplements
The demand for pea protein is also increasing in the sports nutrition and dietary supplements sector. Athletes and fitness enthusiasts are turning to plant-based proteins like pea protein due to their digestibility and amino acid profile. Pea protein isolates, in particular, are favored for their high protein content and suitability in protein powders, bars, and shakes. This trend reflects a broader shift towards plant-based nutrition in the wellness industry, with consumers seeking sustainable and effective alternatives to traditional animal-based supplements.
Regional Variations in Consumer Preferences
Consumer preferences for pea protein products vary across the Asia Pacific region, influenced by cultural dietary habits and local market dynamics. In countries like China and India, there is a growing acceptance of plant-based proteins, driven by health considerations and environmental awareness.Conversely, in regions with strong traditions of animal-based diets, the adoption of pea protein is more gradual.Understanding these regional differences is crucial for manufacturers aiming to tailor their products and marketing strategies to meet the diverse needs of consumers across the Asia Pacific market.
Market Challenges Analysis:
Limited Consumer Awareness
One of the significant challenges hindering the growth of the Asia Pacific pea protein market is the limited consumer awareness surrounding its benefits and applications. While plant-based proteins have gained popularity, pea protein, in particular, remains relatively unfamiliar to a broader consumer base in some regions. For example, while urban areas are seeing increased interest in plant-based diets driven by health concerns and ethical considerations, rural regions still lack exposure to such trends. Many consumers still associate plant-based proteins with niche markets, such as vegan or vegetarian diets, limiting the broader acceptance of pea protein as a mainstream food ingredient. Efforts to educate consumers about its nutritional benefits, versatility, and sustainability are crucial to overcoming this barrier and fostering market growth.
High Production Costs
The production cost of pea protein is another factor that can hinder market expansion. The extraction process for pea protein can be resource-intensive, requiring specialized technology and higher operational costs compared to other plant-based proteins. These costs often translate into higher retail prices for pea protein-based products, making them less accessible to price-sensitive consumers. As a result, manufacturers may face challenges in competing with more established protein sources, such as soy or whey protein, which are more cost-effective and widely available. Lowering production costs through technological innovations and economies of scale could help mitigate this challenge.
Competition from Other Plant-Based Proteins
The Asia Pacific pea protein market faces strong competition from other plant-based protein sources, such as soy, rice, and hemp protein. While pea protein offers several advantages, including its hypoallergenic properties, it must compete with these other proteins, which are often more widely recognized and utilized in food products. Soy protein, in particular, has a well-established presence in the region and is perceived as a more cost-effective option. Pea protein manufacturers must differentiate their products and emphasize unique selling points, such as sustainability and nutritional benefits, to gain a competitive edge in the crowded plant-based protein market.
Market Opportunities:
The Asia Pacific pea protein market presents significant growth opportunities, particularly due to the rising demand for plant-based food products. As more consumers in the region adopt vegan, vegetarian, and flexitarian diets, the need for sustainable and nutritious plant-based protein sources is accelerating. Pea protein, known for its hypoallergenic properties and high nutritional value, is well-positioned to capitalize on this trend. Manufacturers can explore opportunities to introduce pea protein-based alternatives in a wide range of food products, from meat substitutes to snacks, beverages, and dairy alternatives. As consumers become more health-conscious and environmentally aware, the demand for such products is expected to continue rising, creating a favorable market landscape for pea protein.
In addition to growing consumer trends, emerging markets within the Asia Pacific region offer substantial opportunities for pea protein producers. Countries such as India, China, and Southeast Asia, with large populations and increasing middle-class consumers, present untapped potential for plant-based protein products. These regions are witnessing shifts in dietary patterns, with an increasing focus on health, sustainability, and animal welfare. By tailoring products to meet local tastes and dietary preferences, companies can expand their market share in these emerging economies. Furthermore, the development of new processing technologies that improve product functionality and taste can further enhance the attractiveness of pea protein in these fast-growing markets.
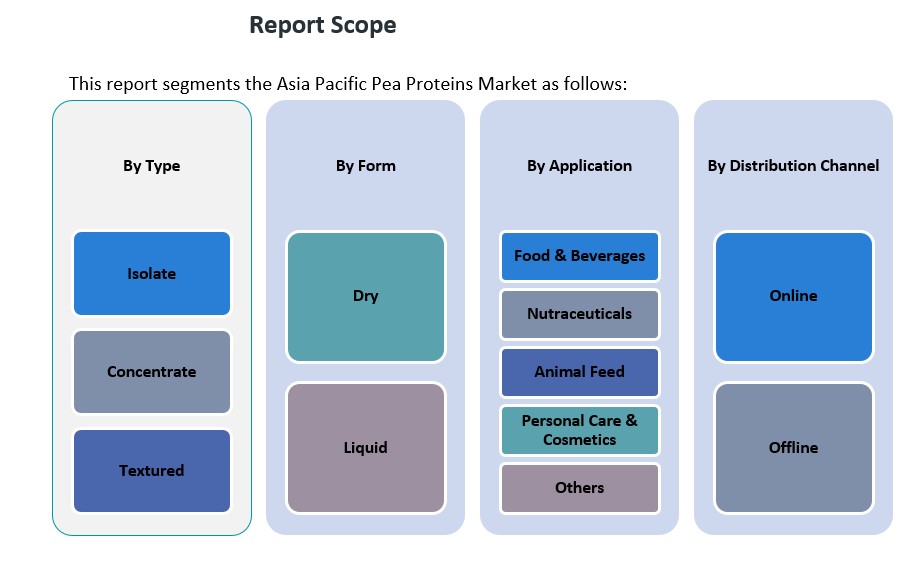
Market Segmentation Analysis:
The Asia Pacific pea proteins market is segmented across various categories, each offering distinct growth opportunities.
By Type
The market is divided into three key types: isolate, concentrate, and textured. Among these, pea protein isolate is gaining significant traction due to its high protein content and suitability for use in various food and beverage products, including protein shakes and meat substitutes. Pea protein concentrate, which contains a lower protein percentage than isolates, is commonly used in nutritional bars and snacks. Textured pea protein is seeing increased demand in the plant-based meat sector, as it mimics the texture of meat, making it ideal for vegan and vegetarian products.
By Application
Pea protein finds applications in multiple industries, with food and beverages being the largest segment. Its popularity in plant-based products such as dairy alternatives, plant-based meats, and snacks is driving the demand. The nutraceuticals segment also presents growth potential as pea protein is used in supplements due to its amino acid profile. Additionally, pea protein is increasingly used in animal feed, particularly in the production of livestock and pet food, while the personal care and cosmetics sector is utilizing pea protein for its skin-conditioning properties.
By Form
Pea proteins are available in dry and liquid forms. The dry form is more widely used in food applications and supplements, while the liquid form is increasingly used in beverages and ready-to-drink products.
By Distribution Channel
The distribution of pea proteins is facilitated through online and offline channels. Online sales are expanding rapidly due to the growth of e-commerce platforms, while offline channels, including retail and direct sales, continue to dominate in certain regions.
Segmentation:
By Type
- Isolate
- Concentrate
- Textured
By Application
- Food & Beverages
- Nutraceuticals
- Animal Feed
- Personal Care & Cosmetics
- Others
By Form
By Distribution Channel
Regional Analysis:
The Asia Pacific pea proteins market exhibits considerable growth across various regions, driven by shifting dietary patterns, increasing health consciousness, and rising demand for plant-based protein alternatives. Each region within Asia Pacific displays unique market dynamics, contributing to the overall market expansion.
China
China holds the largest share of the Asia Pacific pea protein market, accounting for approximately 30% of the market in 2023. The country’s increasing focus on health and wellness, coupled with growing interest in plant-based diets, drives demand for pea protein-based products. The growing prevalence of lactose intolerance, particularly in urban areas, is also accelerating the shift toward plant-based protein alternatives. With a large population and rapid urbanization, China remains a key market for pea protein manufacturers looking to tap into the health-conscious consumer segment. Additionally, the government’s support for sustainable agriculture practices is contributing to the increased production and use of plant-based proteins.
India
India is another prominent market in the region, representing around 20% of the total market share. The country’s strong vegetarian population and rising awareness about sustainable food sources present significant opportunities for pea protein. As the demand for plant-based foods rises among the urban middle class, pea protein is being increasingly incorporated into various food products, such as meat substitutes, dairy alternatives, and protein supplements. The growing trend of health and fitness, particularly among younger demographics, is further boosting the adoption of pea protein in India.
Southeast Asia
Southeast Asia, including countries like Indonesia, Malaysia, and Thailand, holds a growing share of the market, estimated at 15%. The region’s expanding middle class, along with increasing awareness of healthy and sustainable eating, is driving the demand for plant-based proteins. These markets are increasingly adopting plant-based diets due to the rising concerns about health issues, including obesity and heart disease. As more consumers turn to plant-based protein options, pea protein has become a favorable alternative in food and beverage applications, particularly in snacks and ready-to-eat meals.
Australia and New Zealand
Australia and New Zealand represent a combined market share of approximately 25%. These countries have well-established markets for plant-based proteins, driven by high consumer awareness and a strong preference for sustainable and ethical food choices. Both markets are mature, with a high penetration of plant-based products in supermarkets and retail outlets. The demand for pea protein in these countries is concentrated in food and beverages, particularly in protein supplements, dairy alternatives, and meat substitutes. The increasing popularity of vegan and vegetarian diets, alongside the growth of the wellness industry, supports the steady expansion of the pea protein market in these regions.
Rest of Asia
Other regions in Asia, including Japan and South Korea, account for the remaining market share, which is around 10%. Japan’s aging population and increasing health concerns are influencing consumer preferences towards plant-based protein sources. Similarly, South Korea is witnessing a rise in plant-based food adoption, particularly in major urban centers, driven by younger consumers seeking healthier, more sustainable food options.
Key Player Analysis:
- Shandong Jianyuan Group
- Fenchem Biotek Ltd.
- Ingredion Incorporated
- Roquette Frères
- Yantai Shuangta Food Co., Ltd.
- ET Chem
- Cargill, Inc.
- DuPont (IFF)
- Nutraonly (Xi’an) Nutritions Inc
- Burcon NutraScience Corporation
Competitive Analysis:
The Asia Pacific pea proteins market is highly competitive, with a mix of established players and emerging companies vying for market share. Key global players such as Roquette Frères, Cargill, and DuPont dominate the market with their extensive product portfolios and established distribution networks. These companies leverage strong research and development capabilities to innovate and expand the applications of pea protein in food, beverages, and nutraceuticals. Regional players, including The Green Labs and Pristine, are also gaining traction by focusing on local production and customized products tailored to regional dietary preferences. The competition is intensifying as companies explore new processing technologies to improve product functionality and reduce production costs. Strategic partnerships, mergers, and acquisitions are common, as companies aim to expand their geographic reach and enhance their market position. Overall, the market remains dynamic, with continuous innovation and sustainability efforts driving competition.
Recent Developments:
- In February 2024, Roquette Frères expanded its NUTRALYS® plant protein portfolio by launching four new pea protein ingredients: NUTRALYS® Pea F853M (isolate), NUTRALYS® H85 (hydrolysate), NUTRALYS® T Pea 700FL (textured) and NUTRALYS® T Pea 700M (textured). These new products are designed to improve taste, texture and creativity in plant-based food and high-protein nutritional products.
- In January 2023, Roquette Frères announced an investment in DAIZ Inc., a Japanese food tech startup that has developed breakthrough technology utilizing germination of plant seeds combined with an extrusion process to enhance texture, flavor and nutritional profile for plant-based foods. This partnership aims to meet rising global demand for innovative and sustainable plant-based ingredients.
- In November 2024, Ingredion Incorporated and Lantmännen announced a new long-term collaboration to accelerate the development of plant-based proteins. As part of this partnership, Lantmännen will invest more than 100 million euros in a state-of-the-art factory in Sweden, while collaborating with Ingredion to develop a differentiated portfolio of plant-based protein isolates based on yellow peas.
- In December 2022, Royal DSM introduced Vertis, an innovative textured pea canola protein containing all nine essential amino acids needed for a complete protein. This groundbreaking plant protein offers distinct textural benefits while being soy-free, gluten-free, and dairy-free.
Market Concentration & Characteristics:
The Asia Pacific pea proteins market exhibits a moderate level of concentration, characterized by the presence of both global industry leaders and regional players. Major international companies such as Roquette Frères, Cargill, and DuPont hold significant market shares, leveraging their extensive resources and established distribution networks. These corporations often lead in innovation, product development, and global supply chain management. However, regional firms are increasingly gaining traction by focusing on local production, catering to specific consumer preferences, and offering cost-effective solutions. This dynamic creates a competitive landscape where both established and emerging companies contribute to market growth and diversification. The market is characterized by a diverse product range, including pea protein isolates, concentrates, and textured proteins, each serving distinct applications across food and beverages, nutraceuticals, animal feed, and personal care sectors. Isolates dominate the market due to their high protein content and versatility, particularly in premium products. Concentrates offer a cost-effective alternative, widely used in animal feed and various food applications. Textured pea proteins are gaining popularity in meat analogs, reflecting the growing demand for plant-based meat substitutes. This segmentation allows companies to target specific niches and cater to the evolving preferences of health-conscious and environmentally aware consumers.
Shape Your Report to Specific Countries or Regions & Enjoy 30% Off!
Report Coverage:
The research report offers an in-depth analysis based on Type, Application, Form and Distribution Channel. It details leading market players, providing an overview of their business, product offerings, investments, revenue streams, and key applications. Additionally, the report includes insights into the competitive environment, SWOT analysis, current market trends, as well as the primary drivers and constraints. Furthermore, it discusses various factors that have driven market expansion in recent years. The report also explores market dynamics, regulatory scenarios, and technological advancements that are shaping the industry. It assesses the impact of external factors and global economic changes on market growth. Lastly, it provides strategic recommendations for new entrants and established companies to navigate the complexities of the market.
Future Outlook:
- The Asia Pacific pea protein market is poised for continued growth, driven by increasing demand for plant-based alternatives.
- Rising health and environmental concerns will push more consumers towards plant-based diets, expanding the market.
- Advances in pea protein extraction technology will enhance product quality while lowering production costs.
- Southeast Asia will emerge as a key growth area, fueled by increasing disposable incomes and a shift towards healthier eating habits.
- The growing popularity of plant-based meat substitutes and dairy alternatives will remain a major driver of market expansion.
- Efforts to raise consumer awareness about the nutritional benefits of pea protein will help broaden its market acceptance.
- Ongoing investments in research and development will lead to new and innovative applications of pea protein.
- Regional players will capture a larger share of the market by offering locally tailored, cost-effective solutions.
- The emphasis on sustainability and eco-friendly food options will enhance pea protein’s appeal to environmentally conscious consumers.
- Strategic partnerships between manufacturers and distributors will strengthen distribution channels across the region.


