CHAPTER NO. 1 : INTRODUCTION 26
1.1.1. Report Description 26
Purpose of the Report 26
USP & Key Offerings 26
1.1.2. Key Benefits for Stakeholders 26
1.1.3. Target Audience 27
1.1.4. Report Scope 27
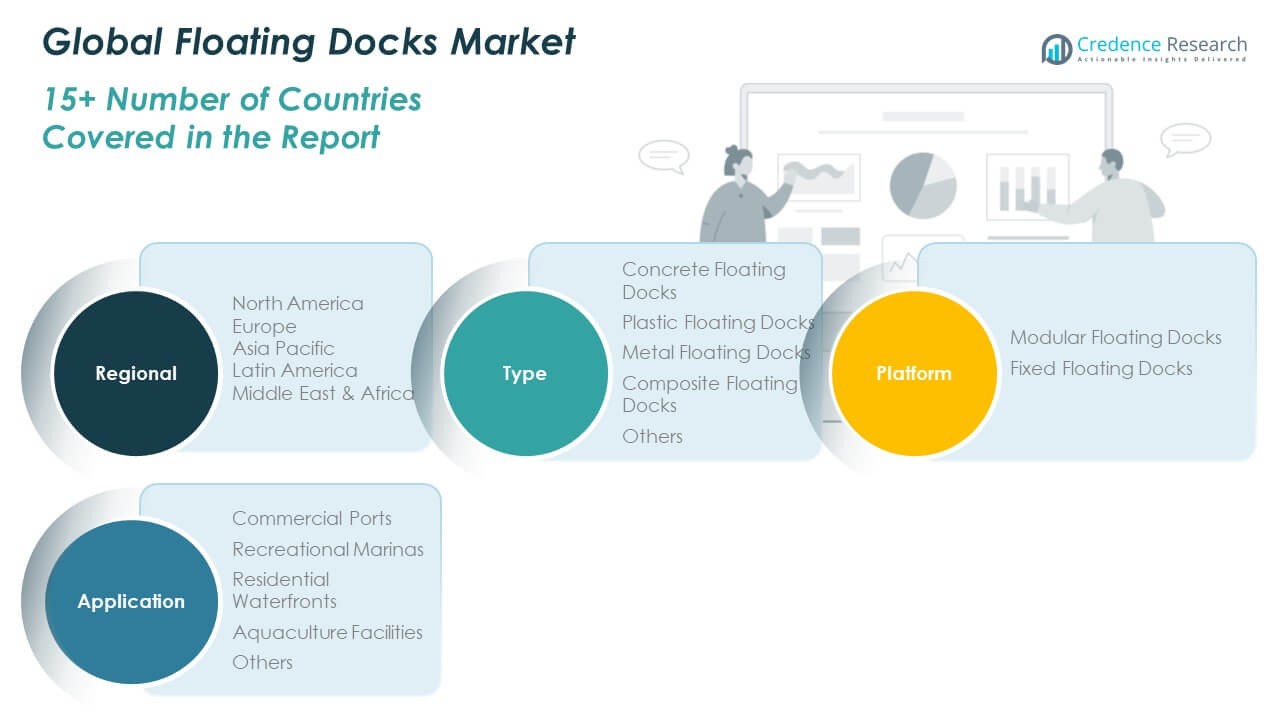
1.1.5. Regional Scope 28
CHAPTER NO. 2 : EXECUTIVE SUMMARY 29
2.1. Floating Docks Market Snapshot 29
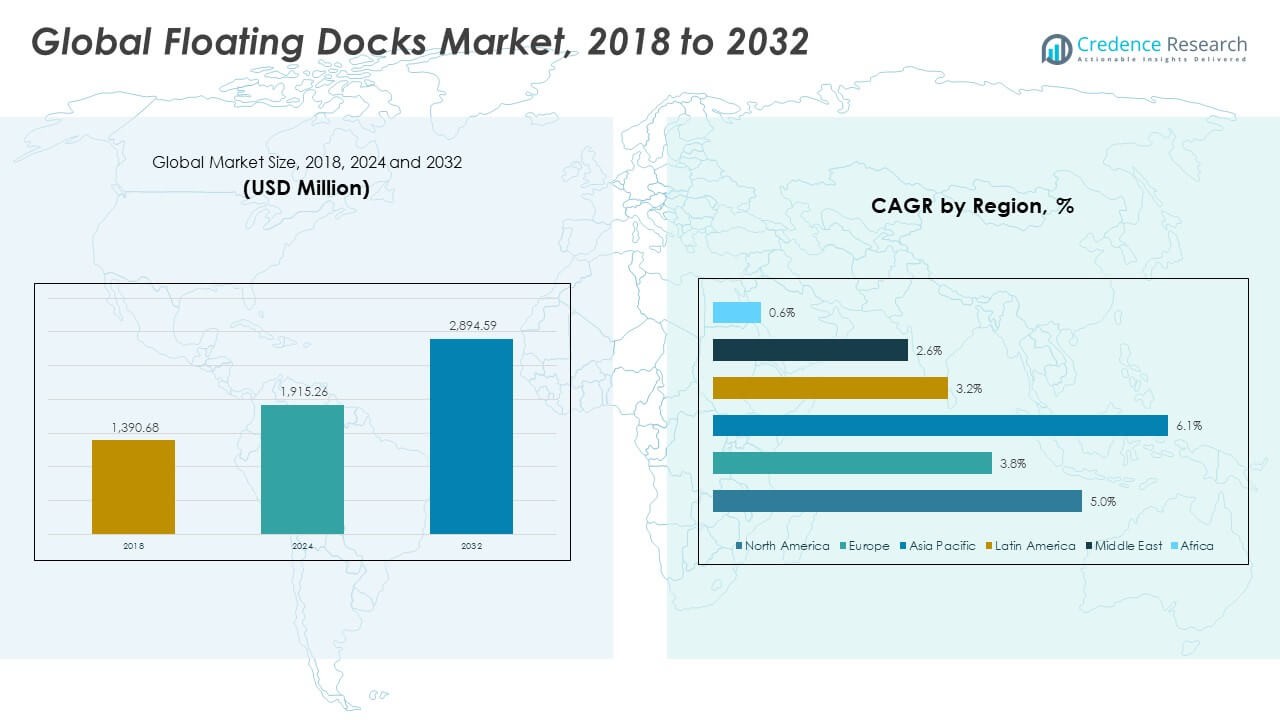
2.1.1. Global Floating Docks Market, 2018 – 2032 (Units) (USD Million) 31
2.2. Insights from Primary Respondents 31
CHAPTER NO. 3 : GEOPOLITICAL CRISIS IMPACT ANALYSIS 32
3.1. Russia-Ukraine and Israel-Palestine War Impacts 32
CHAPTER NO. 4 : FLOATING DOCKS MARKET – INDUSTRY ANALYSIS 33
4.1. Introduction 33
4.2. Market Drivers 34
4.2.1. Growing Maritime Trade and Port Expansion 34
4.2.2. Rising Popularity of Recreational Boating and Marinas 35
4.3. Market Restraints 36
4.3.1. High Initial Investment and Maintenance Costs 36
4.4. Market Opportunities 37
4.4.1. Market Opportunity Analysis 37
4.5. Porter’s Five Forces Analysis 38
4.6. Value Chain Analysis 39
4.7. Buying Criteria 40
CHAPTER NO. 5 : PRICE ANALYSIS 41
5.1. Price Analysis by Region 41
5.1.1. Global Floating Docks Market Price, By Region, 2018 – 2023 41
5.1.2. Global Type Market Price, By Region, 2018 – 2023 41
5.2. Price Analysis by Type 42
5.2.1. Global Floating Docks Market Price, By Type, 2018 – 2023 42
5.2.2. Global Type Market Price, By Type, 2018 – 2023 42
CHAPTER NO. 6 : ANALYSIS COMPETITIVE LANDSCAPE 43
6.1. Company Market Share Analysis – 2024 43
6.1.1. Global Floating Docks Market: Company Market Share, by Volume, 2024 43
6.1.2. Global Floating Docks Market: Company Market Share, by Revenue, 2024 44
6.1.3. Global Floating Docks Market: Top 6 Company Market Share, by Revenue, 2024 44
6.1.4. Global Floating Docks Market: Top 3 Company Market Share, by Revenue, 2024 45
6.2. Global Floating Docks Market Company Volume Market Share, 2024 46
6.3. Global Floating Docks Market Company Revenue Market Share, 2024 47
6.4. Company Assessment Metrics, 2024 48
6.4.1. Stars 48
6.4.2. Emerging Leaders 48
6.4.3. Pervasive Players 48
6.4.4. Participants 48
6.5. Start-ups /SMEs Assessment Metrics, 2024 48
6.5.1. Progressive Companies 48
6.5.2. Responsive Companies 48
6.5.3. Dynamic Companies 48
6.5.4. Starting Blocks 48
6.6. Strategic Developments 49
6.6.1. Acquisitions & Mergers 49
New Product Launch 49
Regional Expansion 49
6.7. Key Players Product Matrix 50
CHAPTER NO. 7 : PESTEL & ADJACENT MARKET ANALYSIS 51
7.1. PESTEL 51
7.1.1. Political Factors 51
7.1.2. Economic Factors 51
7.1.3. Social Factors 51
7.1.4. Technological Factors 51
7.1.5. Environmental Factors 51
7.1.6. Legal Factors 51
7.2. Adjacent Market Analysis 51
CHAPTER NO. 8 : FLOATING DOCKS MARKET – BY TYPE SEGMENT ANALYSIS 52
8.1. Floating Docks Market Overview, by Type Segment 52
8.1.1. Floating Docks Market Volume Share, By Type, 2023 & 2032 53
8.1.2. Floating Docks Market Revenue Share, By Type, 2023 & 2032 53
8.1.3. Floating Docks Market Attractiveness Analysis, By Type 54
8.1.4. Incremental Revenue Growth Opportunity, by Type, 2024 – 2032 54
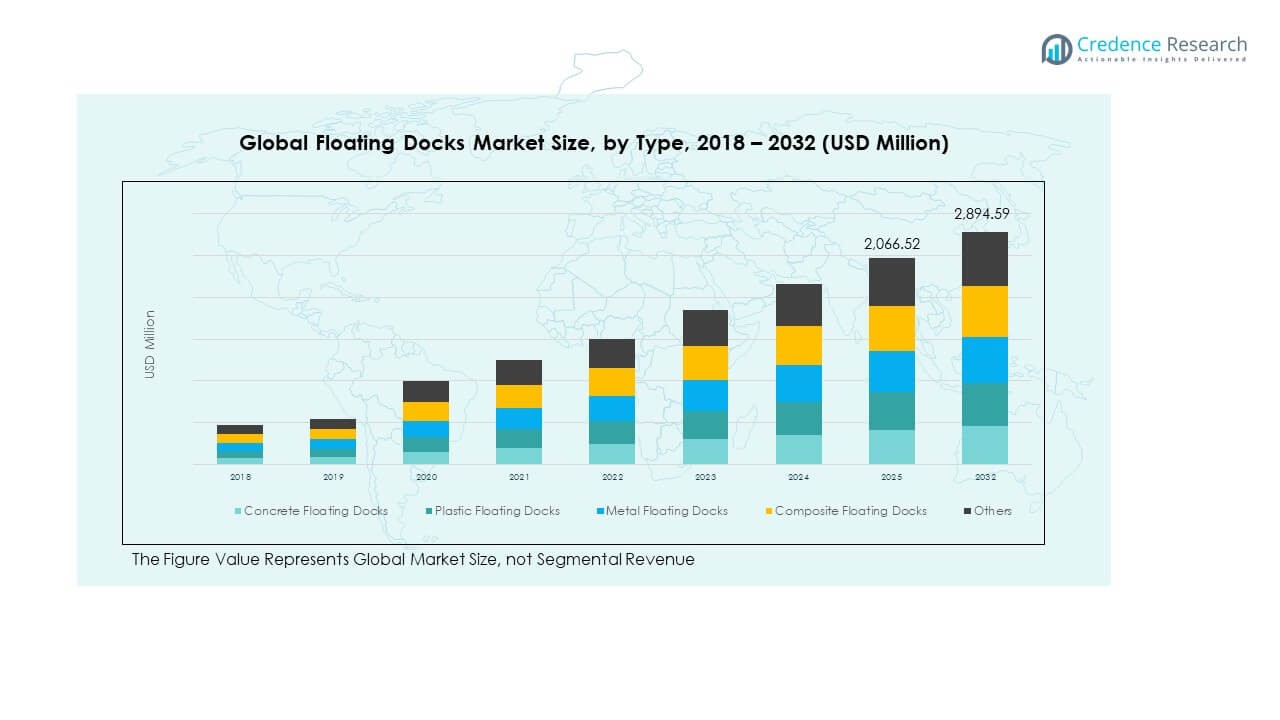
8.1.5. Floating Docks Market Revenue, By Type, 2018, 2023, 2027 & 2032 55
8.2. Concrete Floating Docks 56
8.3. Plastic Floating Docks 57
8.4. Metal Floating Docks 58
8.5. Composite Floating Docks 59
8.6. Others 60
CHAPTER NO. 9 : FLOATING DOCKS MARKET – BY PLATFORM SEGMENT ANALYSIS 61
9.1. Floating Docks Market Overview, by Platform Segment 61
9.1.1. Floating Docks Market Volume Share, By Platform, 2023 & 2032 62
9.1.2. Floating Docks Market Revenue Share, By Platform, 2023 & 2032 62
9.1.3. Floating Docks Market Attractiveness Analysis, By Platform 63
9.1.4. Incremental Revenue Growth Opportunity, by Platform, 2024 – 2032 63
9.1.5. Floating Docks Market Revenue, By Platform, 2018, 2023, 2027 & 2032 64
9.2. Modular Floating Docks 65
9.3. Fixed Floating Docks 66
CHAPTER NO. 10 : FLOATING DOCKS MARKET – BY APPLICATION SEGMENT ANALYSIS 67
10.1. Floating Docks Market Overview, by Application Segment 67
10.1.1. Floating Docks Market Volume Share, By Application, 2023 & 2032 68
10.1.2. Floating Docks Market Revenue Share, By Application, 2023 & 2032 68
10.1.3. Floating Docks Market Attractiveness Analysis, By Application 69
10.1.4. Incremental Revenue Growth Opportunity, by Application, 2024 – 2032 69
10.1.5. Floating Docks Market Revenue, By Application, 2018, 2023, 2027 & 2032 70
10.2. Commercial Ports 71
10.3. Recreational Marinas 72
10.4. Residential Waterfronts 73
10.5. Aquaculture Facilities 74
10.6. Others 75
CHAPTER NO. 11 : FLOATING DOCKS MARKET – REGIONAL ANALYSIS 76
11.1. Floating Docks Market Overview, by Regional Segments 76
11.2. Region 77
11.2.1. Global Floating Docks Market Volume Share, By Region, 2023 & 2032 77
11.2.2. Global Floating Docks Market Revenue Share, By Region, 2023 & 2032 77
11.2.3. Floating Docks Market Attractiveness Analysis, By Region 78
11.2.4. Incremental Revenue Growth Opportunity, by Region, 2024 – 2032 78
11.2.5. Floating Docks Market Revenue, By Region, 2018, 2023, 2027 & 2032 79
11.2.6. Global Floating Docks Market Volume & Revenue, By Region, 2018 – 2023 (Units) (USD Million) 80
11.2.7. Global Floating Docks Market Volume & Revenue, By Region, 2024 – 2032 (Units) (USD Million) 80
11.3. Type 81
11.3.1. Global Floating Docks Market Volume & Revenue, By Type, 2018 – 2023 (Units) (USD Million) 81
11.4. Global Floating Docks Market Volume & Revenue, By Type, 2024 – 2032 (Units) (USD Million) 81
11.5. Platform 82
11.5.1. Global Floating Docks Market Volume & Revenue, By Platform, 2018 – 2023 (Units) (USD Million) 82
11.5.2. Global Floating Docks Market Volume & Revenue, By Platform, 2024 – 2032 (Units) (USD Million) 82
11.6. Application 83
11.6.1. Global Floating Docks Market Volume & Revenue, By Application, 2018 – 2023 (Units) (USD Million) 83
11.6.2. Global Floating Docks Market Volume & Revenue, By Application, 2024 – 2032 (Units) (USD Million) 83
CHAPTER NO. 12 : FLOATING DOCKS MARKET – NORTH AMERICA 84
12.1. North America 84
12.1.1. Key Highlights 84
12.1.2. North America Floating Docks Market Volume, By Country, 2018 – 2032 (Units) 85
12.1.3. North America Floating Docks Market Revenue, By Country, 2018 – 2023 (USD Million) 86
12.1.4. North America Floating Docks Market Volume, By Type, 2018 – 2023 (Units) 87
12.1.5. North America Floating Docks Market Revenue, By Type, 2018 – 2023 (USD Million) 88
12.1.6. North America Floating Docks Market Volume, By Platform, 2018 – 2023 (Units) 89
12.1.7. North America Floating Docks Market Revenue, By Platform, 2018 – 2023 (USD Million) 90
12.1.8. North America Floating Docks Market Volume, By Application, 2018 – 2023 (Units) 91
12.1.9. North America Floating Docks Market Revenue, By Application, 2018 – 2023 (USD Million) 92
12.2. U.S. 93
12.3. Canada 93
12.4. Mexico 93
CHAPTER NO. 13 : FLOATING DOCKS MARKET – EUROPE 94
13.1. Europe 94
13.1.1. Key Highlights 94
13.1.2. Europe Floating Docks Market Volume, By Country, 2018 – 2032 (Units) 95
13.1.3. Europe Floating Docks Market Revenue, By Country, 2018 – 2023 (USD Million) 96
13.1.4. Europe Floating Docks Market Volume, By Type, 2018 – 2023 (Units) 97
13.1.5. Europe Floating Docks Market Revenue, By Type, 2018 – 2023 (USD Million) 98
13.1.6. Europe Floating Docks Market Volume, By Platform, 2018 – 2023 (Units) 99
13.1.7. Europe Floating Docks Market Revenue, By Platform, 2018 – 2023 (USD Million) 100
13.1.8. Europe Floating Docks Market Volume, By Application, 2018 – 2023 (Units) 101
13.1.9. Europe Floating Docks Market Revenue, By Application, 2018 – 2023 (USD Million) 102
13.2. UK 103
13.3. France 103
13.4. Germany 103
13.5. Italy 103
13.6. Spain 103
13.7. Russia 103
13.8. Belgium 103
13.9. Netherland 103
13.10. Austria 103
13.11. Sweden 103
13.12. Poland 103
13.13. Denmark 103
13.14. Switzerland 103
13.15. Rest of Europe 103
CHAPTER NO. 14 : FLOATING DOCKS MARKET – ASIA PACIFIC 104
14.1. Asia Pacific 104
14.1.1. Key Highlights 104
14.1.2. Asia Pacific Floating Docks Market Volume, By Country, 2018 – 2032 (Units) 105
14.1.3. Asia Pacific Floating Docks Market Revenue, By Country, 2018 – 2023 (USD Million) 106
14.1.4. Asia Pacific Floating Docks Market Volume, By Type, 2018 – 2023 (Units) 107
14.1.5. Asia Pacific Floating Docks Market Revenue, By Type, 2018 – 2023 (USD Million) 108
14.1.6. Asia Pacific Floating Docks Market Volume, By Platform, 2018 – 2023 (Units) 109
14.1.7. Asia Pacific Floating Docks Market Revenue, By Platform, 2018 – 2023 (USD Million) 110
14.1.8. Asia Pacific Floating Docks Market Volume, By Application, 2018 – 2023 (Units) 111
14.1.9. Asia Pacific Floating Docks Market Revenue, By Application, 2018 – 2023 (USD Million) 112
14.2. China 113
14.3. Japan 113
14.4. South Korea 113
14.5. India 113
14.6. Australia 113
14.7. Thailand 113
14.8. Indonesia 113
14.9. Vietnam 113
14.10. Malaysia 113
14.11. Philippines 113
14.12. Taiwan 113
14.13. Rest of Asia Pacific 113
CHAPTER NO. 15 : FLOATING DOCKS MARKET – LATIN AMERICA 114
15.1. Latin America 114
15.1.1. Key Highlights 114
15.1.2. Latin America Floating Docks Market Volume, By Country, 2018 – 2032 (Units) 115
15.1.3. Latin America Floating Docks Market Revenue, By Country, 2018 – 2023 (USD Million) 116
15.1.4. Latin America Floating Docks Market Volume, By Type, 2018 – 2023 (Units) 117
15.1.5. Latin America Floating Docks Market Revenue, By Type, 2018 – 2023 (USD Million) 118
15.1.6. Latin America Floating Docks Market Volume, By Platform, 2018 – 2023 (Units) 119
15.1.7. Latin America Floating Docks Market Revenue, By Platform, 2018 – 2023 (USD Million) 120
15.1.8. Latin America Floating Docks Market Volume, By Application, 2018 – 2023 (Units) 121
15.1.9. Latin America Floating Docks Market Revenue, By Application, 2018 – 2023 (USD Million) 122
15.2. Brazil 123
15.3. Argentina 123
15.4. Peru 123
15.5. Chile 123
15.6. Colombia 123
15.7. Rest of Latin America 123
CHAPTER NO. 16 : FLOATING DOCKS MARKET – MIDDLE EAST 124
16.1. Middle East 124
16.1.1. Key Highlights 124
16.1.2. Middle East Floating Docks Market Volume, By Country, 2018 – 2032 (Units) 125
16.1.3. Middle East Floating Docks Market Revenue, By Country, 2018 – 2023 (USD Million) 126
16.1.4. Middle East Floating Docks Market Volume, By Type, 2018 – 2023 (Units) 127
16.1.5. Middle East Floating Docks Market Revenue, By Type, 2018 – 2023 (USD Million) 128
16.1.6. Middle East Floating Docks Market Volume, By Platform, 2018 – 2023 (Units) 129
16.1.7. Middle East Floating Docks Market Revenue, By Platform, 2018 – 2023 (USD Million) 130
16.1.8. Middle East Floating Docks Market Volume, By Application, 2018 – 2023 (Units) 131
16.1.9. Middle East Floating Docks Market Revenue, By Application, 2018 – 2023 (USD Million) 132
16.2. UAE 133
16.3. KSA 133
16.4. Israel 133
16.5. Turkey 133
16.6. Iran 133
16.7. Rest of Middle East 133
CHAPTER NO. 17 : FLOATING DOCKS MARKET – AFRICA 134
17.1. Africa 134
17.1.1. Key Highlights 134
17.1.2. Africa Floating Docks Market Volume, By Country, 2018 – 2032 (Units) 135
17.1.3. Africa Floating Docks Market Revenue, By Country, 2018 – 2023 (USD Million) 136
17.1.4. Africa Floating Docks Market Volume, By Type, 2018 – 2023 (Units) 137
17.1.5. Africa Floating Docks Market Revenue, By Type, 2018 – 2023 (USD Million) 138
17.1.6. Africa Floating Docks Market Volume, By Platform, 2018 – 2023 (Units) 139
17.1.7. Africa Floating Docks Market Revenue, By Platform, 2018 – 2023 (USD Million) 140
17.1.8. Africa Floating Docks Market Volume, By Application, 2018 – 2023 (Units) 141
17.1.9. Africa Floating Docks Market Revenue, By Application, 2018 – 2023 (USD Million) 142
17.2. Egypt 143
17.3. Nigeria 143
17.4. Algeria 143
17.5. Morocco 143
17.6. Rest of Africa 143
CHAPTER NO. 18 : COMPANY PROFILES 144
18.1. Fairport Marine 144
18.1.1. Company Overview 144
18.1.2. Product Portfolio 144
18.1.3. Swot Analysis 144
18.1.4. Business Strategy 145
18.1.5. Financial Overview 145
18.2. EZ Dock 146
18.3. Bellingham Marine 146
18.4. SFC Marine 146
18.5. Marinetek 146
18.6. Stoney Point Marine 146
18.7. Lockdock 146
18.8. Company 8 146
18.9. Company 9 146
18.10. Company 10 146
18.11. Company 11 146
18.12. Company 12 146
18.13. Company 13 146
18.14. Company 14 146
List of Figures
FIG NO. 1. Global Floating Docks Market Volume & Revenue, 2018 – 2032 (Units) (USD Million) 31
FIG NO. 2. Porter’s Five Forces Analysis for Global Floating Docks Market 38
FIG NO. 3. Value Chain Analysis for Global Floating Docks Market 39
FIG NO. 4. Global Floating Docks Market Price, By Region, 2018 – 2023 41
FIG NO. 5. Global Floating Docks Market Price, By Type, 2018 – 2023 42
FIG NO. 6. Company Share Analysis, 2024 43
FIG NO. 7. Company Share Analysis, 2024 44
FIG NO. 8. Company Share Analysis, 2024 44
FIG NO. 9. Company Share Analysis, 2024 45
FIG NO. 10. Floating Docks Market – Company Volume Market Share, 2024 46
FIG NO. 11. Floating Docks Market – Company Revenue Market Share, 2024 47
FIG NO. 12. Floating Docks Market Volume Share, By Type, 2023 & 2032 53
FIG NO. 13. Floating Docks Market Revenue Share, By Type, 2023 & 2032 53
FIG NO. 14. Market Attractiveness Analysis, By Type 54
FIG NO. 15. Incremental Revenue Growth Opportunity by Type, 2024 – 2032 54
FIG NO. 16. Floating Docks Market Revenue, By Type, 2018, 2023, 2027 & 2032 55
FIG NO. 17. Global Floating Docks Market for Concrete Floating Docks, Volume & Revenue (Units) (USD Million) 2018 – 2032 56
FIG NO. 18. Global Floating Docks Market for Plastic Floating Docks, Volume & Revenue (Units) (USD Million) 2018 – 2032 57
FIG NO. 19. Global Floating Docks Market for Metal Floating Docks, Volume & Revenue (Units) (USD Million) 2018 – 2032 58
FIG NO. 20. Global Floating Docks Market for Composite Floating Docks, Volume & Revenue (Units) (USD Million) 2018 – 2032 59
FIG NO. 21. Global Floating Docks Market for Others, Volume & Revenue (Units) (USD Million) 2018 – 2032 60
FIG NO. 22. Floating Docks Market Volume Share, By Platform, 2023 & 2032 62
FIG NO. 23. Floating Docks Market Revenue Share, By Platform, 2023 & 2032 62
FIG NO. 24. Market Attractiveness Analysis, By Platform 63
FIG NO. 25. Incremental Revenue Growth Opportunity by Platform, 2024 – 2032 63
FIG NO. 26. Floating Docks Market Revenue, By Platform, 2018, 2023, 2027 & 2032 64
FIG NO. 27. Global Floating Docks Market for Modular Floating Docks, Volume & Revenue (Units) (USD Million) 2018 – 2032 65
FIG NO. 28. Global Floating Docks Market for Fixed Floating Docks, Volume & Revenue (Units) (USD Million) 2018 – 2032 66
FIG NO. 29. Floating Docks Market Volume Share, By Application, 2023 & 2032 68
FIG NO. 30. Floating Docks Market Revenue Share, By Application, 2023 & 2032 68
FIG NO. 31. Market Attractiveness Analysis, By Application 69
FIG NO. 32. Incremental Revenue Growth Opportunity by Application, 2024 – 2032 69
FIG NO. 33. Floating Docks Market Revenue, By Application, 2018, 2023, 2027 & 2032 70
FIG NO. 34. Global Floating Docks Market for Commercial Ports, Volume & Revenue (Units) (USD Million) 2018 – 2032 71
FIG NO. 35. Global Floating Docks Market for Recreational Marinas, Volume & Revenue (Units) (USD Million) 2018 – 2032 72
FIG NO. 36. Global Floating Docks Market for Residential Waterfronts, Volume & Revenue (Units) (USD Million) 2018 – 2032 73
FIG NO. 37. Global Floating Docks Market for Aquaculture Facilities, Volume & Revenue (Units) (USD Million) 2018 – 2032 74
FIG NO. 38. Global Floating Docks Market for Others, Volume & Revenue (Units) (USD Million) 2018 – 2032 75
FIG NO. 39. Global Floating Docks Market Volume Share, By Region, 2023 & 2032 77
FIG NO. 40. Global Floating Docks Market Revenue Share, By Region, 2023 & 2032 77
FIG NO. 41. Market Attractiveness Analysis, By Region 78
FIG NO. 42. Incremental Revenue Growth Opportunity by Region, 2024 – 2032 78
FIG NO. 43. Floating Docks Market Revenue, By Region, 2018, 2023, 2027 & 2032 79
FIG NO. 44. North America Floating Docks Market Volume & Revenue, 2018 – 2032 (Units) (USD Million) 84
FIG NO. 45. Europe Floating Docks Market Volume & Revenue, 2018 – 2032 (Units) (USD Million) 94
FIG NO. 46. Asia Pacific Floating Docks Market Volume & Revenue, 2018 – 2032 (Units) (USD Million) 104
FIG NO. 47. Latin America Floating Docks Market Volume & Revenue, 2018 – 2032 (Units) (USD Million) 114
FIG NO. 48. Middle East Floating Docks Market Volume & Revenue, 2018 – 2032 (Units) (USD Million) 124
FIG NO. 49. Africa Floating Docks Market Volume & Revenue, 2018 – 2032 (Units) (USD Million) 134
List of Tables
TABLE NO. 1. : Global Floating Docks Market: Snapshot 27
TABLE NO. 2. : Drivers for the Floating Docks Market: Impact Analysis 32
TABLE NO. 3. : Restraints for the Floating Docks Market: Impact Analysis 34
TABLE NO. 4. : Global Floating Docks Market Volume & Revenue, By Region, 2018 – 2023 39
TABLE NO. 5. : Global Floating Docks Market Volume & Revenue, By Type, 2018 – 2023 40
TABLE NO. 6. : Global Floating Docks Market Volume & Revenue, By Region, 2018 – 2023 (Units) (USD Million) 78
TABLE NO. 7. : Global Floating Docks Market Volume & Revenue, By Region, 2024 – 2032 (Units) (USD Million) 78
TABLE NO. 8. : Global Floating Docks Market Volume & Revenue, By Type, 2018 – 2023 (Units) (USD Million) 79
TABLE NO. 9. : Global Floating Docks Market Volume & Revenue, By Type, 2024 – 2032 (Units) (USD Million) 79
TABLE NO. 10. : Global Floating Docks Market Volume & Revenue, By Platform, 2018 – 2023 (Units) (USD Million) 80
TABLE NO. 11. : Global Floating Docks Market Volume & Revenue, By Platform, 2024 – 2032 (Units) (USD Million) 80
TABLE NO. 12. : Global Floating Docks Market Volume & Revenue, By Application, 2018 – 2023 (Units) (USD Million) 81
TABLE NO. 13. : Global Floating Docks Market Volume & Revenue, By Application, 2024 – 2032 (Units) (USD Million) 81
TABLE NO. 14. : North America Floating Docks Market Volume, By Country, 2018 – 2023 (Units) 83
TABLE NO. 15. : North America Floating Docks Market Volume, By Country, 2024 – 2032 (Units) 83
TABLE NO. 16. : North America Floating Docks Market Revenue, By Country, 2018 – 2023 (USD Million) 84
TABLE NO. 17. : North America Floating Docks Market Revenue, By Country, 2024 – 2032 (USD Million) 84
TABLE NO. 18. : North America Floating Docks Market Volume, By Type, 2018 – 2023 (Units) 85
TABLE NO. 19. : North America Floating Docks Market Volume, By Type, 2024 – 2032 (Units) 85
TABLE NO. 20. : North America Floating Docks Market Revenue, By Type, 2018 – 2023 (USD Million) 86
TABLE NO. 21. : North America Floating Docks Market Revenue, By Type, 2024 – 2032 (USD Million) 86
TABLE NO. 22. : North America Floating Docks Market Volume, By Platform, 2018 – 2023 (Units) 87
TABLE NO. 23. : North America Floating Docks Market Volume, By Platform, 2024 – 2032 (Units) 87
TABLE NO. 24. : North America Floating Docks Market Revenue, By Platform, 2018 – 2023 (USD Million) 88
TABLE NO. 25. : North America Floating Docks Market Revenue, By Platform, 2024 – 2032 (USD Million) 88
TABLE NO. 26. : North America Floating Docks Market Volume, By Application, 2018 – 2023 (Units) 89
TABLE NO. 27. : North America Floating Docks Market Volume, By Application, 2024 – 2032 (Units) 89
TABLE NO. 28. : North America Floating Docks Market Revenue, By Application, 2018 – 2023 (USD Million) 90
TABLE NO. 29. : North America Floating Docks Market Revenue, By Application, 2024 – 2032 (USD Million) 90
TABLE NO. 30. : Europe Floating Docks Market Volume, By Country, 2018 – 2023 (Units) 93
TABLE NO. 31. : Europe Floating Docks Market Volume, By Country, 2024 – 2032 (Units) 93
TABLE NO. 32. : Europe Floating Docks Market Revenue, By Country, 2018 – 2023 (USD Million) 94
TABLE NO. 33. : Europe Floating Docks Market Revenue, By Country, 2024 – 2032 (USD Million) 94
TABLE NO. 34. : Europe Floating Docks Market Volume, By Type, 2018 – 2023 (Units) 95
TABLE NO. 35. : Europe Floating Docks Market Volume, By Type, 2024 – 2032 (Units) 95
TABLE NO. 36. : Europe Floating Docks Market Revenue, By Type, 2018 – 2023 (USD Million) 96
TABLE NO. 37. : Europe Floating Docks Market Revenue, By Type, 2024 – 2032 (USD Million) 96
TABLE NO. 38. : Europe Floating Docks Market Volume, By Platform, 2018 – 2023 (Units) 97
TABLE NO. 39. : Europe Floating Docks Market Volume, By Platform, 2024 – 2032 (Units) 97
TABLE NO. 40. : Europe Floating Docks Market Revenue, By Platform, 2018 – 2023 (USD Million) 98
TABLE NO. 41. : Europe Floating Docks Market Revenue, By Platform, 2024 – 2032 (USD Million) 98
TABLE NO. 42. : Europe Floating Docks Market Volume, By Application, 2018 – 2023 (Units) 99
TABLE NO. 43. : Europe Floating Docks Market Volume, By Application, 2024 – 2032 (Units) 99
TABLE NO. 44. : Europe Floating Docks Market Revenue, By Application, 2018 – 2023 (USD Million) 100
TABLE NO. 45. : Europe Floating Docks Market Revenue, By Application, 2024 – 2032 (USD Million) 100
TABLE NO. 46. : Asia Pacific Floating Docks Market Volume, By Country, 2018 – 2023 (Units) 103
TABLE NO. 47. : Asia Pacific Floating Docks Market Volume, By Country, 2024 – 2032 (Units) 103
TABLE NO. 48. : Asia Pacific Floating Docks Market Revenue, By Country, 2018 – 2023 (USD Million) 104
TABLE NO. 49. : Asia Pacific Floating Docks Market Revenue, By Country, 2024 – 2032 (USD Million) 104
TABLE NO. 50. : Asia Pacific Floating Docks Market Volume, By Type, 2018 – 2023 (Units) 105
TABLE NO. 51. : Asia Pacific Floating Docks Market Volume, By Type, 2024 – 2032 (Units) 105
TABLE NO. 52. : Asia Pacific Floating Docks Market Revenue, By Type, 2018 – 2023 (USD Million) 106
TABLE NO. 53. : Asia Pacific Floating Docks Market Revenue, By Type, 2024 – 2032 (USD Million) 106
TABLE NO. 54. : Asia Pacific Floating Docks Market Volume, By Platform, 2018 – 2023 (Units) 107
TABLE NO. 55. : Asia Pacific Floating Docks Market Volume, By Platform, 2024 – 2032 (Units) 107
TABLE NO. 56. : Asia Pacific Floating Docks Market Revenue, By Platform, 2018 – 2023 (USD Million) 108
TABLE NO. 57. : Asia Pacific Floating Docks Market Revenue, By Platform, 2024 – 2032 (USD Million) 108
TABLE NO. 58. : Asia Pacific Floating Docks Market Volume, By Application, 2018 – 2023 (Units) 109
TABLE NO. 59. : Asia Pacific Floating Docks Market Volume, By Application, 2024 – 2032 (Units) 109
TABLE NO. 60. : Asia Pacific Floating Docks Market Revenue, By Application, 2018 – 2023 (USD Million) 110
TABLE NO. 61. : Asia Pacific Floating Docks Market Revenue, By Application, 2024 – 2032 (USD Million) 110
TABLE NO. 62. : Latin America Floating Docks Market Volume, By Country, 2018 – 2023 (Units) 113
TABLE NO. 63. : Latin America Floating Docks Market Volume, By Country, 2024 – 2032 (Units) 113
TABLE NO. 64. : Latin America Floating Docks Market Revenue, By Country, 2018 – 2023 (USD Million) 114
TABLE NO. 65. : Latin America Floating Docks Market Revenue, By Country, 2024 – 2032 (USD Million) 114
TABLE NO. 66. : Latin America Floating Docks Market Volume, By Type, 2018 – 2023 (Units) 115
TABLE NO. 67. : Latin America Floating Docks Market Volume, By Type, 2024 – 2032 (Units) 115
TABLE NO. 68. : Latin America Floating Docks Market Revenue, By Type, 2018 – 2023 (USD Million) 116
TABLE NO. 69. : Latin America Floating Docks Market Revenue, By Type, 2024 – 2032 (USD Million) 116
TABLE NO. 70. : Latin America Floating Docks Market Volume, By Platform, 2018 – 2023 (Units) 117
TABLE NO. 71. : Latin America Floating Docks Market Volume, By Platform, 2024 – 2032 (Units) 117
TABLE NO. 72. : Latin America Floating Docks Market Revenue, By Platform, 2018 – 2023 (USD Million) 118
TABLE NO. 73. : Latin America Floating Docks Market Revenue, By Platform, 2024 – 2032 (USD Million) 118
TABLE NO. 74. : Latin America Floating Docks Market Volume, By Application, 2018 – 2023 (Units) 119
TABLE NO. 75. : Latin America Floating Docks Market Volume, By Application, 2024 – 2032 (Units) 119
TABLE NO. 76. : Latin America Floating Docks Market Revenue, By Application, 2018 – 2023 (USD Million) 120
TABLE NO. 77. : Latin America Floating Docks Market Revenue, By Application, 2024 – 2032 (USD Million) 120
TABLE NO. 78. : Middle East Floating Docks Market Volume, By Country, 2018 – 2023 (Units) 123
TABLE NO. 79. : Middle East Floating Docks Market Volume, By Country, 2024 – 2032 (Units) 123
TABLE NO. 80. : Middle East Floating Docks Market Revenue, By Country, 2018 – 2023 (USD Million) 124
TABLE NO. 81. : Middle East Floating Docks Market Revenue, By Country, 2024 – 2032 (USD Million) 124
TABLE NO. 82. : Middle East Floating Docks Market Volume, By Type, 2018 – 2023 (Units) 125
TABLE NO. 83. : Middle East Floating Docks Market Volume, By Type, 2024 – 2032 (Units) 125
TABLE NO. 84. : Middle East Floating Docks Market Revenue, By Type, 2018 – 2023 (USD Million) 126
TABLE NO. 85. : Middle East Floating Docks Market Revenue, By Type, 2024 – 2032 (USD Million) 126
TABLE NO. 86. : Middle East Floating Docks Market Volume, By Platform, 2018 – 2023 (Units) 127
TABLE NO. 87. : Middle East Floating Docks Market Volume, By Platform, 2024 – 2032 (Units) 127
TABLE NO. 88. : Middle East Floating Docks Market Revenue, By Platform, 2018 – 2023 (USD Million) 128
TABLE NO. 89. : Middle East Floating Docks Market Revenue, By Platform, 2024 – 2032 (USD Million) 128
TABLE NO. 90. : Middle East Floating Docks Market Volume, By Application, 2018 – 2023 (Units) 129
TABLE NO. 91. : Middle East Floating Docks Market Volume, By Application, 2024 – 2032 (Units) 129
TABLE NO. 92. : Middle East Floating Docks Market Revenue, By Application, 2018 – 2023 (USD Million) 130
TABLE NO. 93. : Middle East Floating Docks Market Revenue, By Application, 2024 – 2032 (USD Million) 130
TABLE NO. 94. : Africa Floating Docks Market Volume, By Country, 2018 – 2023 (Units) 133
TABLE NO. 95. : Africa Floating Docks Market Volume, By Country, 2024 – 2032 (Units) 133
TABLE NO. 96. : Africa Floating Docks Market Revenue, By Country, 2018 – 2023 (USD Million) 134
TABLE NO. 97. : Africa Floating Docks Market Revenue, By Country, 2024 – 2032 (USD Million) 134
TABLE NO. 98. : Africa Floating Docks Market Volume, By Type, 2018 – 2023 (Units) 135
TABLE NO. 99. : Africa Floating Docks Market Volume, By Type, 2024 – 2032 (Units) 135
TABLE NO. 100. : Africa Floating Docks Market Revenue, By Type, 2018 – 2023 (USD Million) 136
TABLE NO. 101. : Africa Floating Docks Market Revenue, By Type, 2024 – 2032 (USD Million) 136
TABLE NO. 102. : Africa Floating Docks Market Volume, By Platform, 2018 – 2023 (Units) 137
TABLE NO. 103. : Africa Floating Docks Market Volume, By Platform, 2024 – 2032 (Units) 137
TABLE NO. 104. : Africa Floating Docks Market Revenue, By Platform, 2018 – 2023 (USD Million) 138
TABLE NO. 105. : Africa Floating Docks Market Revenue, By Platform, 2024 – 2032 (USD Million) 138
TABLE NO. 106. : Africa Floating Docks Market Volume, By Application, 2018 – 2023 (Units) 139
TABLE NO. 107. : Africa Floating Docks Market Volume, By Application, 2024 – 2032 (Units) 139
TABLE NO. 108. : Africa Floating Docks Market Revenue, By Application, 2018 – 2023 (USD Million) 140
TABLE NO. 109. : Africa Floating Docks Market Revenue, By Application, 2024 – 2032 (USD Million) 140