Market Overview
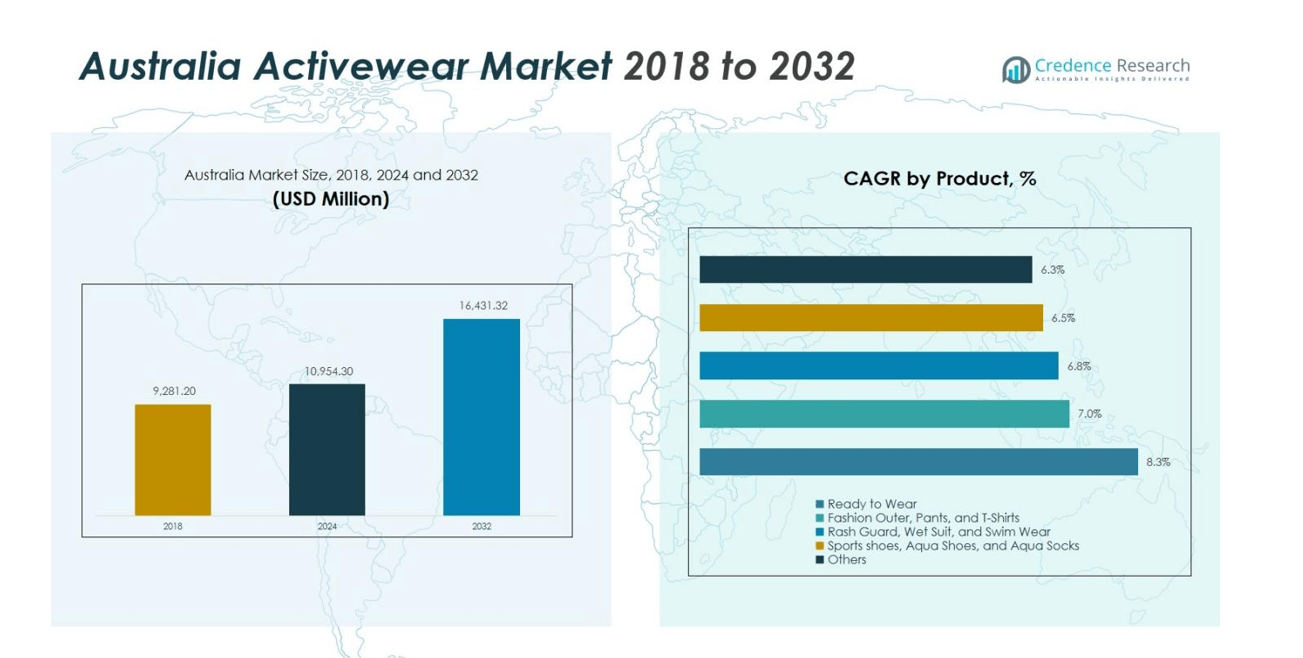
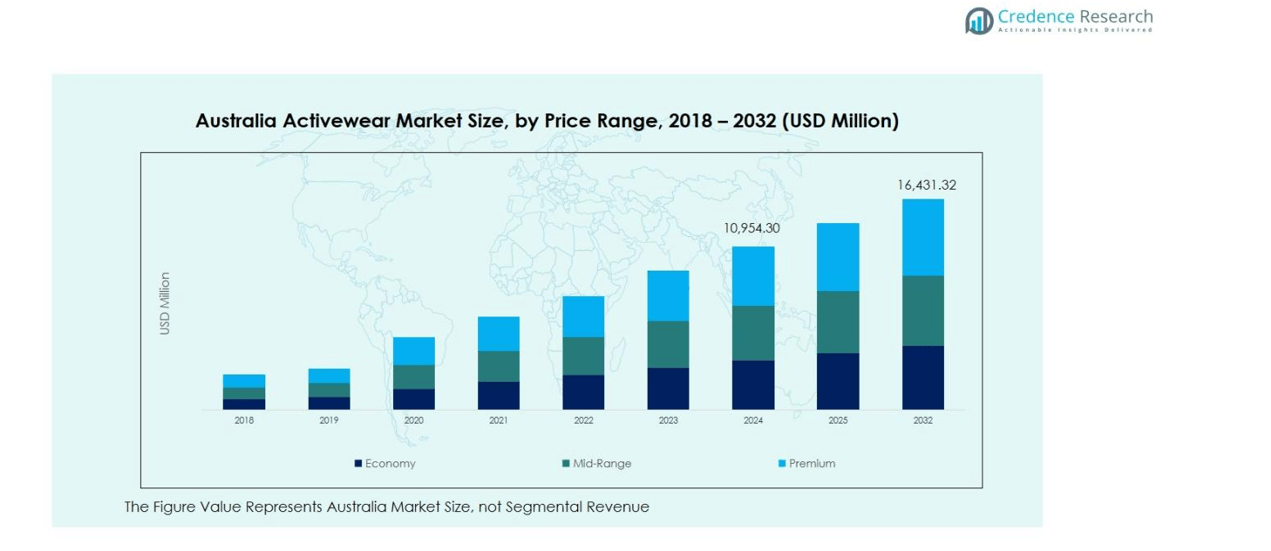
The Australia Activewear Market size was valued at USD 9,281.20 Million in 2018 and is projected to reach USD 10,954.30 Million in 2024. It is anticipated to grow further to USD 16,431.32 Million by 2032, at a CAGR of 5.20% during the forecast period.
| REPORT ATTRIBUTE |
DETAILS |
| Historical Period |
2020-2023 |
| Base Year |
2024 |
| Forecast Period |
2025-2032 |
| Australia Activewear Market Size 2024 |
USD 10,954.30 Million |
| Australia Activewear Market, CAGR |
5.20% |
| Australia Activewear Market Size 2032 |
USD 16,431.32 Million |
The Australia Activewear Market is driven by top players including Nike, Inc., Adidas AG, PUMA SE, Under Armour, Inc., ASICS Corporation, and SKECHERS USA, Inc., along with leading local brands such as Lorna Jane Pty Ltd and 2XU Pty Ltd. These companies dominate through innovative product offerings, strong brand presence, and expansive distribution channels. New South Wales leads the market with a share of approximately 32%, driven by Sydney’s active lifestyle and growing demand for athleisure. Victoria follows with a 26% market share, benefiting from Melbourne’s fitness culture and sustainable fashion trends. Queensland holds 20% of the market share, fueled by outdoor activities and a climate conducive to sports and fitness. These regions continue to drive the expansion and growth of the Australia Activewear Market, with key players focusing on innovation and strategic marketing to maintain their market positions.
Market Insights
- The Australia Activewear Market is valued at USD 10,954.30 Million in 2024 and is projected to grow at a CAGR of 5.20% through 2032 to reach USD 16,431.32 Million.
- Strong health and fitness awareness among Australians drives demand for activewear, as consumers increasingly engage in gym workouts, outdoor sports, and wellness activities.
- Athleisure and online retail channels are major trends, with the Ready to Wear segment holding a 40% share in 2024 and Polyester fabric representing 45% of the fabric mix, while Synthetic materials account for 60% of total share.
- Competition is intense with leading brands such as Nike, Adidas, Puma, Under Armour, ASICS, Skechers, Lorna Jane and 2XU, focusing on innovation, sustainability and digital presence to strengthen their positions.
- Regional dynamics show New South Wales with 32% share, Victoria with 26% and Queensland with 20% of the market, while rising price sensitivity and market saturation pose key constraints.
Access crucial information at unmatched prices!
Request your sample report today & start making informed decisions powered by Credence Research Inc.!
Download Sample
Market Segmentation Analysis:
By Product
The Australia Activewear Market is diverse, with key product categories such as Ready to Wear, Fashion Outer, Pants, and T-Shirts, Rash Guard, Wet Suit, and Swim Wear, and Sports Shoes, Aqua Shoes, and Aqua Socks. Among these, the Ready to Wear sub-segment dominates the market, holding a substantial share of 40% in 2024. This segment’s growth is driven by the increasing demand for versatile, comfortable, and stylish activewear for daily wear and fitness activities. Additionally, the rising health and fitness awareness in Australia continues to fuel the demand for ready-to-wear activewear items.
- For instance, Under Armour introduced its ‘Live in UA’ brand platform in Australia in April 2024, offering an expanded range of versatile apparel designed to cater from training to everyday use.
By Fabric
In the fabric segment, Polyester holds the largest share, commanding 45% of the market in 2024. This fabric is favored for its durability, moisture-wicking properties, and affordability, making it ideal for activewear. Polyester’s widespread use across various activewear categories, from leggings to sports bras, is a significant driver of its market dominance. Additionally, advancements in polyester technology, such as eco-friendly recycled polyester, further enhance its appeal among consumers seeking sustainable yet functional materials for activewear.
- For instance, Patagonia employs ocean plastics converted into recycled polyester for their activewear collection, highlighting innovations in sustainable fabrics aimed at reducing ocean plastic waste.
By Material
The Synthetic material segment leads the market, accounting for 60% of the market share in 2024. Synthetic materials, particularly polyester and spandex, are preferred for their flexibility, durability, and performance-enhancing features. These materials provide excellent stretchability, moisture management, and breathability, making them highly suitable for activewear. As consumers increasingly prioritize comfort and performance in their fitness apparel, the demand for synthetic materials continues to rise, solidifying their position as the dominant choice in the market.
Key Growth Drivers
Increasing Health and Fitness Awareness
The rising awareness regarding health and fitness in Australia is a primary growth driver for the activewear market. As more Australians adopt healthy lifestyles, the demand for fitness-related apparel continues to rise. Consumers are increasingly focusing on maintaining active routines, such as gym workouts, outdoor activities, and sports, which significantly boosts the demand for comfortable, performance-oriented activewear. This heightened fitness consciousness, combined with a greater interest in wellness, drives both participation and investment in activewear, further propelling the market’s growth.
- For instance, Nike launched its Air Zoom Alphafly NEXT% 2 in Australia, a running shoe featuring advanced cushioning and energy return technology tailored for long-distance runners.
Growth in Athleisure Fashion
Athleisure, the fusion of athletic and leisurewear, is becoming a dominant trend in the Australia Activewear Market. Consumers are increasingly seeking clothing that offers both functionality and style, making athleisure a popular choice for daily wear. The rise of fashion-conscious millennials and Gen Z consumers, who prioritize comfort without compromising style, is significantly contributing to this trend. The expansion of athleisure offerings by leading brands has further fueled this demand, positioning it as a major driver in the market, with activewear now being worn for casual and professional settings.
- For instance, Lorna Jane, a leading Australian brand, emphasizes versatile athleisure pieces that transition seamlessly from workouts to casual outings.
Expansion of Online Retail and E-commerce
The growth of online retail and e-commerce platforms has provided a significant boost to the Australia Activewear Market. The convenience and accessibility of online shopping, combined with easy returns and extensive product options, have made it a preferred purchasing channel for activewear consumers. Moreover, the increasing presence of global activewear brands through digital channels allows Australian consumers to access a wider variety of products. The growth of social media-driven shopping trends, such as influencer marketing, further supports the increasing shift toward online platforms in purchasing activewear.
Key Trends & Opportunities
Sustainability and Eco-friendly Activewear
Sustainability is becoming a key trend in the Australian activewear market. Consumers are increasingly prioritizing eco-friendly products made from recycled or sustainable materials. Brands are responding by incorporating sustainable practices such as using organic cotton, recycled polyester, and biodegradable fabrics in their activewear collections. This trend is not only driven by consumer demand for ethical choices but also by growing environmental concerns. The opportunity for brands to differentiate themselves through eco-conscious collections presents a significant market opportunity in the evolving activewear industry.
- For instance, CELYS™ introduced the world’s first fully compostable polyester fiber in 2021, biodegradable within 179 days in industrial composting, offering a high-performance, eco-friendly option for sustainable activewear.
Integration of Smart Fabrics and Wearable Technology
The integration of smart fabrics and wearable technology is an emerging opportunity in the Australian activewear market. With advancements in textile technology, activewear is evolving to offer more than just comfort and style. Smart fabrics that monitor biometrics, track performance, and regulate body temperature are gaining traction among fitness enthusiasts. This innovation provides consumers with personalized workout data, enhancing the activewear experience. As wearable technology becomes more sophisticated, brands incorporating these features can offer new, value-added benefits, further capturing the attention of tech-savvy customers.
- For instance, Hexoskin has developed smart garments embedded with textile sensors that continuously monitor cardiac, respiratory, and activity data such as ECG and heart rate, providing precise health insights for fitness enthusiasts.
Key Challenges
High Price Point for Premium Products
The high price point of premium activewear products is a key challenge in the market. While premium activewear brands offer superior quality, technology, and design, the cost remains prohibitive for a segment of price-sensitive consumers. This barrier can limit the market reach, particularly among middle-income individuals who may opt for more affordable alternatives. Although premium activewear is gaining popularity, the cost factor remains a significant challenge that brands must address to broaden their consumer base and increase overall market penetration.
Intense Competition and Market Saturation
The Australian activewear market is highly competitive, with numerous domestic and international players vying for market share. The presence of well-established global brands, such as Nike, Adidas, and Under Armour, alongside local brands, creates a saturated environment, making it difficult for smaller or new entrants to gain traction. This intense competition results in price wars, promotional offers, and increased marketing spend, which can affect profit margins. To stand out, companies need to innovate continuously and offer unique value propositions to attract and retain customers.
Regional Analysis
New South Wales (NSW)
New South Wales holds the largest market share in the Australia Activewear Market, accounting for 32% in 2024. The state’s dominance can be attributed to its high population density, urban lifestyle, and significant focus on fitness and wellness. Sydney, being a major metropolitan hub, is home to numerous gyms, sports clubs, and outdoor activities that fuel the demand for activewear. Furthermore, the increasing number of fitness-conscious individuals and the rising popularity of athleisure fashion in urban areas are contributing to the region’s continued market leadership.
Victoria (VIC)
Victoria is another key region in the Australia Activewear Market, holding a market share of 26% in 2024. Melbourne, the capital of Victoria, is known for its vibrant fitness culture and active lifestyle, which boosts the demand for activewear. The city hosts numerous fitness events, sports competitions, and wellness-related activities, contributing to the growing preference for high-performance activewear. Additionally, the increasing interest in sustainable and eco-friendly activewear products in this region aligns with the evolving preferences of consumers, further driving the market growth in Victoria.
Queensland (QLD)
Queensland accounts for 20% of the Australia Activewear Market share in 2024. The state’s favorable climate encourages outdoor activities such as surfing, hiking, and beach sports, driving the demand for activewear, especially in coastal cities like Brisbane and the Gold Coast. Queensland’s growing fitness-conscious population, combined with a strong culture of sports and outdoor recreation, has led to the increased adoption of activewear across various demographics. The region’s emphasis on casual and functional sportswear, including swimwear and athleisure, further contributes to the robust growth in the activewear segment.
Western Australia (WA)
Western Australia holds a market share of 12% in the Australia Activewear Market in 2024. The region’s vast landscape and outdoor recreational culture, including surfing, cycling, and hiking, significantly contribute to the demand for activewear. Perth, the capital, leads the region’s growth, with a rising focus on health and wellness initiatives. Additionally, the state’s growing awareness of sustainable activewear products is supporting an increasing shift toward eco-friendly options. Western Australia’s active lifestyle and rising number of fitness enthusiasts create a steady market for activewear products.
South Australia (SA)
South Australia holds a smaller market share of 6% in the Australia Activewear Market as of 2024. While the region has a smaller population, Adelaide’s focus on health, fitness, and outdoor activities like cycling, hiking, and running has fostered steady demand for activewear. The activewear market in South Australia is driven by the growing interest in fitness, sports participation, and wellness trends. As consumers seek more comfortable and durable apparel for their active lifestyles, the demand for both performance and leisurewear is expected to continue growing within the region.
Market Segmentations:
By Product
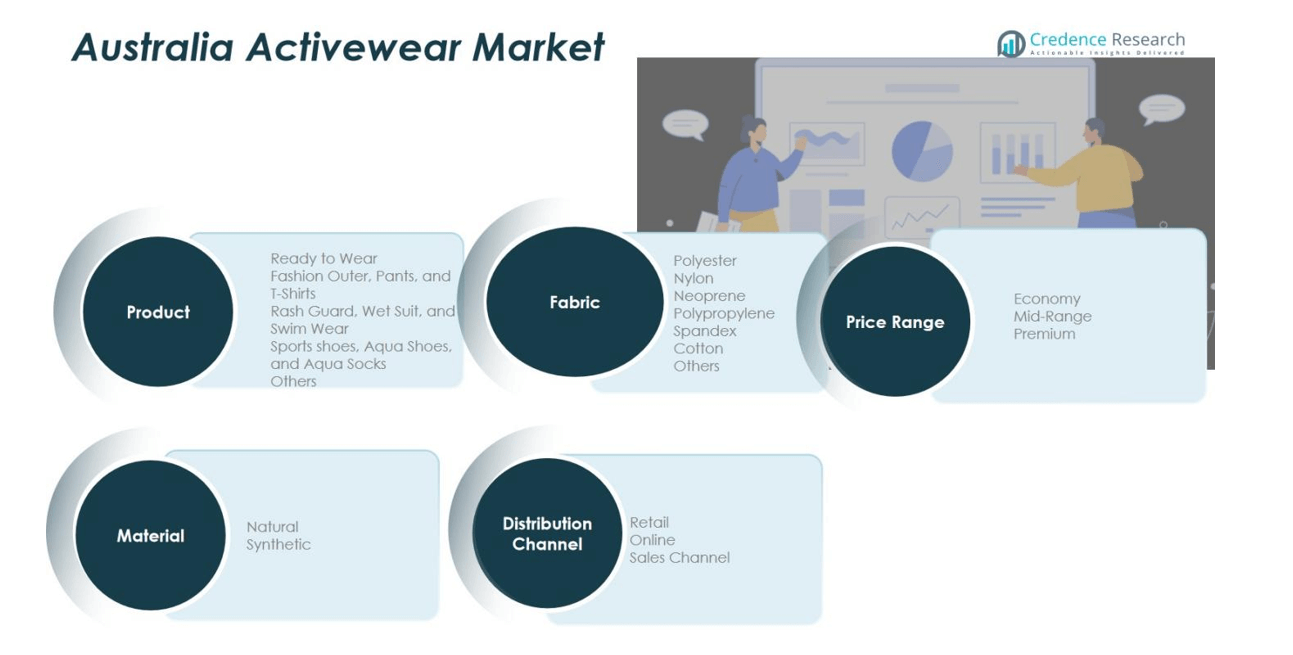
- Ready to Wear
- Fashion Outer, Pants, and T-Shirts
- Rash Guard, Wet Suit, and Swim Wear
- Sports Shoes, Aqua Shoes, and Aqua Socks
- Others
By Fabric
- Polyester
- Nylon
- Neoprene
- Polypropylene
- Spandex
- Cotton
- Others
By Material :
By Price Range :
- Economy
- Mid-Range
- Premium
By Distribution Channel
By Region
- New South Wales
- Victoria
- Queensland
- Western Australia
- South Australia
Competitive Landscape
Competitive analysis in the Australia Activewear Market is shaped by the presence of leading global brands such as Nike, Adidas, Puma, Under Armour, and local players like Lorna Jane and 2XU. These companies dominate the market by offering a wide range of products catering to different consumer segments, from high-performance activewear to casual athleisure. Nike and Adidas are the dominant players, holding a significant share due to their strong brand presence and extensive distribution networks. Their continuous innovation in fabric technology, eco-friendly product lines, and strategic marketing campaigns help maintain their market leadership. Local brands like Lorna Jane and 2XU focus on niche segments, emphasizing comfort, style, and Australian-made products. As competition intensifies, brands are increasingly focusing on online sales platforms, influencer collaborations, and sustainability initiatives to differentiate themselves. Additionally, the growing trend of athleisure and a shift toward personalized, high-performance gear present opportunities for both global and regional players.
Shape Your Report to Specific Countries or Regions & Enjoy 30% Off!
Key Player Analysis
- Nike, Inc.
- Adidas AG
- PUMA SE
- Under Armour, Inc.
- ASICS Corporation
- SKECHERS USA, Inc.
- Lorna Jane Pty Ltd
- 2XU Pty Ltd
- Nimble Activewear Pty Ltd
Recent Developments
- In June 2025, Lululemon signed a 10‑year offtake agreement with Australian textile recycling company Samsara Eco, committing to source a significant portion (≈20 %) of its future nylon 6,6 and polyester fibre needs from Samsara Eco.
- In August 2025, UK‑based activewear brand Sweaty Betty launched an online store in Australia in partnership with Australian retail distribution group The Nevada Company (owned by David and Elle Steans), and announced plans to open 20 physical stores in the country.
- In October 2025, British sportswear brand Umbro announced a collaboration with Australian fashion‑athleisure label Mertra to create a capsule collection featuring the Water‑Reactive Jacket and Technical Jacket/Co‑ord Pants.
- In November 2025, Western Force (rugby team) announced a long‑term apparel partnership with New Balance, to supply playing, training and travel wear through until 2028.
Report Coverage
The research report offers an in-depth analysis based on Product, Fabric, Material, Price Range, Distribution Channel and Region. It details leading market players, providing an overview of their business, product offerings, investments, revenue streams, and key applications. Additionally, the report includes insights into the competitive environment, SWOT analysis, current market trends, as well as the primary drivers and constraints. Furthermore, it discusses various factors that have driven market expansion in recent years. The report also explores market dynamics, regulatory scenarios, and technological advancements that are shaping the industry. It assesses the impact of external factors and global economic changes on market growth. Lastly, it provides strategic recommendations for new entrants and established companies to navigate the complexities of the market.
Future Outlook
- The Australia Activewear Market is expected to continue its growth trajectory, driven by the increasing demand for health and fitness-related products.
- Athleisure will remain a dominant trend, with consumers increasingly seeking versatile activewear that blends style, comfort, and functionality.
- Online retail and e-commerce will see further expansion, as more consumers shift toward shopping for activewear through digital platforms.
- The growing focus on sustainability will lead to a rise in eco-friendly activewear made from recycled and natural materials.
- Technological innovations in fabric and smart wearables will enhance the performance and appeal of activewear products.
- The demand for performance-oriented activewear will continue to rise, especially among fitness enthusiasts and professional athletes.
- Local brands will experience growth by tapping into niche markets, offering tailored products for specific customer needs.
- The rise of influencer marketing and social media promotions will further drive brand visibility and consumer engagement.
- Increasing awareness about the benefits of an active lifestyle will push more consumers to invest in quality activewear.
- Competitive pressures will encourage brands to focus on pricing strategies, product differentiation, and enhanced customer experience to maintain market share.



