
Market Overview
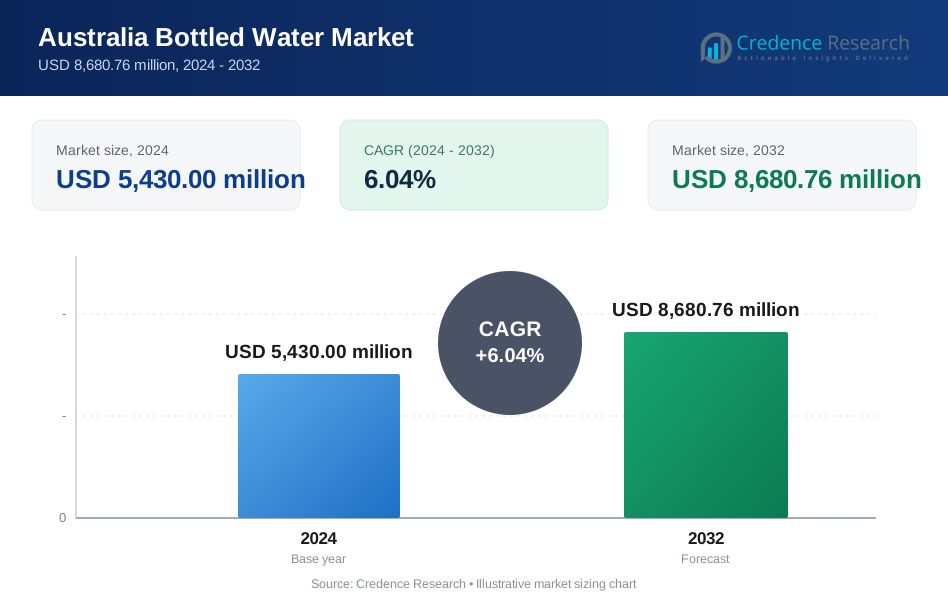
The Australia Bottled Water market reached USD 5,430.00 million in 2024 and is projected to rise to USD 8,680.76 million by 2032, registering a CAGR of 6.04% during the forecast period.
| REPORT ATTRIBUTE | DETAILS |
|---|---|
| Historical Period | 2020-2023 |
| Base Year | 2024 |
| Forecast Period | 2025-2032 |
| Australia Bottled Water Market Size 2024 | USD 5,430.00 million |
| Australia Bottled Water Market, CAGR | 6.04% |
| Australia Bottled Water Market Size 2032 | USD 8,680.76 million |
Top players in the Australia Bottled Water market include Coca-Cola Europacific Partners, Asahi Beverages, Nestlé Waters, PepsiCo, Frucor Suntory, Coles Group, Woolworths Group, Nu Pure Beverages, Neverfail Springwater, and Bickford’s Australia. These companies drive market growth through strong retail coverage, product innovation, and expanding premium and functional water lines. New South Wales leads the market with a 34% share, supported by dense urban demand and high consumption among health-focused users. Victoria follows with a 27% share driven by lifestyle shifts and strong retail penetration. Queensland holds a 22% share due to warm climate conditions, while Western Australia accounts for 17% supported by industrial and regional consumption.
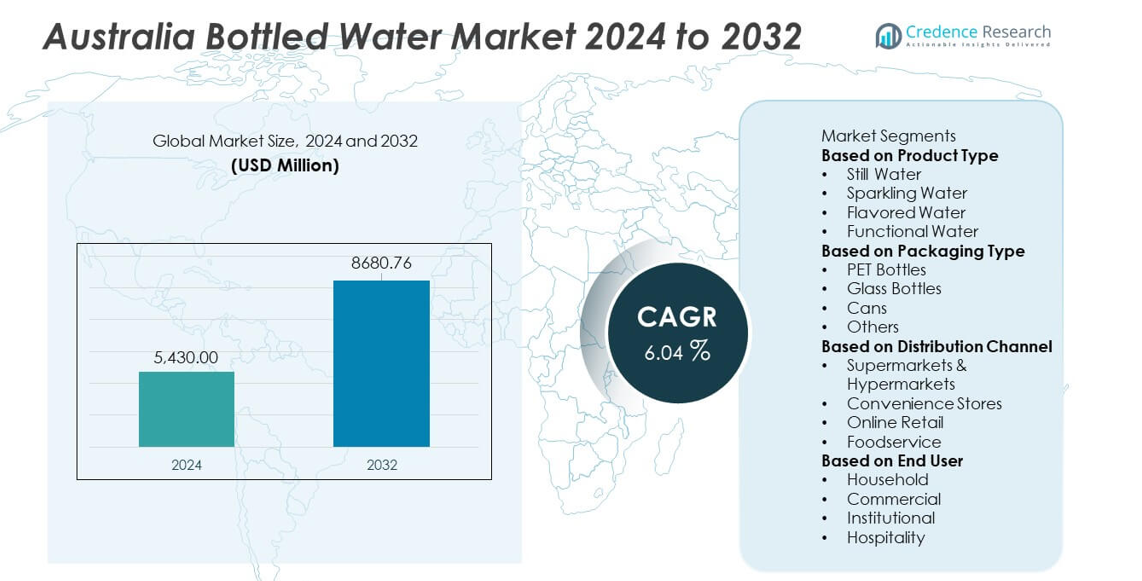
Market Insights
- The Australia Bottled Water market reached USD 5,430.00 million in 2024 and is set to grow at a 6.04% CAGR through 2032.
- Demand rises as health awareness strengthens and consumers shift toward safe, convenient hydration across still, sparkling, flavored, and functional water segments, with still water leading the category share.
- Trends highlight growth in eco-friendly packaging, premium mineral water, and flavored options, supported by strong brand innovation and expanding retail coverage.
- Competition intensifies as major players enhance sustainability, widen distribution, and invest in product diversification to capture evolving consumer preferences.
- Regional demand remains strong, with New South Wales holding 34% share, Victoria at 27%, Queensland at 22%, and Western Australia at 17%, reflecting varied climate conditions and consumption patterns across the country.
Market Segmentation Analysis:
By Product Type
Still water leads the product type segment with a 63% share, driven by strong demand for clean and reliable hydration. Consumers prefer still water due to rising health awareness and reduced intake of sugary drinks. Sparkling water grows as buyers seek premium and refreshing options with lower calories. Flavored water gains attention from young users who want taste without additives. Functional water expands through interest in electrolytes, vitamins, and performance benefits. Growth across all formats reflects a shift toward healthier lifestyles and higher focus on hydration.
- For instance, Coca-Cola Europacific Partners expanded production capacity for brands including Mount Franklin by adding new high-speed canning lines at its Richlands facility. CCEP has also invested in new warmfill production infrastructure at its Moorabbin facility to increase the capacity for drinks like Powerade and Fuze Tea.
By Packaging Type
PET bottles dominate the packaging segment with a 71% share, supported by low cost, light weight, and wide retail availability. Producers continue using PET due to strong recycling initiatives and high durability during transport. Glass bottles hold a niche presence driven by premium and eco-focused buyers. Cans gain traction as brands promote aluminium’s high recyclability. Other packaging formats serve small brands seeking differentiation. Rising interest in sustainable materials and improved recycling systems shapes packaging choices across the market.
- For instance, Coles Group invests in its supply chain and private label products to drive efficiency and meet customer demand for value and sustainability.
By Distribution Channel
Supermarkets and hypermarkets lead the distribution segment with a 46% share, driven by broad product ranges and strong nationwide networks. These stores attract buyers seeking competitive prices and bulk purchases. Convenience stores grow due to demand for on-the-go hydration near transit points and workplaces. Online retail expands through rising e-commerce adoption and subscription-based delivery models. Foodservice outlets increase sales as restaurants and cafés enhance premium water offerings. Shifts in buying habits and the need for easy access continue shaping distribution patterns across the country.
Key Growth Drivers
Rising Health Awareness and Shift from Sugary Beverages
Growing awareness of health risks linked to carbonated and sugary drinks drives stronger demand for bottled water in Australia. More consumers choose water as a clean hydration source that supports fitness routines and everyday wellness. This shift accelerates as campaigns promote reduced sugar intake and healthier beverage choices. Brands benefit from this trend by offering varied water formats that cater to active lifestyles. Rising interest in natural hydration continues to strengthen the market’s long-term growth outlook.
- For instance, PepsiCo provides purified water options by using an extensive, multi-step purification process for Aquafina which includes reverse osmosis and other filtering methods. This process, known as the HydRO- system, removes trace compounds like salts and chlorides from public water sources to ensure consistent purity and taste.
Expansion of Premium, Functional, and Eco-Focused Offerings
Premium and functional bottled water categories grow as consumers seek added value from hydration products. Demand rises for electrolyte-enhanced, vitamin-infused, alkaline, and mineral-rich water that supports wellness goals. Premium glass and artisan spring water attract buyers looking for purity and brand prestige. Eco-focused innovations such as recycled packaging widen appeal among sustainability-driven groups. These developments help brands differentiate in a competitive market while capturing higher-margin segments.
- For instance, Woolworths Group reduced packaging waste by removing over 550 tonnes of virgin plastic from its private-label water line.
Strong Retail Penetration and Growing On-the-Go Consumption
Australia’s wide retail network boosts bottled water availability across supermarkets, convenience stores, and vending channels. High mobility among working professionals, students, and travelers increases on-the-go consumption. Foodservice outlets expand sales as cafés and restaurants upgrade their beverage menus. Retailers enhance distribution efficiency through better inventory systems and cold-chain access. These factors sustain strong market reach and drive consistent demand throughout urban and regional areas.
Key Trends & Opportunities
Growth of Sustainable Packaging and Circular Economy Models
Sustainability becomes a defining trend as consumers seek products with lower environmental impact. Brands adopt recycled PET, lightweight bottles, plant-based materials, and refillable formats. Many companies support circular economy programs through bottle collection and recycling partnerships. These efforts enhance brand reputation and meet rising regulatory expectations. The shift toward sustainable packaging creates strong opportunities for companies investing in green technologies and improved waste-management systems.
- For instance, Nestlé Waters advanced bio-based packaging after testing 100% plant-derived PET prototypes across three pilot production lines.
Increasing Demand for Premiumization and Wellness-Oriented Products
Premium bottled water gains momentum as buyers show interest in mineral composition, natural sources, and purity claims. Wellness-oriented offerings like electrolyte water, pH-balanced water, and infused variants attract health-focused consumers. Brands use quality-based differentiation to enter higher-value segments. Tourism and hospitality sectors also support premium water sales due to rising focus on guest experience. This trend creates strong opportunities for companies that develop unique formulations and targeted wellness products.
- For instance, Nu Pure Beverages developed wellness-focused SKUs using a purification process designed to remove impurities, followed by the addition of essential electrolytes or the use of ionisation to achieve a higher pH and maintain a refreshing taste.
Key Challenges
Environmental Concerns and Rising Scrutiny of Single-Use Plastics
Environmental issues pose a major challenge as consumers question the impact of single-use plastics. Public pressure increases for stronger recycling rates, lower carbon footprints, and reduced waste. Government restrictions on plastics intensify compliance needs for manufacturers. These shifts require significant investments in sustainable packaging and waste-reduction strategies. Failure to adapt can harm brand reputation and reduce market competitiveness in the long run.
High Competition and Price Sensitivity Across Consumer Groups
The market faces intense competition due to many local and international brands offering similar products. Price sensitivity among consumers makes it difficult for companies to maintain strong margins. Discount-driven sales and private-label offerings add pressure to premium brands. Firms must invest in innovation and marketing to build differentiation. Rising operational costs related to logistics, packaging, and compliance create further challenges for sustained profitability.
Regional Analysis
New South Wales
New South Wales holds a 34% share of the Australia Bottled Water market and leads due to strong urban demand and high adoption of premium hydration products. The region benefits from rising health awareness and steady growth in fitness-linked consumption. Expanding retail networks and strong penetration of still and sparkling water products support steady momentum. Tourism and hospitality also boost sales across major cities. Growing interest in eco-friendly packaging shapes brand strategies, while digital grocery platforms increase product reach. The region maintains a competitive landscape driven by strong brand visibility and active promotional activity across retail and online channels.
Victoria
Victoria accounts for a 27% share of the Australia Bottled Water market and shows steady growth supported by rising consumption among working professionals and students. The region sees strong demand for flavored and functional water due to lifestyle shifts. Expanding supermarket chains and a strong café culture enhance distribution reach. Increased focus on sustainability encourages producers to introduce recyclable and lightweight packaging. Growth in fitness centers and outdoor activities further boosts sales. The market maintains a balanced competitive environment, with both global and local brands strengthening product portfolios to match evolving consumer hydration needs across urban and suburban areas.
Queensland
Queensland holds a 22% share of the Australia Bottled Water market and benefits from warm weather conditions that drive higher per-capita consumption. Tourism hubs and outdoor recreation activities support year-round demand for portable hydration options. The region sees strong penetration of PET bottled still water, supported by wide retail availability and travel-linked sales. Rising interest in mineral-rich and natural spring variants increases brand diversification. Local producers expand supply chains to meet growing volumes. Sustainability trends influence packaging innovation, while digital retail platforms broaden access. Market competition remains strong as companies target both residents and tourism-driven demand spikes.
Western Australia
Western Australia captures a 17% share of the Australia Bottled Water market and experiences rising demand supported by mining, industrial zones, and growing urban populations. Hot climate conditions increase reliance on packaged hydration, boosting sales of bulk and single-serve formats. Local spring water brands gain visibility due to strong regional sourcing. Retail expansion across metro and remote areas improves product reach. Sustainable packaging trends influence strategic shifts among producers. Tourism growth and large-scale outdoor events raise consumption levels. The region maintains healthy competition as brands strengthen logistics and product innovation to serve widespread consumer and commercial requirements.
Market Segmentations:
By Product Type
- Still Water
- Sparkling Water
- Flavored Water
- Functional Water
By Packaging Type
- PET Bottles
- Glass Bottles
- Cans
- Others
By Distribution Channel
- Supermarkets & Hypermarkets
- Convenience Stores
- Online Retail
- Foodservice
By End User
- Household
- Commercial
- Institutional
- Hospitality
By Geography
- New South Wales
- Victoria
- Queensland
- Western Australia
Competitive Landscape
Competitive landscape analysis in the Australia Bottled Water market features major players such as Coca-Cola Europacific Partners, Asahi Beverages, Nestlé Waters, PepsiCo, Frucor Suntory, Coles Group, Woolworths Group, Nu Pure Beverages, Neverfail Springwater, and Bickford’s Australia. These companies compete through strong distribution networks, diverse product portfolios, and active investment in sustainable packaging solutions. Leading brands focus on strengthening premium, functional, and flavored water categories to match rising health-driven demand. Private-label products from major retailers expand market reach through competitive pricing. Companies also enhance supply chain efficiency to support nationwide availability. Growing interest in natural spring water and eco-friendly materials encourages innovation across product lines. Strategic marketing, partnerships, and improved retail visibility help brands maintain customer loyalty. The overall market remains highly competitive as firms refine product quality, expand regional penetration, and leverage digital retail platforms to meet evolving consumer hydration habits.
Key Player Analysis
- Coca-Cola Europacific Partners (Mount Franklin)
- Asahi Beverages (Schweppes Australia)
- Nestlé Waters
- PepsiCo (Gatorade/ Aquafina)
- Frucor Suntory
- Coles Group (Private Label Water)
- Woolworths Group (Private Label Water)
- Nu Pure Beverages
- Neverfail Springwater
- Bickford’s Australia
Recent Developments
- In July 2025, Asahi Beverages (owner of spring-water brands like Cool Ridge) pledged over AUD 1 million in funding to charities OzHarvest and Rural Aid - a sign Asahi is strengthening community engagement amid rising scrutiny over water sourcing.
- In November 2024, Nestlé SA announced plans to reorganize its water and premium beverages activities into a global, standalone business.
- In May 2024, Coca-Cola Europacific Partners (Mount Franklin) paused groundwater extraction at its Perth Hills site after criticism over water use amid drought.
Report Coverage
The research report offers an in-depth analysis based on Product Type, Packaging Type, Distribution Channel, End User and Geography. It details leading market players, providing an overview of their business, product offerings, investments, revenue streams, and key applications. Additionally, the report includes insights into the competitive environment, SWOT analysis, current market trends, as well as the primary drivers and constraints. Furthermore, it discusses various factors that have driven market expansion in recent years. The report also explores market dynamics, regulatory scenarios, and technological advancements that are shaping the industry. It assesses the impact of external factors and global economic changes on market growth. Lastly, it provides strategic recommendations for new entrants and established companies to navigate the complexities of the market.
Future Outlook
- Demand for premium and functional water products will rise as consumers prioritize health.
- Adoption of sustainable and recyclable packaging will expand across major brands.
- Digital retail platforms will drive higher online bottled water purchases nationwide.
- Investments in local spring water sourcing will strengthen regional supply chains.
- Brands will introduce more flavored and low-calorie hydration options to meet lifestyle shifts.
- Smart vending and automated refill stations will improve product accessibility in urban areas.
- Private-label bottled water will gain traction due to strong value-driven demand.
- Partnerships with gyms, cafés, and hospitality venues will enhance brand visibility.
- Climate-driven consumption patterns will push higher demand in warmer regions.
- Innovations in lightweight bottles and eco-friendly materials will shape future product development.
Request a Free Sample
Fill in your details and we'll send you a free sample report.
- Sample data tables & charts
- Research methodology
Need a Custom Version of This Report?
Tailor the scope, geography, or segments to your exact requirements.
- Custom geography or segment scope
- Direct access to our analyst team
Frequently Asked Questions
What is the current market size for the Australia Bottled Water market, and what is its projected size in 2032?
At what Compound Annual Growth Rate is the Australia Bottled Water market projected to grow between 2025 and 2032?
Who are the major players in the bottled water market in Australia?
What are the major market drivers of the Australian bottled water industry?
Who are the leading companies in the Australia Bottled Water market?
Table of Content
Chapter 1. Report Introduction
- 1.1 Report Description & Purpose
- 1.1.1 Report Title & Market Definition
- 1.1.2 Unique Selling Propositions (USP) & Key Differentiators
- 1.1.3 Value Proposition for Stakeholders
- 1.2 Research Objectives
- 1.2.1 Market Sizing Objectives (Volume & Revenue) (Volume Where Applicable)
- 1.2.2 Segmentation Objectives
- 1.2.3 Competitive Intelligence Objectives
- 1.2.4 Forecast & Scenario Objectives
- 1.3 Report Scope
- 1.3.1 Australia Bottled Water Scope – Segments & Subsegments Covered
- 1.3.2 Geographic Scope – Selected Country & Subnational Markets Covered
- 1.3.3 Historical Period, Base Year & Forecast Period (2024; forecast to 2032)
- 1.3.4 Inclusions & Exclusions
- 1.4 Industry Classification & Applicable Codes
- 1.5 Currency, Measurement Units & Valuation Basis
- 1.6 Target Stakeholders
- 1.7 Limitations & Assumptions
Chapter 2. Executive Summary
- 2.1 Australia Bottled Water Snapshot
- 2.1.1 Market Size – Historical (2024) & Forecast (2024-2032) (2024: USD 5,430.00 million → 2032: USD 8,680.76 million)
- 2.1.2 Volume & Revenue – National Totals (Volume Where Applicable)
- 2.1.3 Key Market Highlights – Top Five Facts
- 2.2 Australia Bottled Water Segmentation Snapshot
- 2.2.1 Market Split by Subnational Area – 2024 vs. 2032
- 2.3 Competitive Snapshot
- 2.3.1 Top 10 Players by Revenue Share – 2024
- 2.3.2 Top 10 Players by Volume Share – 2024 (Volume Where Applicable)
- 2.3.3 Recent Strategic Developments (18-Month Summary)
- 2.4 Key Investment Highlights & Strategic Conclusions
Chapter 3. Australia Bottled Water Dynamics & Industry Analysis
- 3.1 Market Overview & Context
- 3.1.1 Australia Bottled Water Position in the Broader Industry Value Chain
- 3.1.2 Demand Structure & Purchasing Dynamics
- 3.1.3 Market Maturity & Development Stage Across Domestic Markets
- 3.2 Australia Bottled Water Drivers
- 3.3 Australia Bottled Water Restraints & Challenges
- 3.4 Australia Bottled Water Opportunities
- 3.5 Porter's Five Forces Analysis
- 3.5.1 Threat of New Entrants
- 3.5.2 Bargaining Power of Suppliers
- 3.5.3 Bargaining Power of Buyers
- 3.5.4 Threat of Substitutes
- 3.5.5 Competitive Rivalry – Intensity Assessment
- 3.6 Australia Bottled Water Value Chain Analysis
- 3.6.1 Upstream – Key Inputs, Resources & Suppliers
- 3.6.1.1 Key Input/Resource 1
- 3.6.1.2 Key Input/Resource 2
- 3.6.1.3 Key Input/Resource 3
- 3.6.2 Midstream – Core Operations & Value Creation
- 3.6.2.1 Operating Model & Process Overview
- 3.6.2.2 Key Operating Locations & Capabilities by Company
- 3.6.3 Downstream – Market Channels & End Users
- 3.6.3.1 Direct Sales & Customer Engagement Channels
- 3.6.3.2 Indirect Sales, Intermediaries & Partner Channels
- 3.6.4 Value Chain Profitability Analysis
- 3.6.1 Upstream – Key Inputs, Resources & Suppliers
- 3.7 PESTEL Analysis
- 3.7.1 Political Factors
- 3.7.2 Economic Factors
- 3.7.3 Social Factors
- 3.7.4 Technological Factors
- 3.7.5 Environmental Factors
- 3.7.6 Legal Factors
- 3.8 Australia Bottled Water Supply Chain Analysis
- 3.8.1 Critical Input & Resource Availability Risk Assessment
- 3.8.2 Supplier & Operational Concentration Risk (Geographic Exposure)
- 3.8.3 Supply & Service Disruption Impact Analysis
- 3.9 National & Subnational Regulatory Landscape
Note: The regulatory and policy landscape section covers regulations based on their applicability to the market, Australia Bottled Water category, geography, and scope of the study. Only regulatory frameworks with a material impact on operations, compliance, trade, sustainability, or market access are analyzed in detail.
Chapter 4. Key Investment Pockets & Opportunity Analysis
- 4.1 Australia Bottled Water Attractiveness Analysis
- 4.1.1 By Subnational Area – Investment Attractiveness Matrix (Market Size × CAGR)
- 4.2 Absolute Revenue Growth Opportunity
- 4.2.1 By Subnational Area – Absolute Revenue Growth Through 2032
- 4.3 Incremental Demand Opportunity
- 4.3.1 By Subnational Area – Incremental Demand Through 2032
- 4.3.2 Segment – Incremental Demand
- 4.4 Emerging Submarket Opportunity Deep Dive (Subject to Applicability)
- 4.5 Priority Domestic Market Opportunity Scorecards
- 4.5.1 Priority Domestic Market 1
- 4.5.2 Priority Domestic Market 2
- 4.5.3 Priority Domestic Market 3
- 4.5.4 Priority Domestic Market 4
Note: Domestic market scorecards cover relevant states, provinces, territories, cities, or economic zones within the selected country. Numbered entries are populated with market names suited to the national administrative structure and research scope. Geographic share tables use one consistent, nonoverlapping set of areas.
Chapter 5. Australia Bottled Water Cross-Border Trade & Market Access Analysis
- 5.1 National Trade & International Partner Overview
- 5.1.1 Export Value by Destination Country (2024)
- 5.1.2 Export Volume by Destination Country (2024) (Where Applicable)
- 5.1.3 Import Value by Source Country (2024)
- 5.1.4 Import Volume by Source Country (2024) (Where Applicable)
- 5.1.5 National & Partner-Country Trade Balances (2024)
- 5.2 Export Analysis – Segment
- 5.2.1 Category 1 (Applicable Classification Code)
- 5.2.2 Category 2 (Applicable Classification Code)
- 5.2.3 Category 3 (Applicable Classification Code)
- 5.2.4 Category 4 (Applicable Classification Code)
- 5.2.5 Category 5 (Applicable Classification Code)
- 5.3 Import Analysis – Segment
- 5.3.1 Category 1 (Applicable Classification Code)
- 5.3.2 Category 2 (Applicable Classification Code)
- 5.3.3 Category 3 (Applicable Classification Code)
- 5.3.4 Category 4 (Applicable Classification Code)
- 5.3.5 Category 5 (Applicable Classification Code)
- 5.4 Cross-Border Pricing & Transaction Benchmarks
- 5.4.1 Export Pricing – Segment & Destination Country
- 5.4.2 Import Pricing – Segment & Source Country
- 5.4.3 Price Trends (2024)
- 5.5 Key Cross-Border Trade & Delivery Routes
- 5.5.1 Cross-Border Trade/Delivery Route 1
- 5.5.2 Cross-Border Trade/Delivery Route 2
- 5.5.3 Cross-Border Trade/Delivery Route 3
- 5.5.4 Cross-Border Trade/Delivery Route 4
- 5.5.5 Cross-Border Trade/Delivery Route 5
- 5.6 Trade Policy & Market Access Impact Assessment
- 5.6.1 Tariff & Non-Tariff Barriers
- 5.6.2 National Participation in Regional Trade & Economic Frameworks
- 5.6.3 Bilateral & Multilateral Trade Agreements
- 5.6.4 Cross-Border Operating, Licensing & Localization Requirements
Note: This chapter covers international trade relevant to Australia Bottled Water in the selected country. Exports are analyzed by destination and imports by source. Domestic interregional flows are excluded from international trade totals. Goods, services, and digital offerings use applicable classifications; volume and route analyses apply only where meaningful.
Chapter 6. Competitive Landscape & Company Benchmarking
- 6.1 Australia Bottled Water Concentration & Structure
- 6.1.1 Herfindahl-Hirschman Index (HHI) – vs. 2024
- 6.1.2 Leading, Mid-Sized & Emerging Player Structure
- 6.1.3 Multinational, National & Local Player Dynamics
- 6.2 Australia Bottled Water Share Analysis – 2024
- 6.2.1 National Revenue Share by Company
- 6.2.2 National Volume Share by Company (Volume Where Applicable)
- 6.2.3 Company Revenue Share by Subnational Area
- 6.2.4 Market Share Evolution ( vs. 2024)
- 6.2.5 Company Market Share by Key Segment
- 6.2.6 Company Market Share by Customer Group
- 6.3 Operating Scale, Capacity & Infrastructure Analysis
- 6.3.1 National Operating Scale & Supply Capacity
- 6.3.2 Resource Utilization & Operating Efficiency
- 6.3.3 Output, Service Delivery & Activity Metrics
- 6.3.4 Operating Footprint & Infrastructure Map
- 6.3.5 Planned Operational & Capacity Expansion
- 6.4 Australia Bottled Water Competitive Benchmarking Matrix
- 6.4.1 Revenue, Growth, Profitability & Operating Metric Comparison
- 6.4.2 Channel Revenue Mix
- 6.4.3 Revenue Exposure Across Domestic Markets
- 6.4.4 R&D Intensity
- 6.4.5 Sustainability Maturity
- 6.5 Strategic Developments in Australia Bottled Water (Last 24 Months)
- 6.5.1 Mergers, Acquisitions & Divestments
- 6.5.2 New Products, Services & Solutions in Australia Bottled Water
- 6.5.3 Operational & Infrastructure Expansions
- 6.5.4 Strategic Alliances, Joint Ventures & Partnerships
- 6.5.5 Distribution Expansion & Market Entry
- 6.5.6 Sustainability & ESG Initiatives
- 6.6 Competitive Strategy Mapping
- 6.6.1 Leader, Challenger, Follower & Niche Classification
- 6.6.2 Pricing Strategy Comparison
- 6.6.3 Channel Strategy Matrix
Note: Strategic developments are included based on their materiality and the availability of reliable information.
Chapter 7. Australia Bottled Water – By Sales & Delivery Channel
- 7.1 Segment Overview
- 7.1.1 Volume & Revenue Split by Channel (2024 & 2032) (Volume Where Applicable)
- 7.1.2 Channel Mix Evolution (2024-2032)
Chapter 8. Subnational Market Analysis – Country Overview
- 8.1 Domestic Geographic Market Overview
- 8.1.1 Subnational Volume Share (Where Applicable)
- 8.1.2 Subnational Revenue Share
- 8.1.3 Market Volume by Subnational Area (Where Applicable)
- 8.1.4 Market Revenue by Subnational Area
- 8.1.5 Subnational Forecasts Through 2032
- 8.2 Cross-Area Segment Analysis Within the Country
- 8.2.1 By Sales & Delivery Channel
- 8.2.2 By Competitive Positioning & Price Tier
Chapter 9. Australia Bottled Water – Priority Domestic Market 1
Chapter 10. Australia Bottled Water – Priority Domestic Market 2
Chapter 11. Australia Bottled Water – Priority Domestic Market 3
Chapter 12. Australia Bottled Water – Priority Domestic Market 4
Chapter 13. Australia Bottled Water Company Profiles
- 13.1 [Company 01]
- 13.1.1 Company Overview
- 13.1.2 Key Management Personnel
- 13.1.3 Products & Services Portfolio
- 13.1.4 Financial Performance
- 13.1.5 Domestic Market Focus & Local Operating Presence
- 13.1.6 Recent Developments & Strategic Initiatives
Note: The company profile list is preliminary and may change based on research findings, market developments, data availability, and client requirements.
Chapter 14. Appendices
- Appendix A – List of Abbreviations & Acronyms
- Appendix B – Industry Classification Code Reference – Full Series
- Appendix C – Supply, Output & Operating Capacity Data Tables
- Appendix D – End-Use & Demand Base Tables
- Appendix E – Demand, Adoption & Usage Assumptions
- Appendix F – Pricing & Revenue Metric Reference Tables
- Appendix G – Company Operations & Infrastructure Database
- Appendix H – Cross-Border Trade & Activity Data Tables (Where Applicable)
- Appendix I – Regulatory Summary Tables
- Appendix J – Primary Research Participant List (Anonymized)
- Appendix K – Primary Research Questionnaire Framework
- Appendix L – Data Sources & Bibliography
- Appendix M – Market Size Divergence & Source Comparison
Chapter 15. Research Methodology
- 15.1 Research Framework & Philosophy
- 15.2 Secondary Research – Sources, Hierarchy & Data Extraction
- 15.3 Data Modeling – National Market Sizing & Subnational Allocation
- 15.4 Primary Research – Stakeholder Framework, LOI & Sample Sizes
- 15.5 Forecast Methodology – Regression, Scenario & Sensitivity Analysis
- 15.6 Quality Control – Four-Layer Validation Framework
- 15.7 Limitations & Standard Assumptions
- 15.8 Disclaimer
