
Migrant households and fakeaway cooking reshape the category
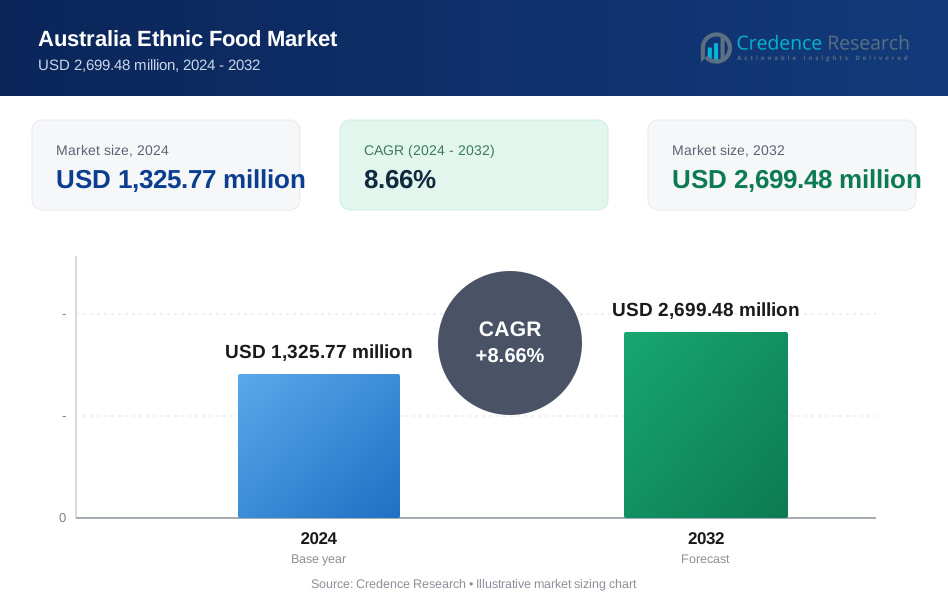
The Australia ethnic food market was valued at USD 1.44 billion in 2025 and is projected to increase from USD 1.57 billion in 2026 to USD 3.31 billion by 2035, registering a CAGR of 8.66% during 2026–2035. Demand comes from a population in which 32.0% of residents were born overseas at June 2025, from home cooks replacing takeaway with curry pastes, noodles and dumplings, and from supermarkets giving these lines more shelf space. New South Wales held the largest state share, 33.0% in 2025, helped by Sydney's large Chinese-born community. Western Australia is the fastest-growing state at 9.43% a year, because its population rose 2.2% in the year to June 2025, the fastest of any state. The most important commercial change is local production, with Chinese frozen food group Sanquan announcing an AUD 280 million Australian plant in July 2025, after Nissin bought dumpling maker ABC Pastry in 2024.
What does the Australian ethnic food market include and how large is Asian food within it?
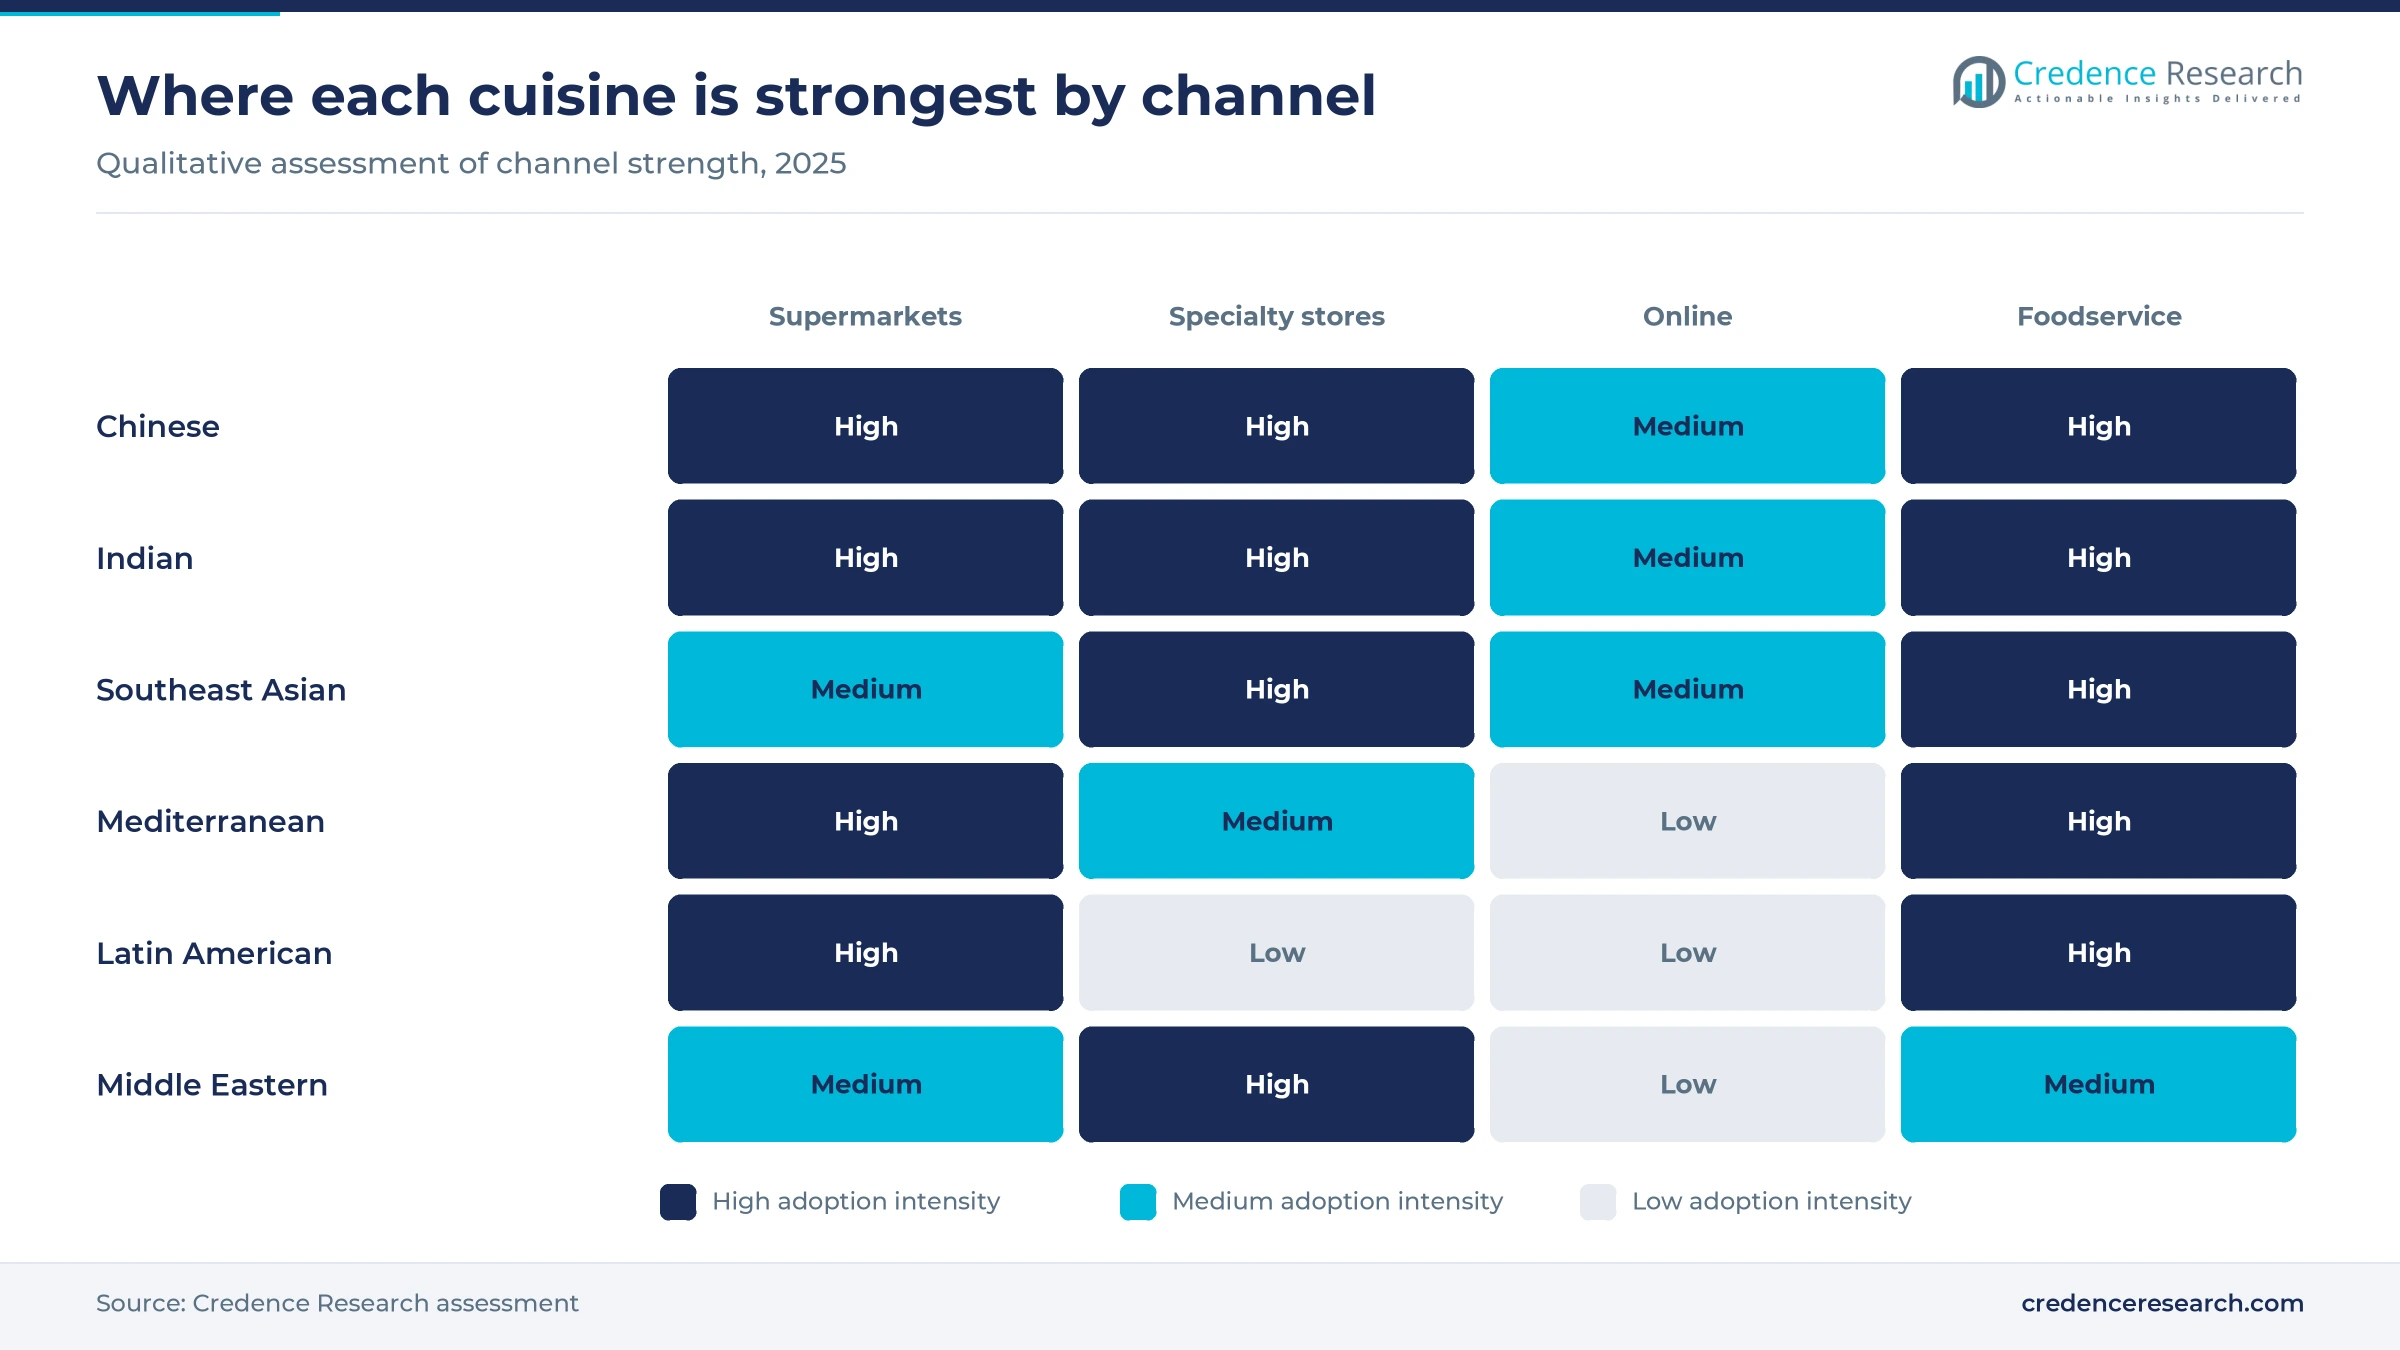
The market counts packaged and prepared products sold under Chinese, Indian, Southeast Asian, Mediterranean, Latin American and Middle Eastern cuisine positioning, at retail and through supply to foodservice outlets. Sauces, pastes, frozen dumplings, rice, noodles, snacks, spices and beverages are the main baskets. Chinese, Indian and Southeast Asian cuisines together held 60.4% of 2025 value in the Credence Research model.
Restaurant meal sales themselves are excluded, so the value equals about 0.9% of the US$157 billion that USDA reports for food and liquor retailing in 2024. Fresh produce, general seasonings without a cuisine identity and pet food are also excluded. The value chain runs from importers and local manufacturers through national grocers, independent Asian grocers and online stores to households and kitchens.
Australia Ethnic Food Market Insights
- Value rises from USD 1.44 billion in 2025 to USD 3.31 billion by 2035 at an 8.66% CAGR, as migration, supermarket range growth and local frozen capacity reinforce one another.
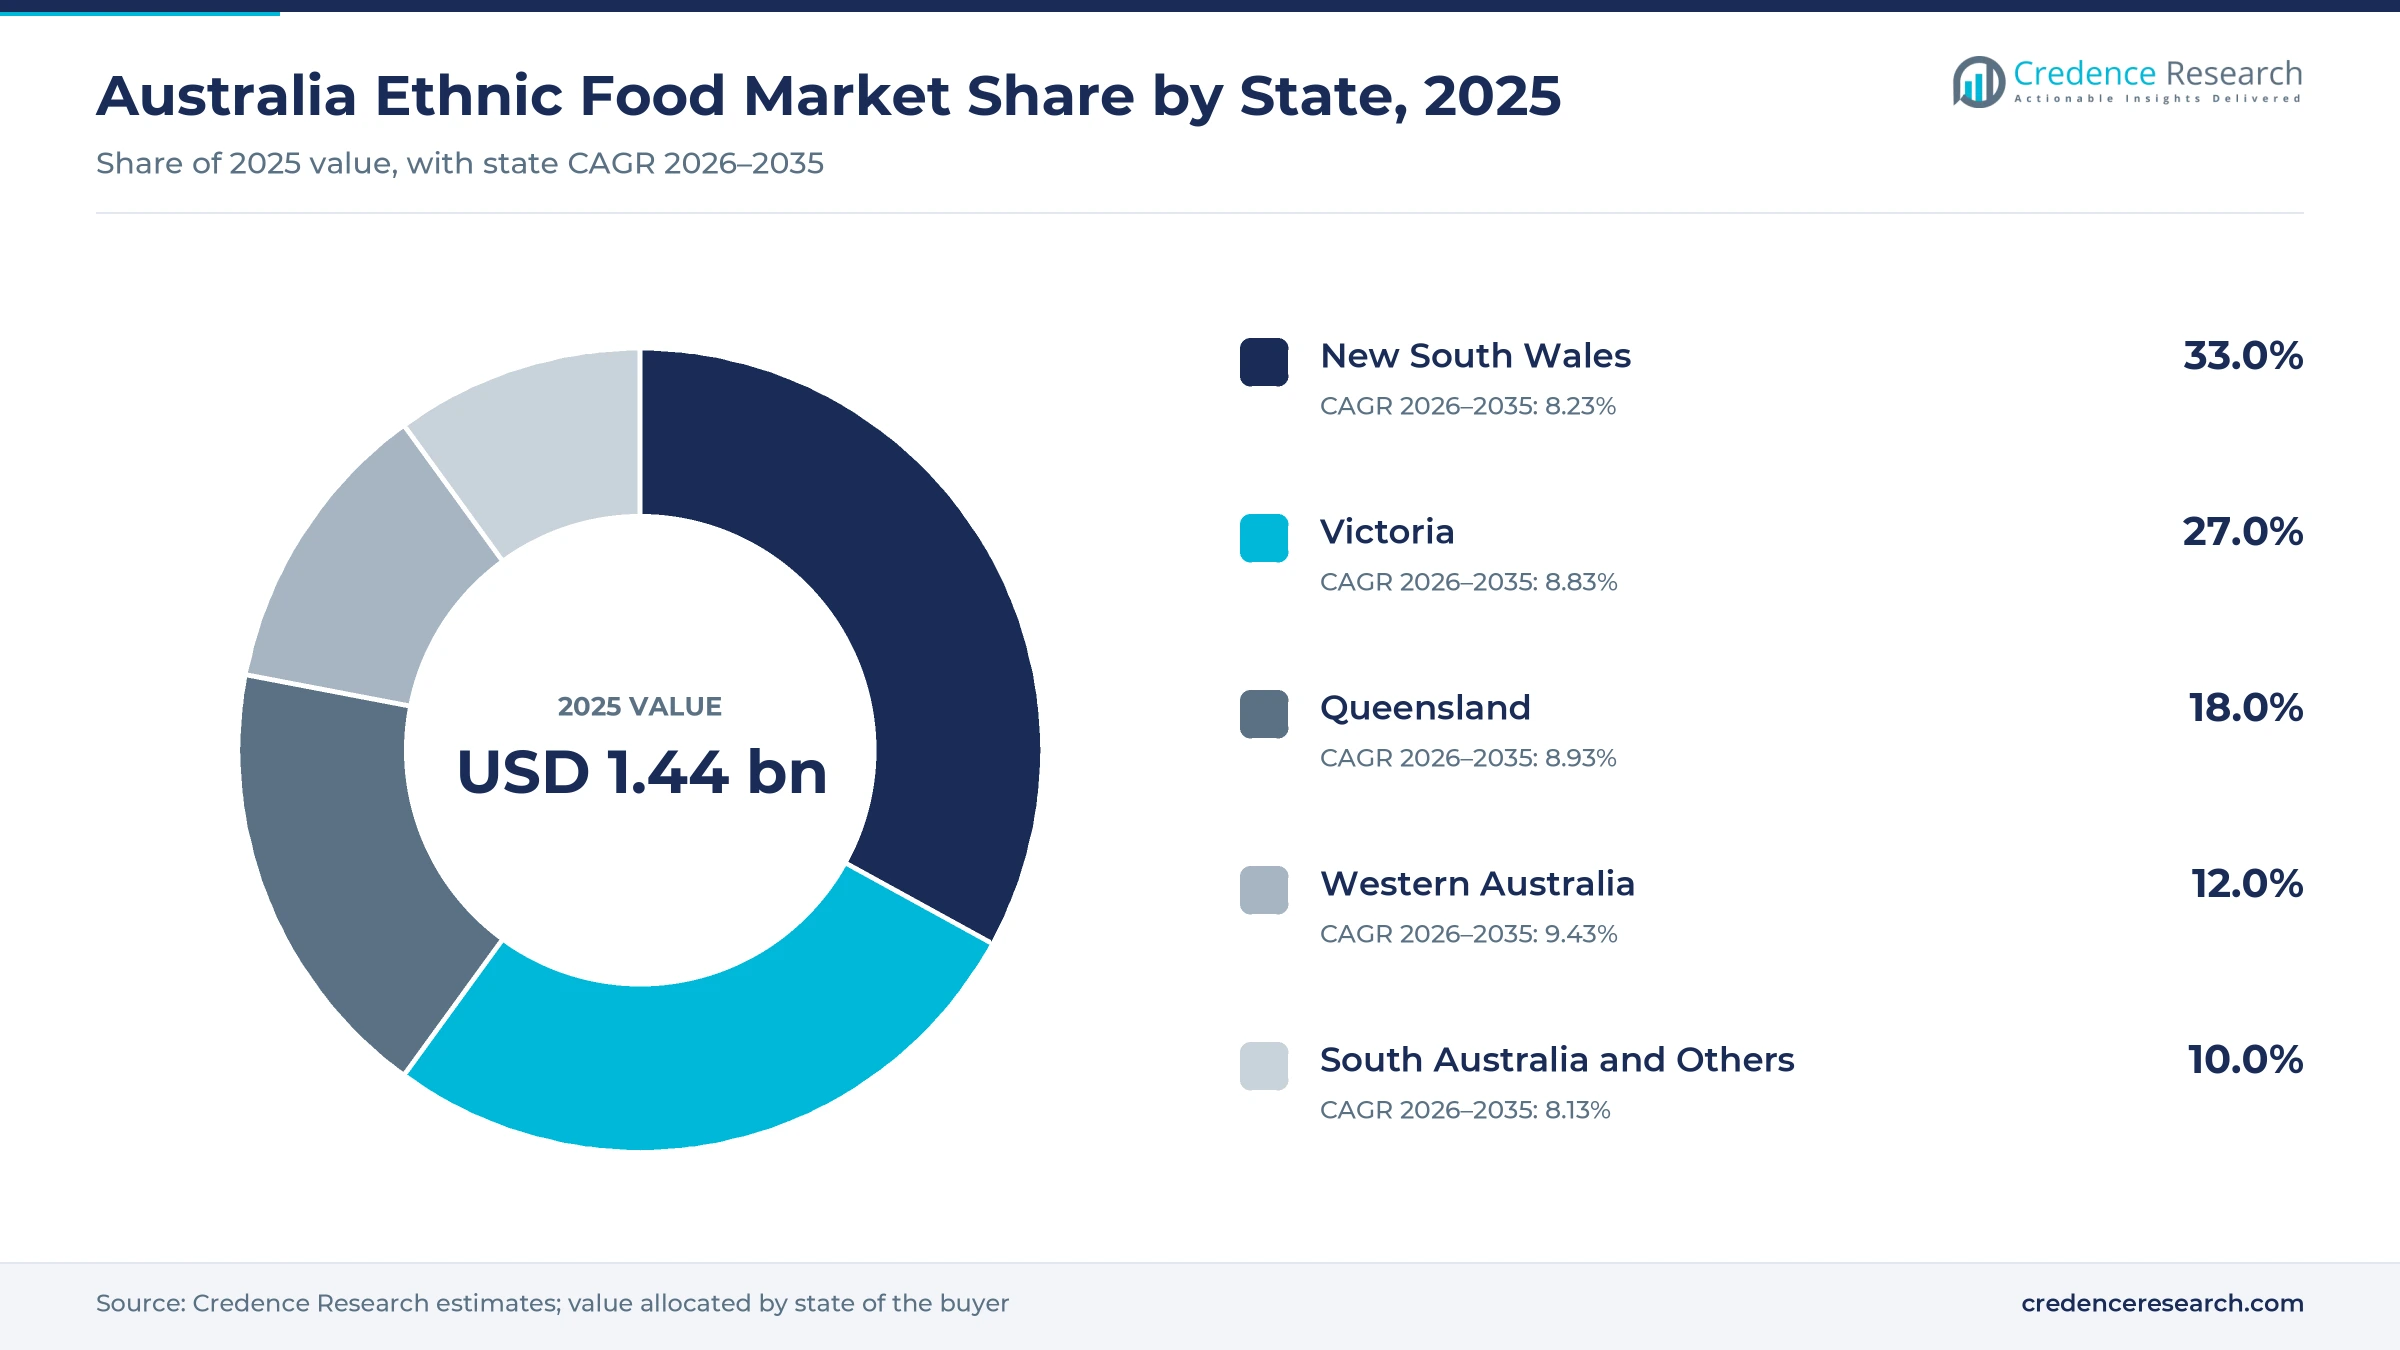
- New South Wales held 33.0% of 2025 value, while Western Australia grows fastest at 9.43% a year on the country's quickest population growth.
- Chinese Cuisine led cuisine types with 26.4% in 2025, and Sauces and Condiments led products with 23.1% on the strength of home cooking.
- Woolworths added more than 70 new or refreshed Italian, Mexican and Asian own-label products in March and April 2026, pushing authentic-style lines toward value pricing.
- Sanquan, Nissin and CJ have each committed capital to Australian dumpling supply since 2023, shifting frozen competition from imports toward local production by Asian multinationals.
Chinese cuisine and sauces anchor a broadening basket
Why does Chinese cuisine lead while Indian grows fastest?
Based on type, the market is categorized into Chinese, Indian, Southeast Asian, Mediterranean, Latin American and Middle Eastern cuisines plus others. Chinese Cuisine led with 26.4% of 2025 value, because Mandarin is the most common language other than English used at home, with 685,274 speakers in the 2021 Census according to the Australian Bureau of Statistics. Indian Cuisine grows fastest at 10.59% a year, as Coles reported in May 2025 that its Indian grocery range had expanded by almost 60% over two years. Its Indian shopper base also grew 34% in the latest 12 months, the fastest of any customer base in its grocery aisles.
Why do sauces lead and frozen lines gain?
Based on product, the market is categorized into sauces and condiments, frozen ethnic food, rice, noodles, snacks, spices and herbs, beverages and others. Sauces and Condiments led with 23.1% of 2025 value, because Coles said in 2024 that shoppers eating out less were cooking takeaway-style meals at home, which relies on pastes, dressings and sauces. Frozen Ethnic Food grows fastest at 10.45% a year, as CJ Foods Oceania invested AUD 10 million in a contract plant making 3,500 metric tons of Bibigo dumplings a year, according to Just Food in June 2023.
Why does ambient product hold the largest share?
Based on storage type, the market is categorized into ambient shelf stable, frozen and fresh and chilled products. Ambient Shelf Stable led with 58.0% of 2025 value, because rice, noodles, sauces and spices all travel unrefrigerated, and India, China and Thailand supplied 33.1% of food lines inspected at the border in 2024, according to the Department of Agriculture. Frozen grows fastest at 10.08% a year, as Nissin paid AUD 33.7 million in October 2024 for frozen dumpling maker ABC Pastry to serve national retailers, according to Food Processing.
Why do supermarkets dominate while online grows quickly?
Based on distribution channel, the market is categorized into supermarkets and hypermarkets, foodservice outlets, specialty stores and pure online retail. Supermarkets and Hypermarkets led with 58.0% of 2025 value, because Woolworths held 38.7% and Coles 29.5% of grocery retail in 2025, according to the U.S. Department of Agriculture. Pure Online Retail grows fastest at 11.22% a year, as food e-commerce took only 6% of retail in 2024, which leaves room for online grocery and last-mile delivery specialists serving migrant households.
| Segment Group | Leading Sub-segment | Share, 2025 | Fastest-growing Sub-segment | CAGR, 2026–2035 |
|---|---|---|---|---|
| By Type | Chinese Cuisine | 26.4% | Indian Cuisine | 10.59% |
| By Product | Sauces and Condiments | 23.1% | Frozen Ethnic Food | 10.45% |
| By Storage Type | Ambient Shelf Stable | 58.0% | Frozen | 10.08% |
| By Distribution Channel | Supermarkets and Hypermarkets | 58.0% | Pure Online Retail | 11.22% |
Request a Free Sample
Fill in your details and we'll send you a free sample report.
- Sample data tables & charts
- Research methodology
Migration and supermarket ranges carry the growth case
Record overseas-born population widens the core buyer base
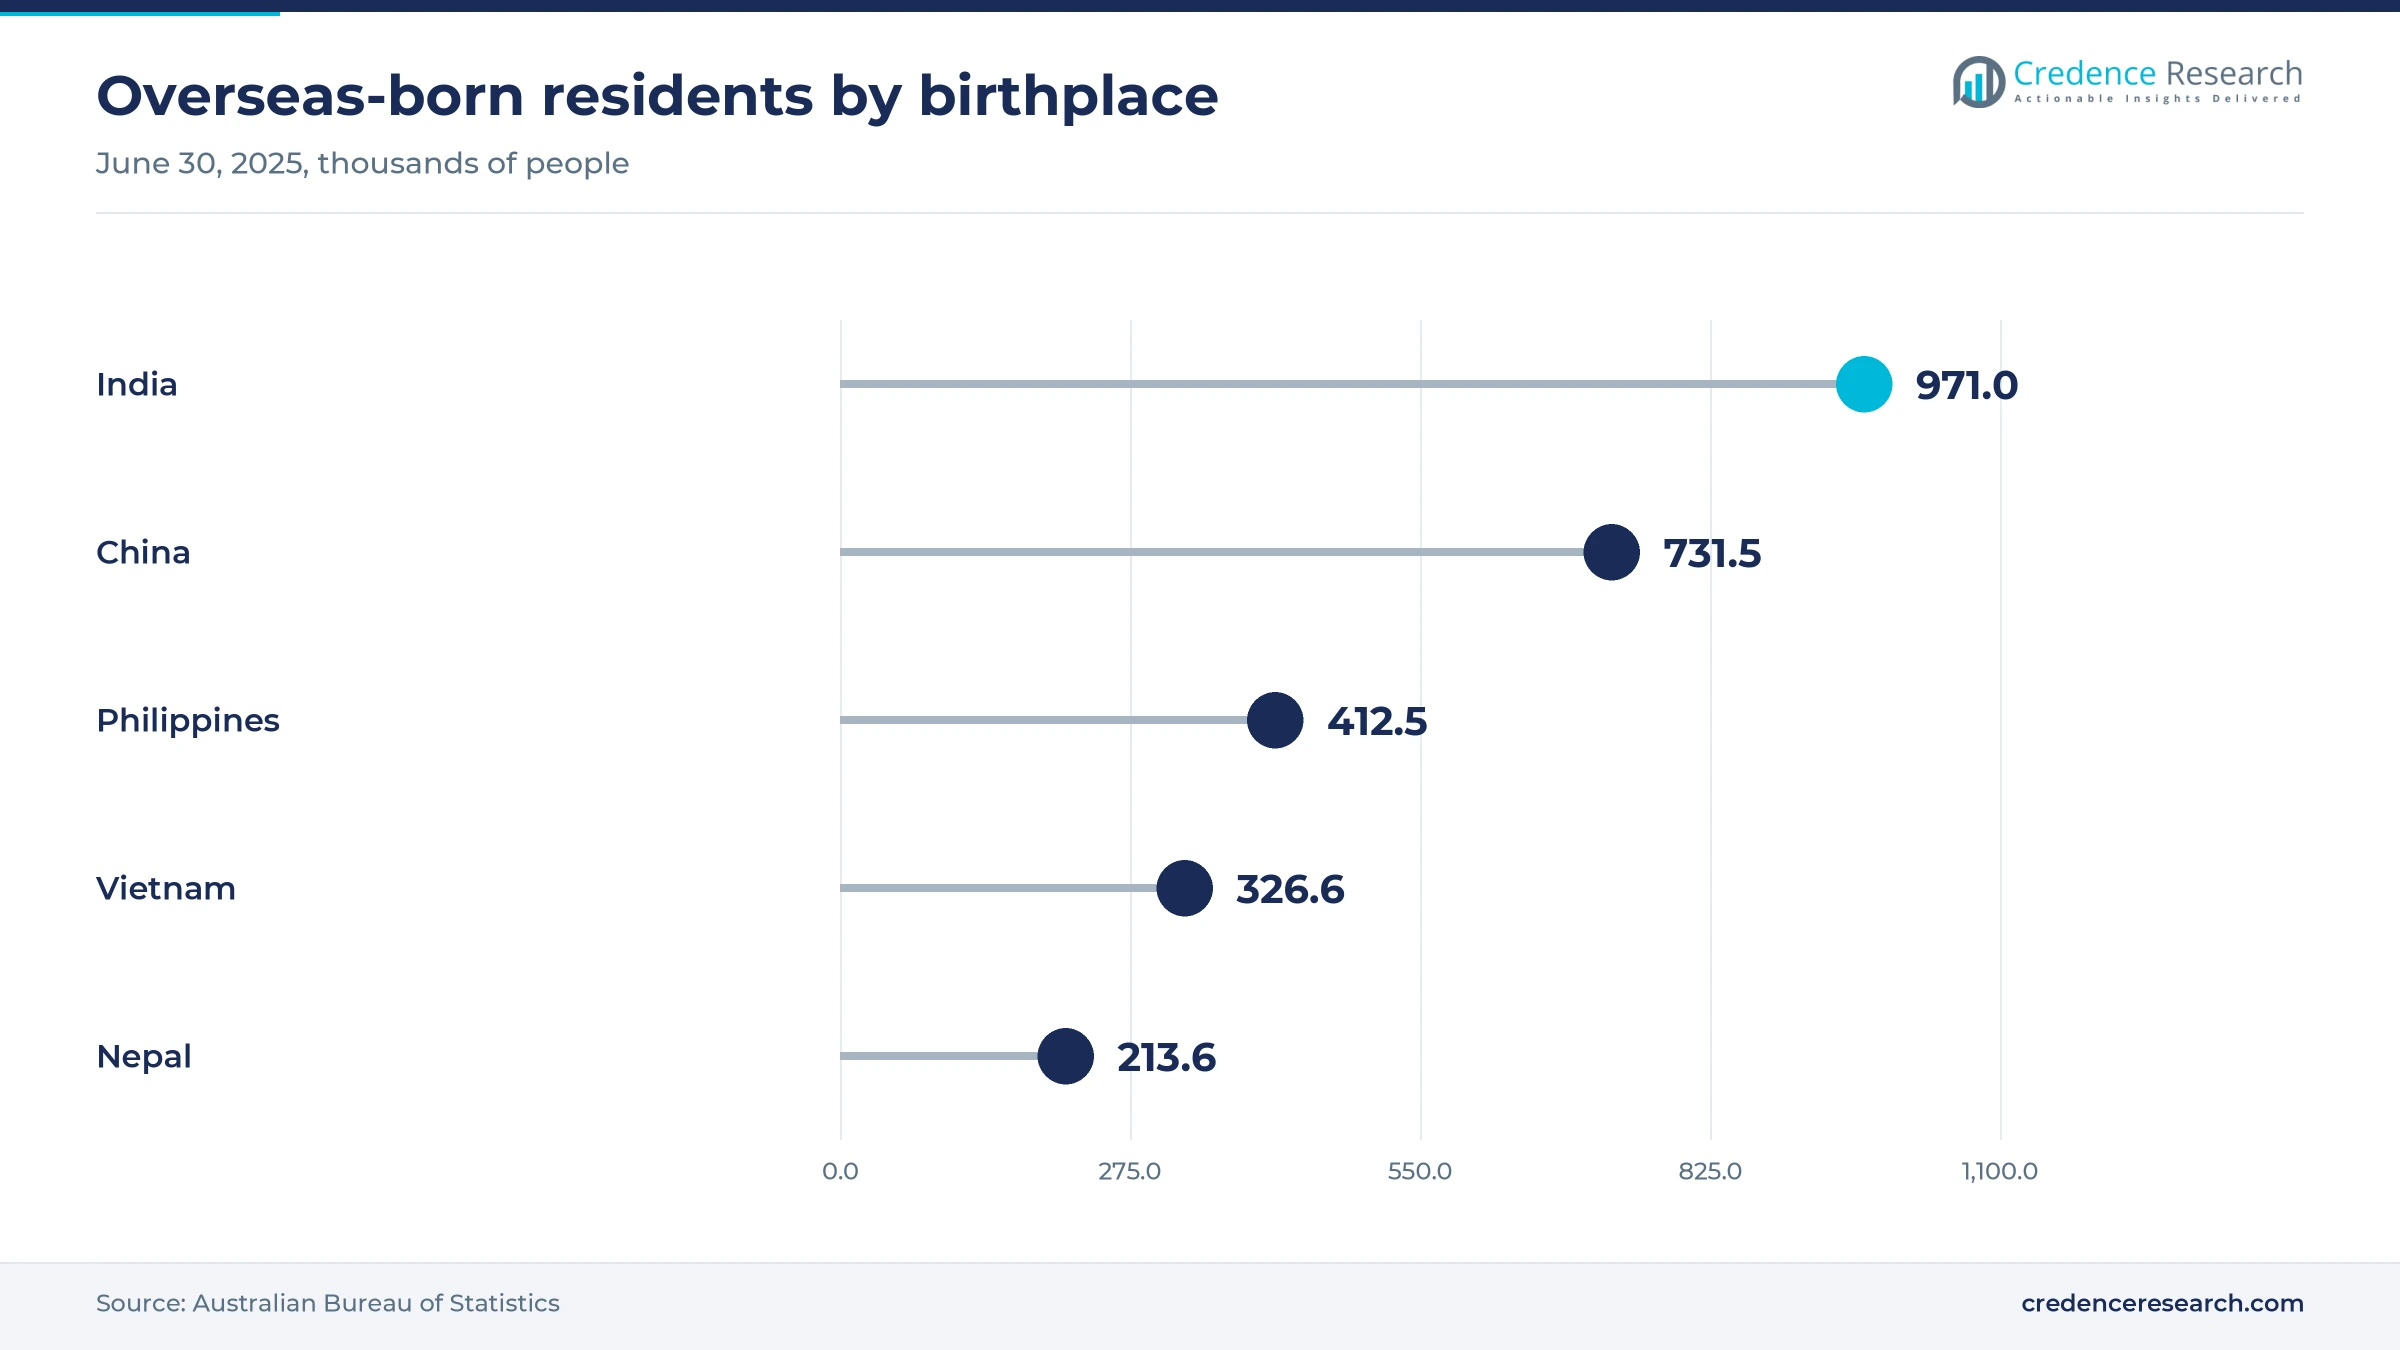
Migration has created a large core group of households that buy these products every week rather than occasionally. Australia counted 8.8 million overseas-born residents at June 30, 2025, or 32.0% of the population, according to the Australian Bureau of Statistics. India-born residents reached 971,020, China-born 731,540, Philippines-born 412,530 and Vietnam-born 326,630 in that release, which gives each cuisine a substantial domestic buyer group. In addition, the 2021 Census recorded 239,033 Punjabi speakers, up 80.4% in five years, and Nepal-born residents rose 123.7%. As a result, suppliers can justify national ranges for cuisines that once sold only through independent grocers in a few suburbs.
Supermarket range expansion moves products into main aisles
Mainstream grocers now treat these cuisines as a growth category, which brings them to shoppers outside migrant communities. Coles launched the 15-item Arth range with chef Sanjeev Kapoor in May 2025 across 440 stores, with each product priced at AUD 6 or less. Woolworths then added more than 70 new or refreshed products under La Gina, La Mesita and Lantern Alley in March and April 2026, according to Inside FMCG. Woolworths also told The New Daily in July 2024 that its ranges are tailored by store and that demand had accelerated. Because these two chains hold about two-thirds of grocery retail, a single listing decision can multiply a brand's national reach quickly.
Eating-out costs push households toward fakeaway cooking
Higher restaurant prices are moving spending toward products that recreate takeaway meals at home. The Australian Bureau of Statistics reported that meals out and takeaway food rose 3.9% in the 12 months to September 2026, against 3.2% for food and non-alcoholic beverages. That gap follows the pattern Coles described to The New Daily in July 2024, when it reported customers eating out less and a rise in fakeaway cooking over the previous 12 to 18 months. Queensland University of Technology retail expert Gary Mortimer linked the shift to living costs, migration and cooking shows. In turn, pastes and sauces benefit, which helps explain why Sauces and Condiments holds 23.1% of value.
Delivery apps make global dishes the everyday order
Delivery platforms show how ordinary these cuisines have become, and that familiarity carries over to retail baskets. Garlic naan, butter chicken, special fried rice, pad thai and dim sum all ranked in the top 10 foods ordered on DoorDash in Australia in 2024, according to its merchant report. Uber Eats reported on Nov. 24, 2025, that pad thai was the top dish in New South Wales and the Australian Capital Territory, while naan ranked with garlic bread in South Australia and the Northern Territory. Guzman y Gomez also plans 32 Australian openings in fiscal 2026 toward a long-term goal of 1,000 restaurants, according to The Motley Fool in May 2026. Foodservice supply therefore adds volume while building trial for tortillas, salsas and curries.
Local dumpling plants and Korean brands redraw the aisle
Rise of local dumpling production by Asian multinationals
Asian food groups are moving from exporting to Australia toward making products there, which shortens frozen supply chains. Sanquan announced an AUD 280 million Australian plant in July 2025 with a research center for local products. Nissin agreed in October 2024 to buy ABC Pastry for AUD 33.7 million, according to Food Processing, and CJ funded a 3,500-ton dumpling line through a local partner, according to Just Food. These plants share cold-chain and retail logistics with frozen bakery products, so freezer space becomes more contested. As a result, Frozen Ethnic Food grows at 10.45% a year in the Credence Research model.
Shift of Korean brands from specialty stores to main aisles
Korean brands have moved quickly from Asian grocers into national chains, showing how quickly a national listing can change a category. Nongshim said Woolworths would stock Toomba Shin Ramyun across 1,100 stores from March 2025, and Woolworths said Nongshim sales there nearly doubled in the previous year, according to Korea JoongAng Daily. Seven Bibigo dumpling, rice ball, corn dog and waffle lines reached Coles nationally in November 2024, taking the brand to over half of mainstream stores, according to Food and Drink Business. This competition now reaches well beyond instant noodles and into supermarket freezers. Because national listings now arrive within a few seasons of launch, older suppliers must refresh packs and flavors more often.
Opportunity in South Asian ready meals and pastes
South Asian households offer the clearest opening, since their numbers are growing faster than local product choice. Nepal-born residents reached 213,580 at June 2025, according to the Australian Bureau of Statistics, and India is now the largest overseas birthplace group. Coles measured the fastest customer growth in its grocery aisles for its Indian range, at 34% in 12 months to May 2025. Patak's launched portion-sized curry paste pots through Woolworths and IGA in May 2018, according to C-Store. However, few suppliers yet offer regional dishes such as khichdi at the AUD 6 price Coles set for Arth. Suppliers with regional recipes and local chilled or frozen production could therefore capture Indian Cuisine growth of 10.59% a year.
Opportunity in Latin American and Middle Eastern ranges
Latin American and Middle Eastern lines remain smaller, which leaves an opening for brands that can lift them beyond taco kits and flatbread. Woolworths' La Mesita range now covers taco kits, seasonings, tortillas, salsas and simmer sauces, within a program of more than 70 products. Guzman y Gomez targets 1,000 Australian restaurants, according to The Motley Fool in May 2026, and tortilla production has been local since Gruma bought Rositas Investments in January 2006 for AUD 17.6 million, according to Food Ingredients First. On the Middle Eastern side, the 2021 Census counted 367,159 Arabic speakers, the second most common language other than English. The New Daily also reported halal and kosher lines among the specialized ranges supermarkets now stock.
Compliance, retail power and rice supply squeeze suppliers
Border inspections add risk for Asian imports
Imported products carry a compliance cost that local rivals avoid. The Department of Agriculture inspected 49,710 food lines in 2024, with China at 15.4% and Thailand at 9.3% of lines, and brown seaweed passed only 88.8% of iodine tests. Small importers bear holding costs and possible destruction when a line fails. Instant noodles with undeclared allergens also appear among the international notifications in that report, so importers have reason to test batches before shipping and request supplier certificates.
Two supermarket chains set listing terms
Concentrated grocery buying limits the margin available to small brands. Woolworths and Coles together held 68.2% of grocery retail in 2025, according to U.S. Department of Agriculture data, and the Australian Competition and Consumer Commission published its supermarkets inquiry final report on March 21, 2025. Niche suppliers therefore face strong pressure on price and promotions, and own-label lines such as Lantern Alley now compete directly. Many respond by building independent Asian grocer and online sales before seeking national listings.
Tight rice crop raises sourcing exposure
Rice suppliers face a smaller domestic crop and rely more on Asian sourcing. ABARES forecasts Australian production falling 22% to 139,000 metric tons in 2026-27, according to Grain Central in September 2026. SunRice met 1.5 million metric tons of demand in the year to April 30, 2026, with only 511,000 metric tons from Australian supplies. Exposure to Vietnam, India, Pakistan and Thailand therefore affects cost and availability, and brands respond by spreading origins across more countries.
Slower migration trims new household formation
Growth assumptions depend on arrivals, and arrivals have fallen from their recent peak. Net overseas migration was 305,600 in the year to June 2025, down 28.8% from the previous year, according to the Australian Bureau of Statistics. Further cuts would reduce the number of new core buyers arriving each year. As a result, suppliers relying only on recent migrants risk slower sales, and many are broadening packaging and recipes toward mainstream shoppers to offset that exposure.
Sydney and Perth migrant bases set the state pattern
| State | Value, 2025 (USD billion) | Share, 2025 | CAGR, 2026–2035 |
|---|---|---|---|
| New South Wales | 0.48 | 33.0% | 8.23% |
| Victoria | 0.39 | 27.0% | 8.83% |
| Queensland | 0.26 | 18.0% | 8.93% |
| Western Australia | 0.17 | 12.0% | 9.43% |
| South Australia and Others | 0.14 | 10.0% | 8.13% |
New South Wales leads on Sydney's Chinese community
New South Wales held 33.0% of 2025 value and grows at 8.23% a year, with 8,593,900 residents at June 2025 according to the Australian Bureau of Statistics. China is its largest overseas birthplace, at 261,330 people in Census-based data reported by PropTrack in April 2025. Sydney suburbs such as Chatswood, Kingsford and Macquarie Park draw large migrant inflows, which supports independent Asian grocers. Uber Eats also named pad thai as the state's top dish in 2025, and this shows reach beyond migrant households.
Victoria grows on Melbourne's Indian-born households
Victoria held 27.0% of value and grows at 8.83% a year, with 7,074,500 residents growing 1.8% in the year to June 2025 according to the Australian Bureau of Statistics. India is the state's largest overseas birthplace at 272,250 people, according to PropTrack. Melbourne received 121,240 overseas arrivals in 2023-24, slightly more than Sydney, which feeds demand around migrant-heavy suburbs such as Clayton and Box Hill. Consequently, Victoria should carry much of the growth in Indian ranges.
Queensland demand builds through population growth
Queensland held 18.0% of value and grows at 8.93% a year, supported by 5,669,800 residents growing 1.8% in the year to June 2025. Its overseas-born share was lower at 22.7% in 2021, according to the Australian Bureau of Statistics, so mainstream shoppers matter more here than in the southern states. Brisbane received 44,259 overseas arrivals in 2023-24, according to PropTrack. As a result, supermarket ranges and delivery apps carry more of the trial, while local producers such as Gourmet Garden in Palmwoods supply herb pastes from within the state.
Western Australia grows fastest on migrant share
Western Australia held 12.0% of value and is the fastest-growing state at 9.43% a year. Its population grew 2.2% to 3,043,700 in the year to June 2025, the fastest of any state or territory, according to the Australian Bureau of Statistics. PropTrack reported a 34.1% overseas-born share, the highest it listed among the states, and Perth received 53,414 overseas arrivals in 2023-24. Because long distances raise frozen freight costs, local stocks and Perth branches of importers such as JFC Australia matter here.
South Australia and smaller territories offer selective growth
South Australia and Others held 10.0% of value and grow at 8.13% a year, reflecting small populations outside the main migrant destinations. South Australia counted 1,902,300 residents at June 2025, and 24.0% were overseas-born in 2021, according to the Australian Bureau of Statistics. Tasmania had the lowest overseas-born share at 16.3%, according to PropTrack. However, Uber Eats ranked naan with garlic bread as a top order in South Australia and the Northern Territory in 2025, so demand exists where ranges are available.
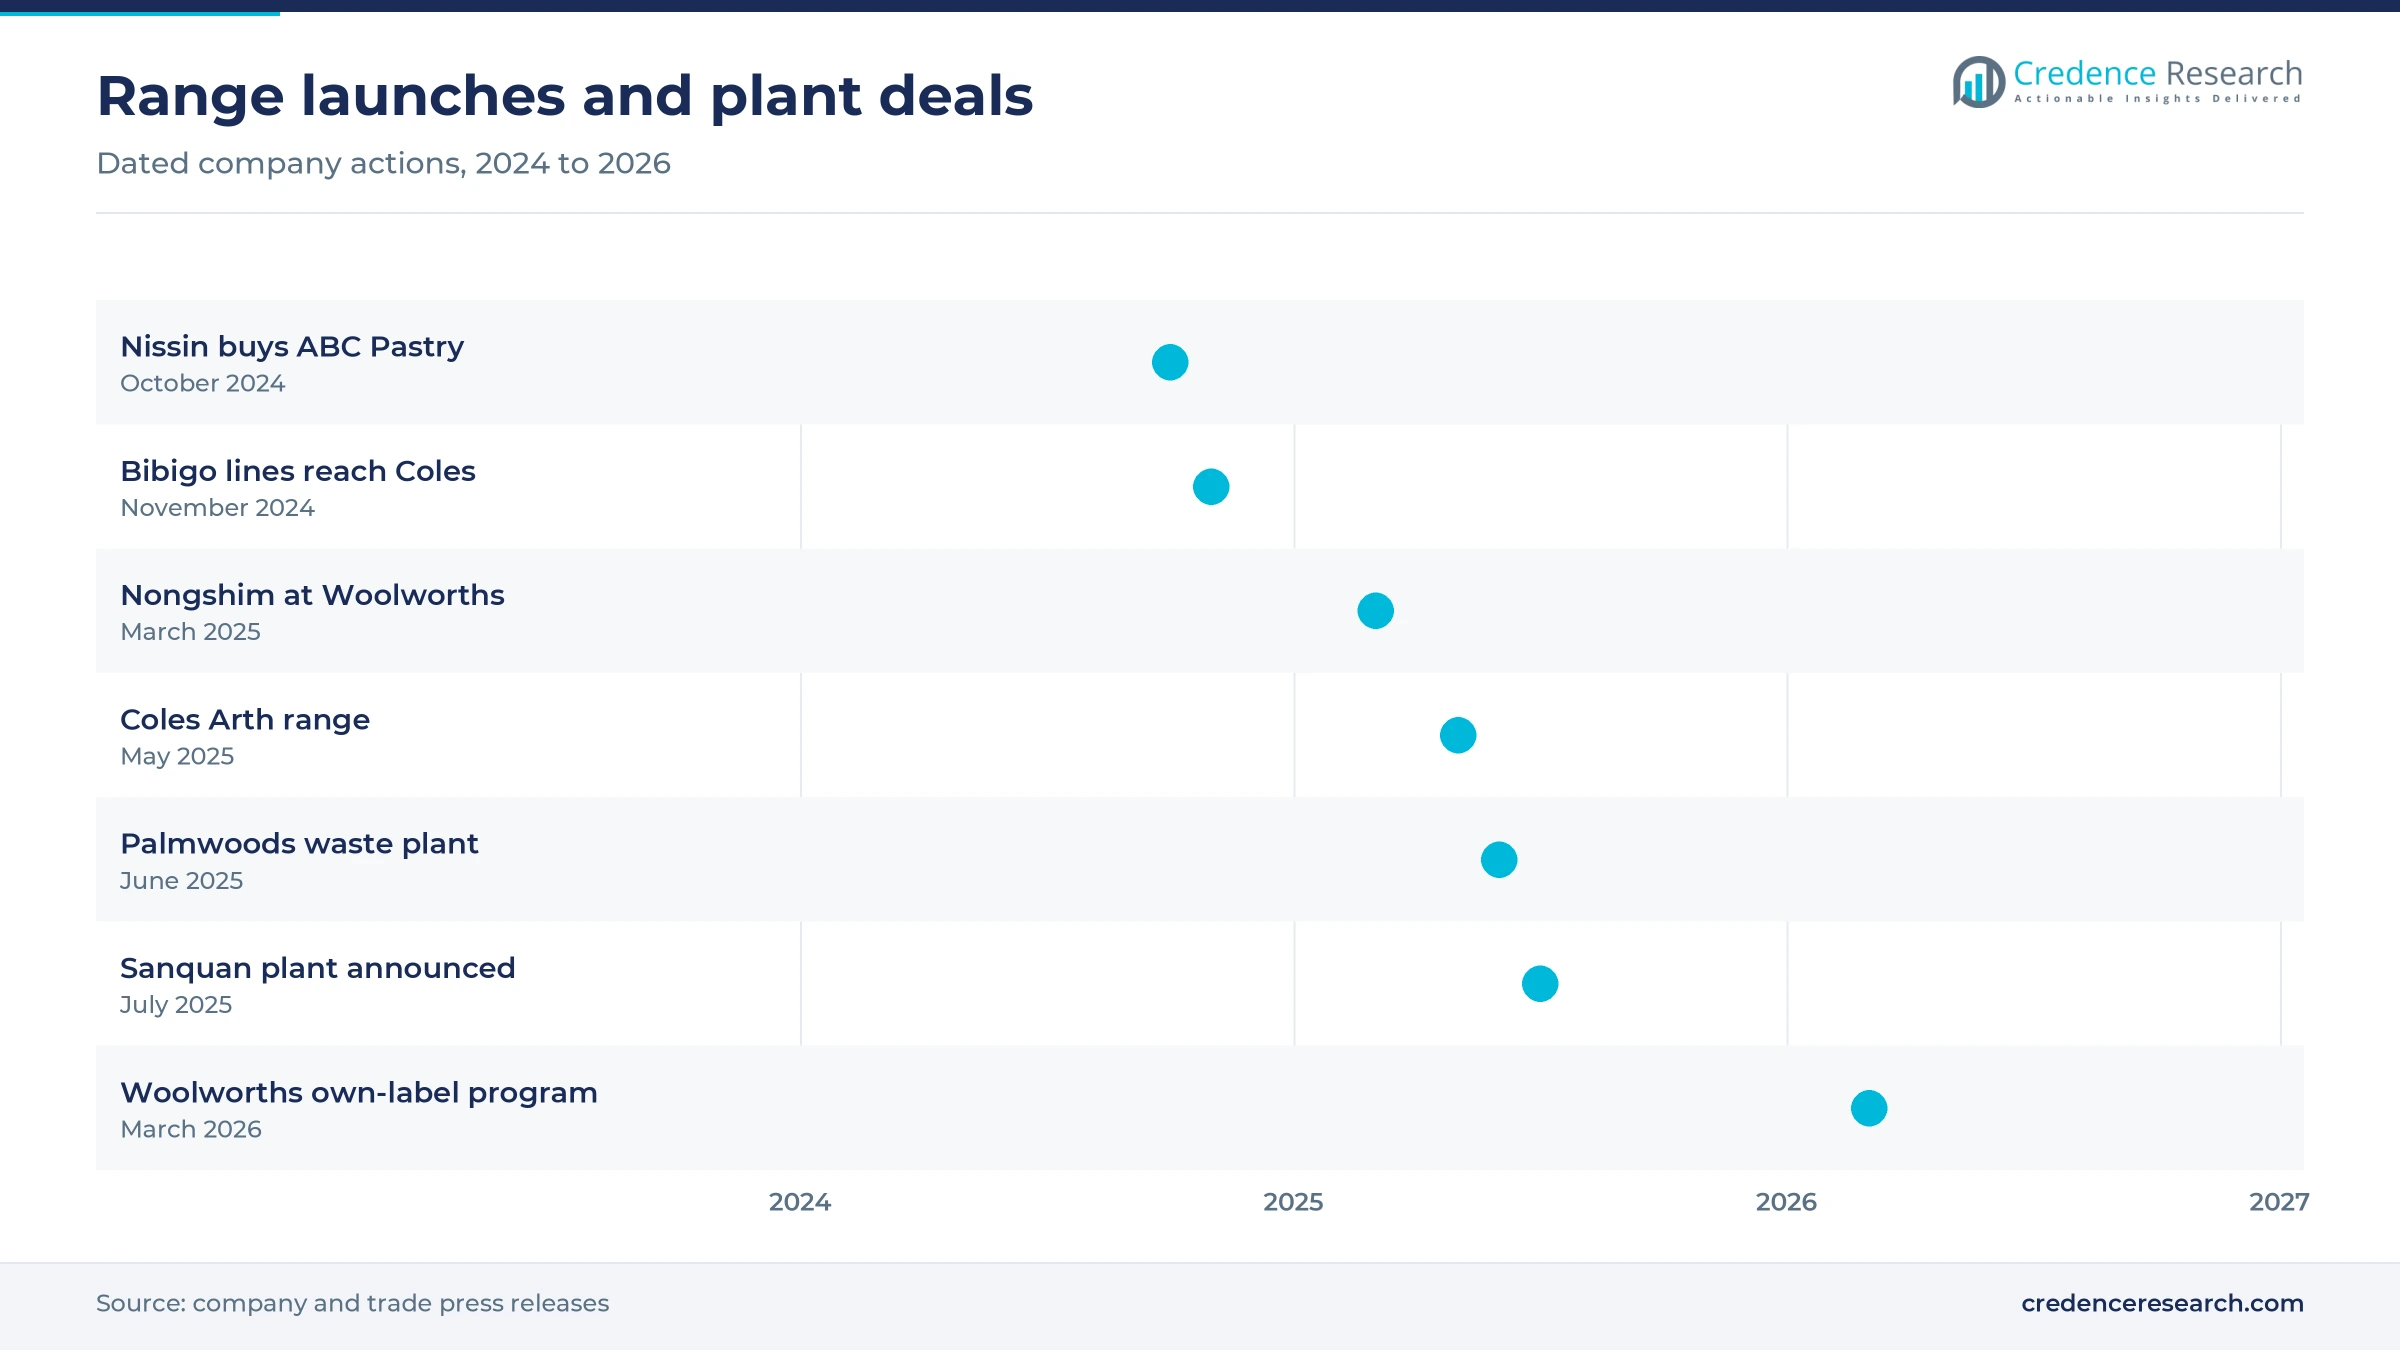
Launches and plant deals since 2024
| Development | Status and market relevance |
|---|---|
| In March 2026, Woolworths began rolling out more than 70 new or refreshed La Gina, La Mesita and Lantern Alley products, with Lantern Alley following in April. | Under way; own-label pressure on branded Italian, Mexican and Asian lines. |
| In July 2025, Sanquan announced an AUD 280 million Australian frozen food plant with a research center. | Announced; no construction schedule was stated in the report. |
| In May 2025, Coles launched the 15-item Arth Indian range with chef Sanjeev Kapoor across 440 stores. | Live; every product is priced at AUD 6 or less. |
| In March 2025, Nongshim scheduled Toomba Shin Ramyun for sale across 1,100 Woolworths stores. | Announced Feb. 13, 2025; extends Korean noodles in the mainstream aisle. |
| In November 2024, CJ placed seven Bibigo frozen lines in Coles nationally. | Live; the brand then reached over half of mainstream stores. |
Plant and ordering tools change how products reach shoppers
- Dedicated dumpling lines let CJ, Nissin and Sanquan produce near customers, with the CJ partner line rated at 3,500 metric tons a year according to Just Food.
- Herb and paste processing at the Palmwoods base of Gourmet Garden added a trade waste plant in June 2025, handling 25 to 40 cubic meters of wastewater an hour according to Food Processing, and such pastes sit alongside the broader seasoning category.
- Third-party ordering apps shape cuisine trial, since 48% of consumers prefer them and order an average of 4.2 times a month according to DoorDash.
- Store-level range tailoring lets Woolworths match its international aisle to local communities, as its spokesperson told The New Daily in July 2024.
Need a Custom Version of This Report?
Tailor the scope, geography, or segments to your exact requirements.
- Custom geography or segment scope
- Direct access to our analyst team
Grocers, Asian multinationals and local makers compete
Competition runs across three tiers that increasingly overlap on the same shelves. National grocers Woolworths and Coles set the terms of the main aisle and now compete directly through own-label and exclusive ranges such as Lantern Alley and Arth. Asian multinationals including Nissin, CJ, Nongshim and Sanquan bring scale, recipes and advertising, and they increasingly pair imports with Australian production to protect freezer availability and freshness. Established local manufacturers and brand owners hold the third tier. SunRice sells rice sourced from Australia and across Asia, Simplot owns Leggo's and Chiko, and McCormick makes Gourmet Garden in Queensland. Distributors such as JFC Australia, which describes itself as a leading Japanese food supplier, keep restaurants and independent grocers stocked. The main contest over the next few years is local frozen capacity, followed by access to the Indian and Southeast Asian shopper as ranges widen.
Grocers, importers and brand owners active in these cuisines
| Company | Type | Role in the market |
|---|---|---|
| Woolworths Group | National grocer | Own-label La Gina, La Mesita and Lantern Alley ranges with over 70 products in 2026 |
| Coles Group | National grocer | Exclusive Arth Indian range in 440 stores and a separate Indian aisle category |
| SunRice | Rice brand and processor | Sells Thai jasmine and other styles, sourcing from Australia and seven Asian countries |
| Simplot Australia | Local manufacturer | Owns Leggo's, Chiko, Chicken Tonight and Raguletto across sauces and frozen snacks |
| McCormick (Gourmet Garden) | Local producer | Makes herb and spice pastes at Palmwoods, Queensland |
| Nissin Foods (ABC Pastry) | Asian multinational | Bought the frozen dumpling maker for AUD 33.7 million in 2024 |
| CJ Foods Oceania | Asian multinational | Bibigo dumplings and a contract line of 3,500 metric tons a year |
| Nongshim | Asian multinational | Shin Ramyun across 1,100 Woolworths stores |
| JFC Australia | Importer and wholesaler | Supplies Japanese foods to retail and restaurants through state branches |
| Patak's (AB World Foods) | Brand owner | Curry pastes, including portion-sized pots launched at Woolworths and IGA in 2018 |
Indian and frozen lines hold the strongest growth case
Credence Research's view is that the category's best growth lies where migrant demand and local production meet, rather than in further imported ambient lines. Frozen dumplings already have committed capital from three Asian groups, and Indian grocery has the fastest shopper growth Coles has measured in its aisles. Buyers should expect more own-label pressure on sauces, since Woolworths has shown it can launch more than 70 items in one program. Suppliers without a clear cuisine story or local cost base will find listings harder to keep, while specialists with regional recipes can still win distinct space.
How the market values and estimates were built
The report uses 2025 as the base year and 2035 as the forecast year, with market values taken from the Credence Research model. The earlier published 2024 estimate was carried forward one year at its own 8.66% rate, and then checked against national food retail spending and related category values. Segment and state splits are Credence Research estimates, informed by population, migration, retail share and company announcements. Sources include government statistics, regulatory reports, company releases and trade press, and no interviews or surveys were conducted for this edition.
Frozen capacity and migration shape demand through 2035
Through 2035, the category is expected to grow faster than overall grocery spending, as Australia keeps adding migrant households and mainstream shoppers keep cooking takeaway-style meals at home. Frozen and Indian lines should gain the most share, supported by new plants and wider supermarket ranges. Sauces and rice remain large but grow more slowly, partly because own-label competition and sourcing costs limit pricing. Migration policy is the main swing factor, since net arrivals already fell 28.8% in the year to June 2025. Even so, by 2035 the value reaches USD 3.31 billion, with today's specialty lines increasingly treated as everyday staples.
Frequently Asked Questions
How big is the Australia ethnic food market?
What share does Asian food hold in Australia?
How do sauces and seasonings fit into this market?
What is happening in frozen and convenience foods?
How does foodservice relate to the market?
What are Coles and Woolworths doing in ethnic food?
Which state leads the market?
What are the main risks for suppliers?
Table of Content
Chapter 1 Market Segmentation
- 1.1 Segmentation Framework
- 1.1.1 Product and Service Classification
- 1.1.2 Application and End-Use Classification
- 1.1.3 Technology and Solution Classification
- 1.1.4 Customer and Distribution Channel Classification
- 1.1.5 Geographic Segmentation
- 1.1.6 Market Segment Definitions and Boundaries
- 1.2 By Type
- 1.2.1 Chinese Cuisine
- 1.2.2 Indian Cuisine
- 1.2.3 Southeast Asian Cuisine
- 1.2.4 Mediterranean Cuisine
- 1.2.5 Latin American Cuisine
- 1.2.6 Middle Eastern Cuisine
- 1.2.7 Others
- 1.3 By Product
- 1.3.1 Sauces and Condiments
- 1.3.2 Frozen Ethnic Food
- 1.3.3 Rice
- 1.3.4 Noodles
- 1.3.5 Snacks
- 1.3.6 Spices and Herbs
- 1.3.7 Beverages
- 1.3.8 Others
- 1.4 By Storage Type
- 1.4.1 Ambient Shelf Stable
- 1.4.2 Frozen
- 1.4.3 Fresh and Chilled
- 1.5 By State
- 1.5.1 New South Wales
- 1.5.2 Victoria
- 1.5.3 Queensland
- 1.5.4 Western Australia
- 1.5.5 South Australia and Others
Chapter 2 Introduction
- 2.1 Report Objectives and Scope
- 2.2 Product Definition and Industry Terminology
- 2.3 Market Inclusions and Exclusions
- 2.4 Research Process
- 2.4.1 Primary Research and Expert Interviews
- 2.4.2 Secondary Research and Source Review
- 2.4.3 Top-Down and Bottom-Up Estimation
- 2.4.4 Data Triangulation and Verification
- 2.5 Market Size Measurement Basis
- 2.5.1 2025: USD 1.44 billion → 2035: USD 3.31 billion
- 2.6 Historical and Forecast Reference Periods
- 2.6.1 Historical Period: 2018-2025
- 2.6.2 Base Year: 2025
- 2.6.3 Forecast Period: 2025-2035
- 2.7 Research Assumptions and Limitations
Chapter 3 Executive Summary
- 3.1 Market Snapshot and Key Findings
- 3.2 Base-Year Market Size, 2025
- 3.3 Forecast Market Size, 2035
- 3.4 Revenue and Volume Growth Outlook
- 3.5 Key Demand and Supply Indicators
- 3.6 Leading Market Segments
- 3.7 Fastest-Growing Market Opportunities
- 3.8 Regional Performance Highlights
- 3.9 Technology and Industry Transformation
- 3.10 Competitive Landscape Summary
- 3.11 Analyst View and Strategic Implications
Chapter 4 Australia Ethnic Food Market Trends and Developments
- 4.1 Historical Industry Development, 2018-2025
- 4.2 Recent Market Trends and Developments
- 4.3 Demand and Customer Behavior Trends
- 4.4 Technology and Product Innovation
- 4.5 Artificial Intelligence, Automation and Digitalization
- 4.6 Local Manufacturing and Supply Chain Realignment
- 4.7 Industry Partnerships, Mergers and Acquisitions
- 4.8 Sustainability and Circular Economy Developments
- 4.9 Government and Private Sector Investment Trends
- 4.10 Emerging Business Models and Commercialization
- 4.11 Industry Developments and Announcements
Chapter 5 Australia Ethnic Food Market Production, Supply and Demand Analysis
- 5.1 Demand Trend and Consumption Analysis, 2018-2025
- 5.2 Demand Forecast, 2025-2035
- 5.3 Production and Output Trend, 2018-2025
- 5.4 Production and Output Forecast, 2025-2035
- 5.5 Installed Capacity and Capacity Utilization
- 5.6 Company-Wise Production Plants and Statistics
- 5.6.1 Installed Production Capacity
- 5.6.2 Actual Production
- 5.6.3 Planned Capacity and Expansion Targets
- 5.7 Supply Chain Structure and Procurement Trends
- 5.8 Supply-Demand Gap and Bottlenecks
- 5.9 Import Dependence and Sourcing Structure
- 5.10 Contract Manufacturing and Outsourcing
- 5.11 Regional Supply and Demand Concentration
Chapter 6 Australia Ethnic Food Market Pricing Analysis
- 6.1 Pricing Structure and Measurement
- 6.2 Historical Pricing Trends, 2018-2025
- 6.3 Pricing Outlook, 2025-2035
- 6.4 Average Selling Price and Unit Economics
- 6.5 Pricing by Product and Market Segment
- 6.6 Geographic Pricing Differences
- 6.7 Key Input, Energy, Labor and Logistics Costs
- 6.8 Contract Pricing and Purchasing Models
- 6.9 Pricing Sensitivity and Competitive Positioning
- 6.10 Price, Margin and Profitability Implications
Chapter 7 Australia Ethnic Food Market Dynamics
- 7.1 Market Growth Drivers
- 7.1.1 Demand-Side Drivers
- 7.1.2 Technology and Innovation Drivers
- 7.1.3 Infrastructure and Investment Drivers
- 7.1.4 Regulatory and Policy Drivers
- 7.2 Market Restraints
- 7.2.1 Cost and Affordability Constraints
- 7.2.2 Technology and Adoption Barriers
- 7.2.3 Supply Chain and Operational Constraints
- 7.3 Market Challenges
- 7.3.1 Competitive Pressure and Margin Erosion
- 7.3.2 Skills, Infrastructure and Implementation Gaps
- 7.4 Emerging Market Opportunities
- 7.5 Market Dynamics Impact and Time-Horizon Assessment
Chapter 8 Australia Ethnic Food Value Chain Analysis
- 8.1 Industry Value Chain Overview
- 8.2 Upstream Suppliers and Critical Inputs
- 8.3 Technology and Component Providers
- 8.4 Manufacturing or Service Delivery
- 8.5 Distribution, Channel Partners and Integrators
- 8.6 Downstream Applications and End Users
- 8.7 Value Addition and Profit Pools
- 8.8 Vertical Integration and Outsourcing
- 8.9 Supplier Concentration and Risk
- 8.10 Supply Chain Localization and Resilience
Chapter 9 Australia Ethnic Food Market Regulations and Policies
- 9.1 Relevant Laws, Standards and Compliance Frameworks
- 9.2 Product, Service, Safety and Quality Requirements
- 9.3 Government Policies, Incentives and Subsidies
- 9.4 Imports, Exports and Trade Barriers
- 9.5 Public Procurement and Local Content Requirements
- 9.6 Environmental and Sustainability Compliance
- 9.7 Upcoming Policy Changes and Market Implications
Chapter 10 Australia Ethnic Food Market Hotspots and Opportunities
- 10.1 Market Opportunity Mapping and Growth Hotspots
- 10.2 High-Growth Applications and Customer Groups
- 10.3 Underserved Markets and White-Space Opportunities
- 10.4 Emerging Technology and Product Opportunities
- 10.5 New Capacity and Investment Hotspots
- 10.6 Market Entry and Expansion Opportunities
- 10.7 Distribution and Partnership Opportunities
- 10.8 Near-Term and Long-Term Commercial Potential
- 10.9 Opportunity Attractiveness and Execution Risks
Chapter 11 Australia Ethnic Food Market Outlook, 2025-2035
- 11.1 Market Size and Analysis
- 11.1.1 Revenue (Market Measurement: 2025: USD 1.44 billion → 2035: USD 3.31 billion)
- 11.1.2 Market Volume and Quantity Sold
- 11.1.3 Historical Market Size, 2018-2025
- 11.1.4 Base-Year Market Size, 2025
- 11.2 Market Forecast, 2025-2035
- 11.2.1 Revenue Forecast to 2035
- 11.2.2 Volume Forecast to 2035
- 11.2.3 CAGR and Year-on-Year Growth
- 11.2.4 Incremental Revenue Opportunity
- 11.3 Forecast Assumptions and Scenario Analysis
- 11.3.1 Base-Case Forecast
- 11.3.2 Optimistic and Conservative Scenarios
- 11.3.3 Technology, Pricing and Policy Sensitivities
- 11.4 Market Attractiveness and Growth Outlook
Chapter 12 Australia Ethnic Food Market Segmentation and Outlook
- 12.1 Segmentation Summary and Market Shares, 2025
- 12.2 Largest and Fastest-Growing Segments
- 12.3 By Type - Market Size and Forecast, 2025-2035
- 12.3.1 Segment Definition and Scope
- 12.3.2 Historical Market Size, 2018-2025
- 12.3.3 Revenue Forecast, 2025-2035
- 12.3.4 Volume Forecast, 2025-2035
- 12.3.5 Base-Year Market Share, 2025
- 12.3.6 Segment CAGR and Growth Drivers
- 12.3.7 Subsegment Market Size and Forecast
- 12.3.7.1 Chinese Cuisine
- 12.3.7.2 Indian Cuisine
- 12.3.7.3 Southeast Asian Cuisine
- 12.3.7.4 Mediterranean Cuisine
- 12.3.7.5 Latin American Cuisine
- 12.3.7.6 Middle Eastern Cuisine
- 12.3.7.7 Others
- 12.3.8 Subsegment Pricing and Adoption Trends
- 12.3.9 Leading Suppliers and Competition
- 12.3.10 Regional Demand and Opportunities
- 12.4 By Product - Market Size and Forecast, 2025-2035
- 12.4.1 Segment Definition and Scope
- 12.4.2 Historical Market Size, 2018-2025
- 12.4.3 Revenue Forecast, 2025-2035
- 12.4.4 Volume Forecast, 2025-2035
- 12.4.5 Base-Year Market Share, 2025
- 12.4.6 Segment CAGR and Growth Drivers
- 12.4.7 Subsegment Market Size and Forecast
- 12.4.7.1 Sauces and Condiments
- 12.4.7.2 Frozen Ethnic Food
- 12.4.7.3 Rice
- 12.4.7.4 Noodles
- 12.4.7.5 Snacks
- 12.4.7.6 Spices and Herbs
- 12.4.7.7 Beverages
- 12.4.7.8 Others
- 12.4.8 Subsegment Pricing and Adoption Trends
- 12.4.9 Leading Suppliers and Competition
- 12.4.10 Regional Demand and Opportunities
- 12.5 By Storage Type - Market Size and Forecast, 2025-2035
- 12.5.1 Segment Definition and Scope
- 12.5.2 Historical Market Size, 2018-2025
- 12.5.3 Revenue Forecast, 2025-2035
- 12.5.4 Volume Forecast, 2025-2035
- 12.5.5 Base-Year Market Share, 2025
- 12.5.6 Segment CAGR and Growth Drivers
- 12.5.7 Subsegment Market Size and Forecast
- 12.5.7.1 Ambient Shelf Stable
- 12.5.7.2 Frozen
- 12.5.7.3 Fresh and Chilled
- 12.5.8 Subsegment Pricing and Adoption Trends
- 12.5.9 Leading Suppliers and Competition
- 12.5.10 Regional Demand and Opportunities
- 12.6 By State - Market Size and Forecast, 2025-2035
- 12.6.1 Segment Definition and Scope
- 12.6.2 Historical Market Size, 2018-2025
- 12.6.3 Revenue Forecast, 2025-2035
- 12.6.4 Volume Forecast, 2025-2035
- 12.6.5 Base-Year Market Share, 2025
- 12.6.6 Segment CAGR and Growth Drivers
- 12.6.7 Subsegment Market Size and Forecast
- 12.6.7.1 New South Wales
- 12.6.7.2 Victoria
- 12.6.7.3 Queensland
- 12.6.7.4 Western Australia
- 12.6.7.5 South Australia and Others
- 12.6.8 Subsegment Pricing and Adoption Trends
- 12.6.9 Leading Suppliers and Competition
- 12.6.10 Regional Demand and Opportunities
- 12.7 Segment Growth Comparison
- 12.8 Segment Attractiveness and Priority Matrix
Chapter 13 Australia Ethnic Food Geographic Market Outlook, 2025-2035
- 13.1 Domestic Market Distribution and Demand Clusters
- 13.2 State- or Province-Wise Market Size and Forecast, 2025-2035
- 13.3 City and Metropolitan Market Outlook
- 13.4 Industrial, Manufacturing and Commercial Clusters
- 13.5 Geographic Concentration of Key End Users
- 13.6 Local Pricing and Purchasing Differences
- 13.7 Domestic Production Facilities and Capacity Map
- 13.8 Local Infrastructure and Project Pipeline
- 13.9 State-Level Policy and Incentive Differences
- 13.10 Subnational Investment Hotspots and Opportunities
- 13.11 Distribution and Logistics Networks
- 13.12 Domestic Competitive Footprint
Chapter 14 Australia Ethnic Food Technology, Innovation and Sustainability Outlook
- 14.1 Technology Landscape and Maturity
- 14.2 Product, Process and Service Innovation
- 14.3 AI, Automation and Digital Tools in the Industry
- 14.4 Technology Adoption and Performance Benchmarking
- 14.5 Innovation Pipeline and R&D Investment
- 14.6 Patent and Intellectual Property Trends
- 14.7 Energy Efficiency and Resource Management
- 14.8 Sustainability, Recycling and Circularity
- 14.9 Technology Roadmap, 2025-2035
- 14.10 Risks of Obsolescence and Technology Substitution
Chapter 15 Australia Ethnic Food Market Key Strategic Imperatives
- 15.1 Growth and Market Entry Priorities
- 15.2 High-Return Products and Segments
- 15.3 Pricing, Profitability and Cost Optimization
- 15.4 Technology Investment and Product Differentiation
- 15.5 Supply Chain Localization and Resilience
- 15.6 Distribution and Customer Acquisition
- 15.7 Partnership, Acquisition and Capacity Strategy
- 15.8 Regional Expansion Priorities
- 15.9 Short-, Medium- and Long-Term Actions
Chapter 16 Competition Outlook
- 16.1 Industry Competition Characteristics
- 16.2 Market Structure and Concentration
- 16.3 Market Share and Competitive Positioning, 2025
- 16.4 Company-Wise Revenue and Product Benchmarking
- 16.5 Production and Service Capacity Benchmarking
- 16.6 Technology, Pricing and Differentiation
- 16.7 Regional Footprint and Distribution Strength
- 16.8 Mergers, Acquisitions and Strategic Alliances
- 16.9 New Entrants and Competitive Threats
- 16.10 Porter's Five Forces and Industry Attractiveness
- 16.11 Competitive Outlook, 2025-2035
Chapter 17 Company Profiles
- 17.1 Company Coverage and Selection Criteria
- 17.2 Woolworths Group
- 17.2.1 Business Description
- 17.2.2 Company Ownership and Geographic Presence
- 17.2.3 Product and Service Portfolio
- 17.2.4 Manufacturing and Operating Footprint
- 17.2.5 Production Capacity and Expansion Plans
- 17.2.6 Financial Performance and Investment
- 17.2.7 Market Share and Competitive Position
- 17.2.8 Technology and Innovation Capabilities
- 17.2.9 Strategic Alliances or Partnerships
- 17.2.10 Recent Developments
- 17.2.11 Growth Strategy and Outlook
- 17.3 Coles Group
- 17.4 SunRice
- 17.5 Simplot Australia
- 17.6 McCormick (Gourmet Garden)
- 17.7 Nissin Foods (ABC Pastry)
- 17.8 CJ Foods Oceania
- 17.9 Nongshim
- 17.10 JFC Australia
- 17.11 Patak's (AB World Foods)
- 17.12 Other Relevant Market Participants
Note: Every listed company is profiled on the structure shown under the first company. The company list is preliminary and may change based on research findings, market developments, data availability and client requirements.
Chapter 18 Disclaimer
- 18.1 Research and Forecast Disclaimer
- 18.2 Data Source and Estimation Limitations
Note: The depth of individual sections depends on data availability for this market. Volume, capacity, trade and other unit-based metrics are included where applicable.

