Energy cans and zero-sugar colas carry caffeine demand
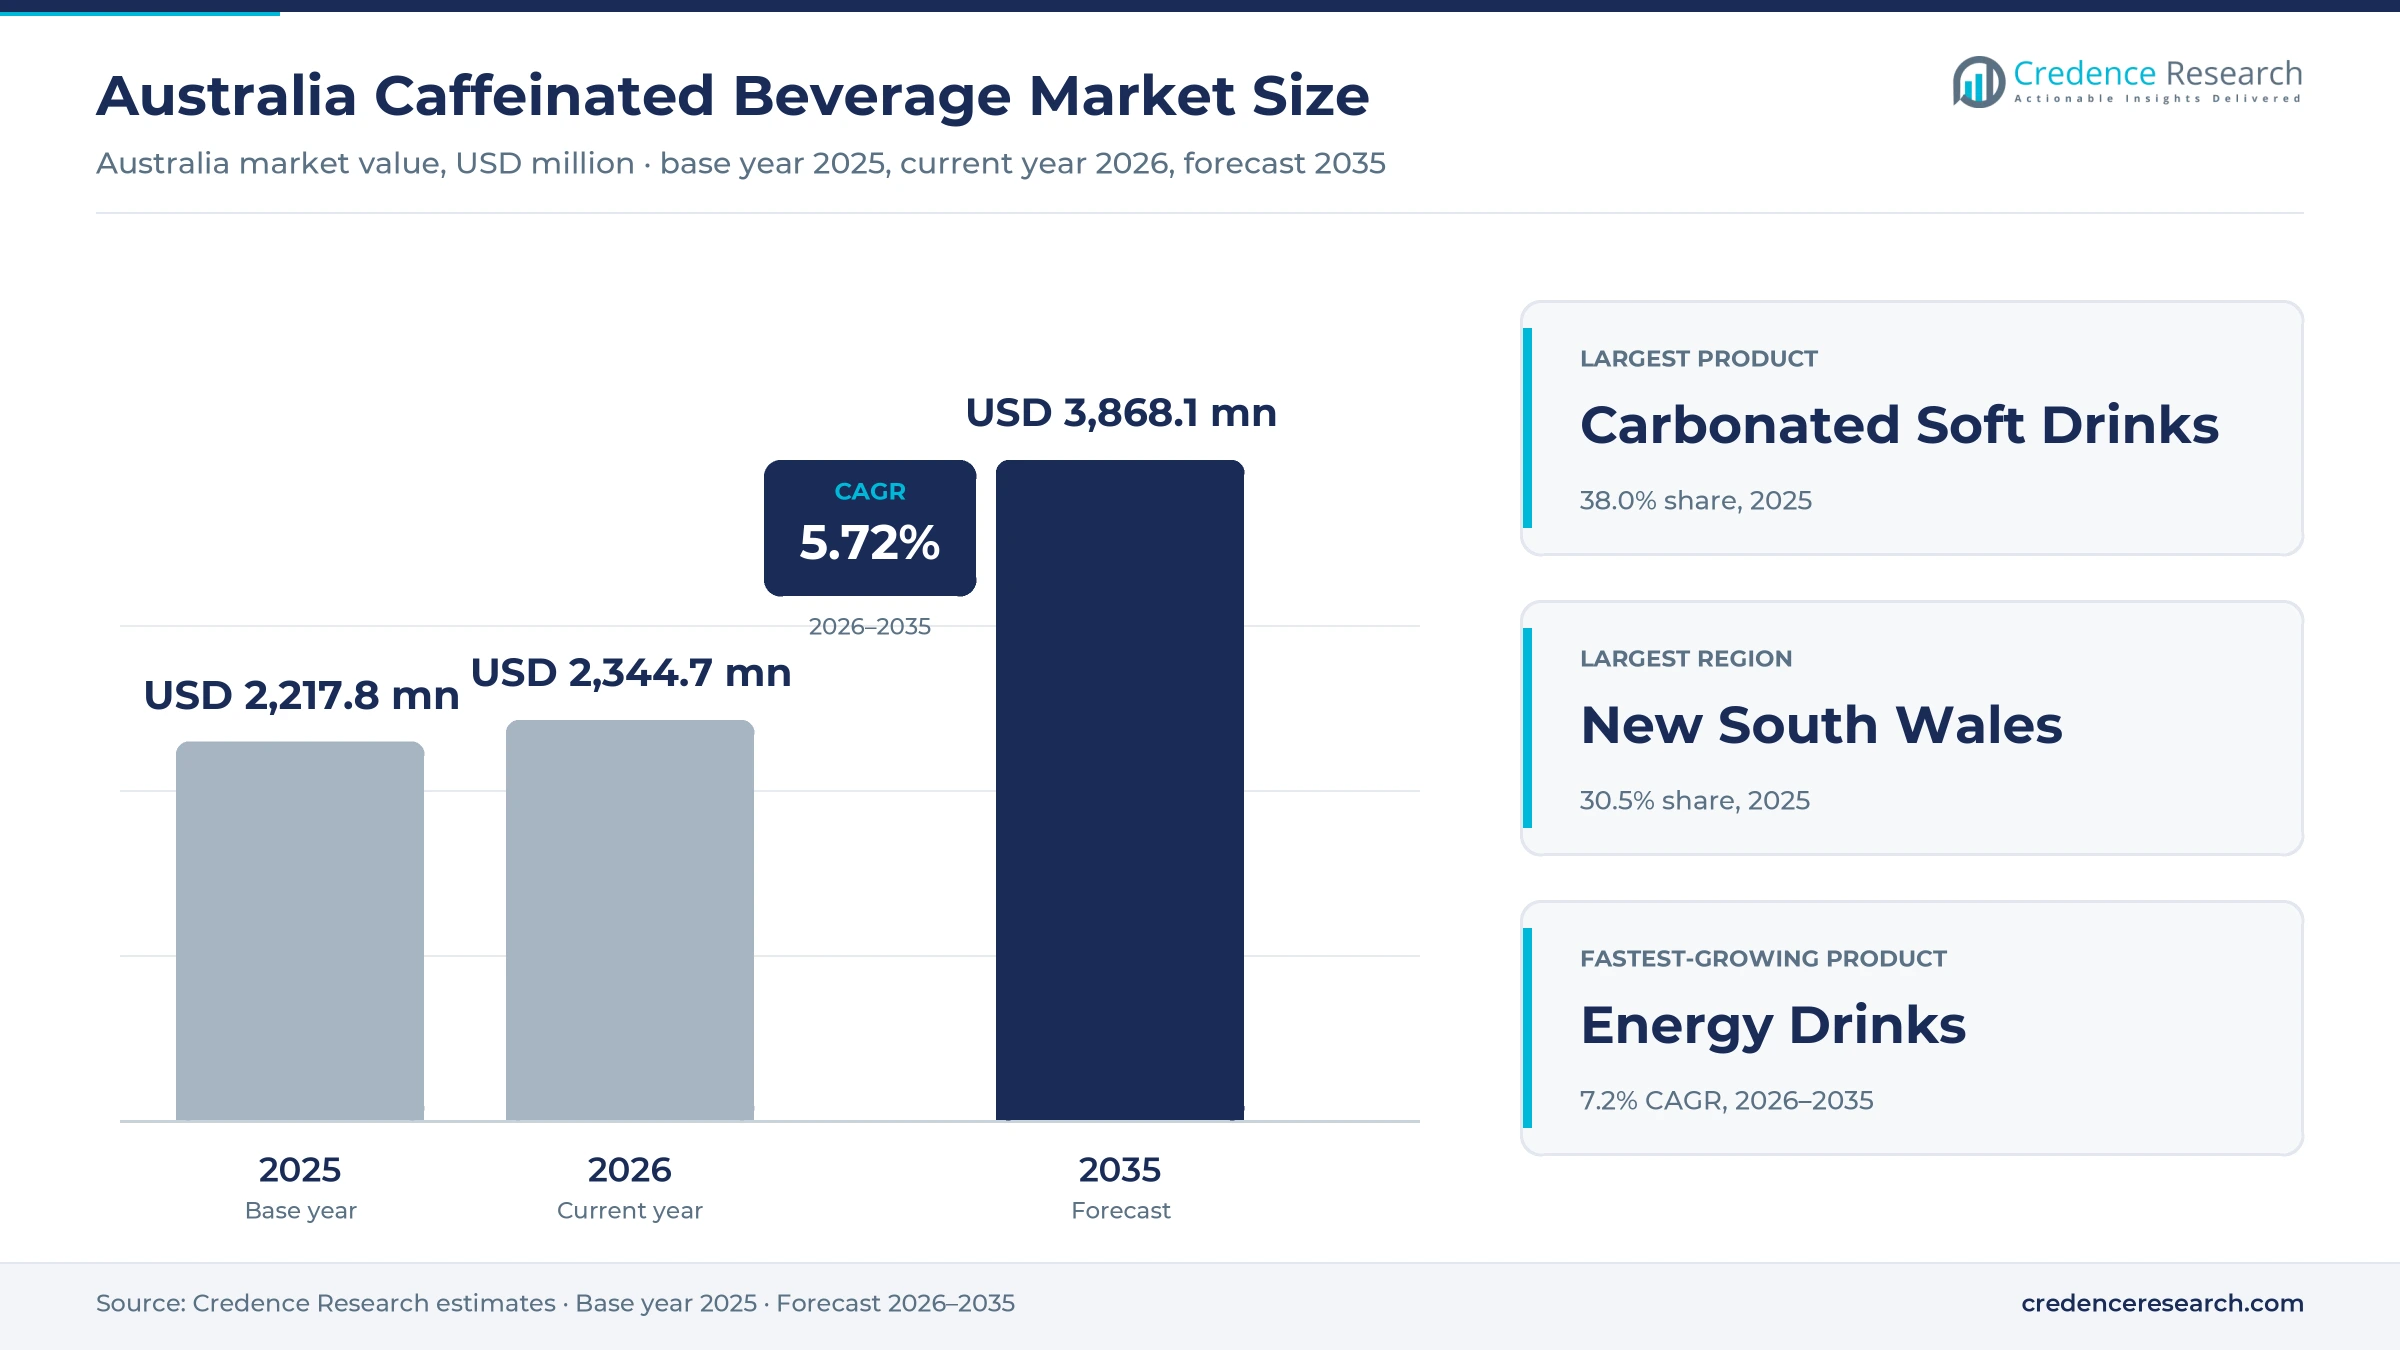
The Australia caffeinated beverage market was valued at USD 2.22 billion in 2025 and is projected to increase from USD 2.34 billion in 2026 to USD 3.87 billion by 2035, registering a CAGR of 5.72% during 2026–2035. Demand comes from colas such as Coca-Cola Zero Sugar and Pepsi Max, from energy drinks such as Red Bull, V and Monster, and from milk-based iced coffees sold in supermarkets, petrol stations and convenience stores. New South Wales held the largest regional share, 30.5% in 2025, because it has the largest population. Western Australia is the fastest-growing region at 6.3% a year, helped by the quickest population growth of any state. Energy drinks are the main source of new volume, while sugar-free recipes now account for a large part of cola sales. The key regulatory change is the caffeine review that Food Standards Australia New Zealand approved in March 2026, which adds caffeine labels to high-strength packaged coffee and caps caffeine in sports foods.
Which caffeinated drinks do Australians buy in packaged form?
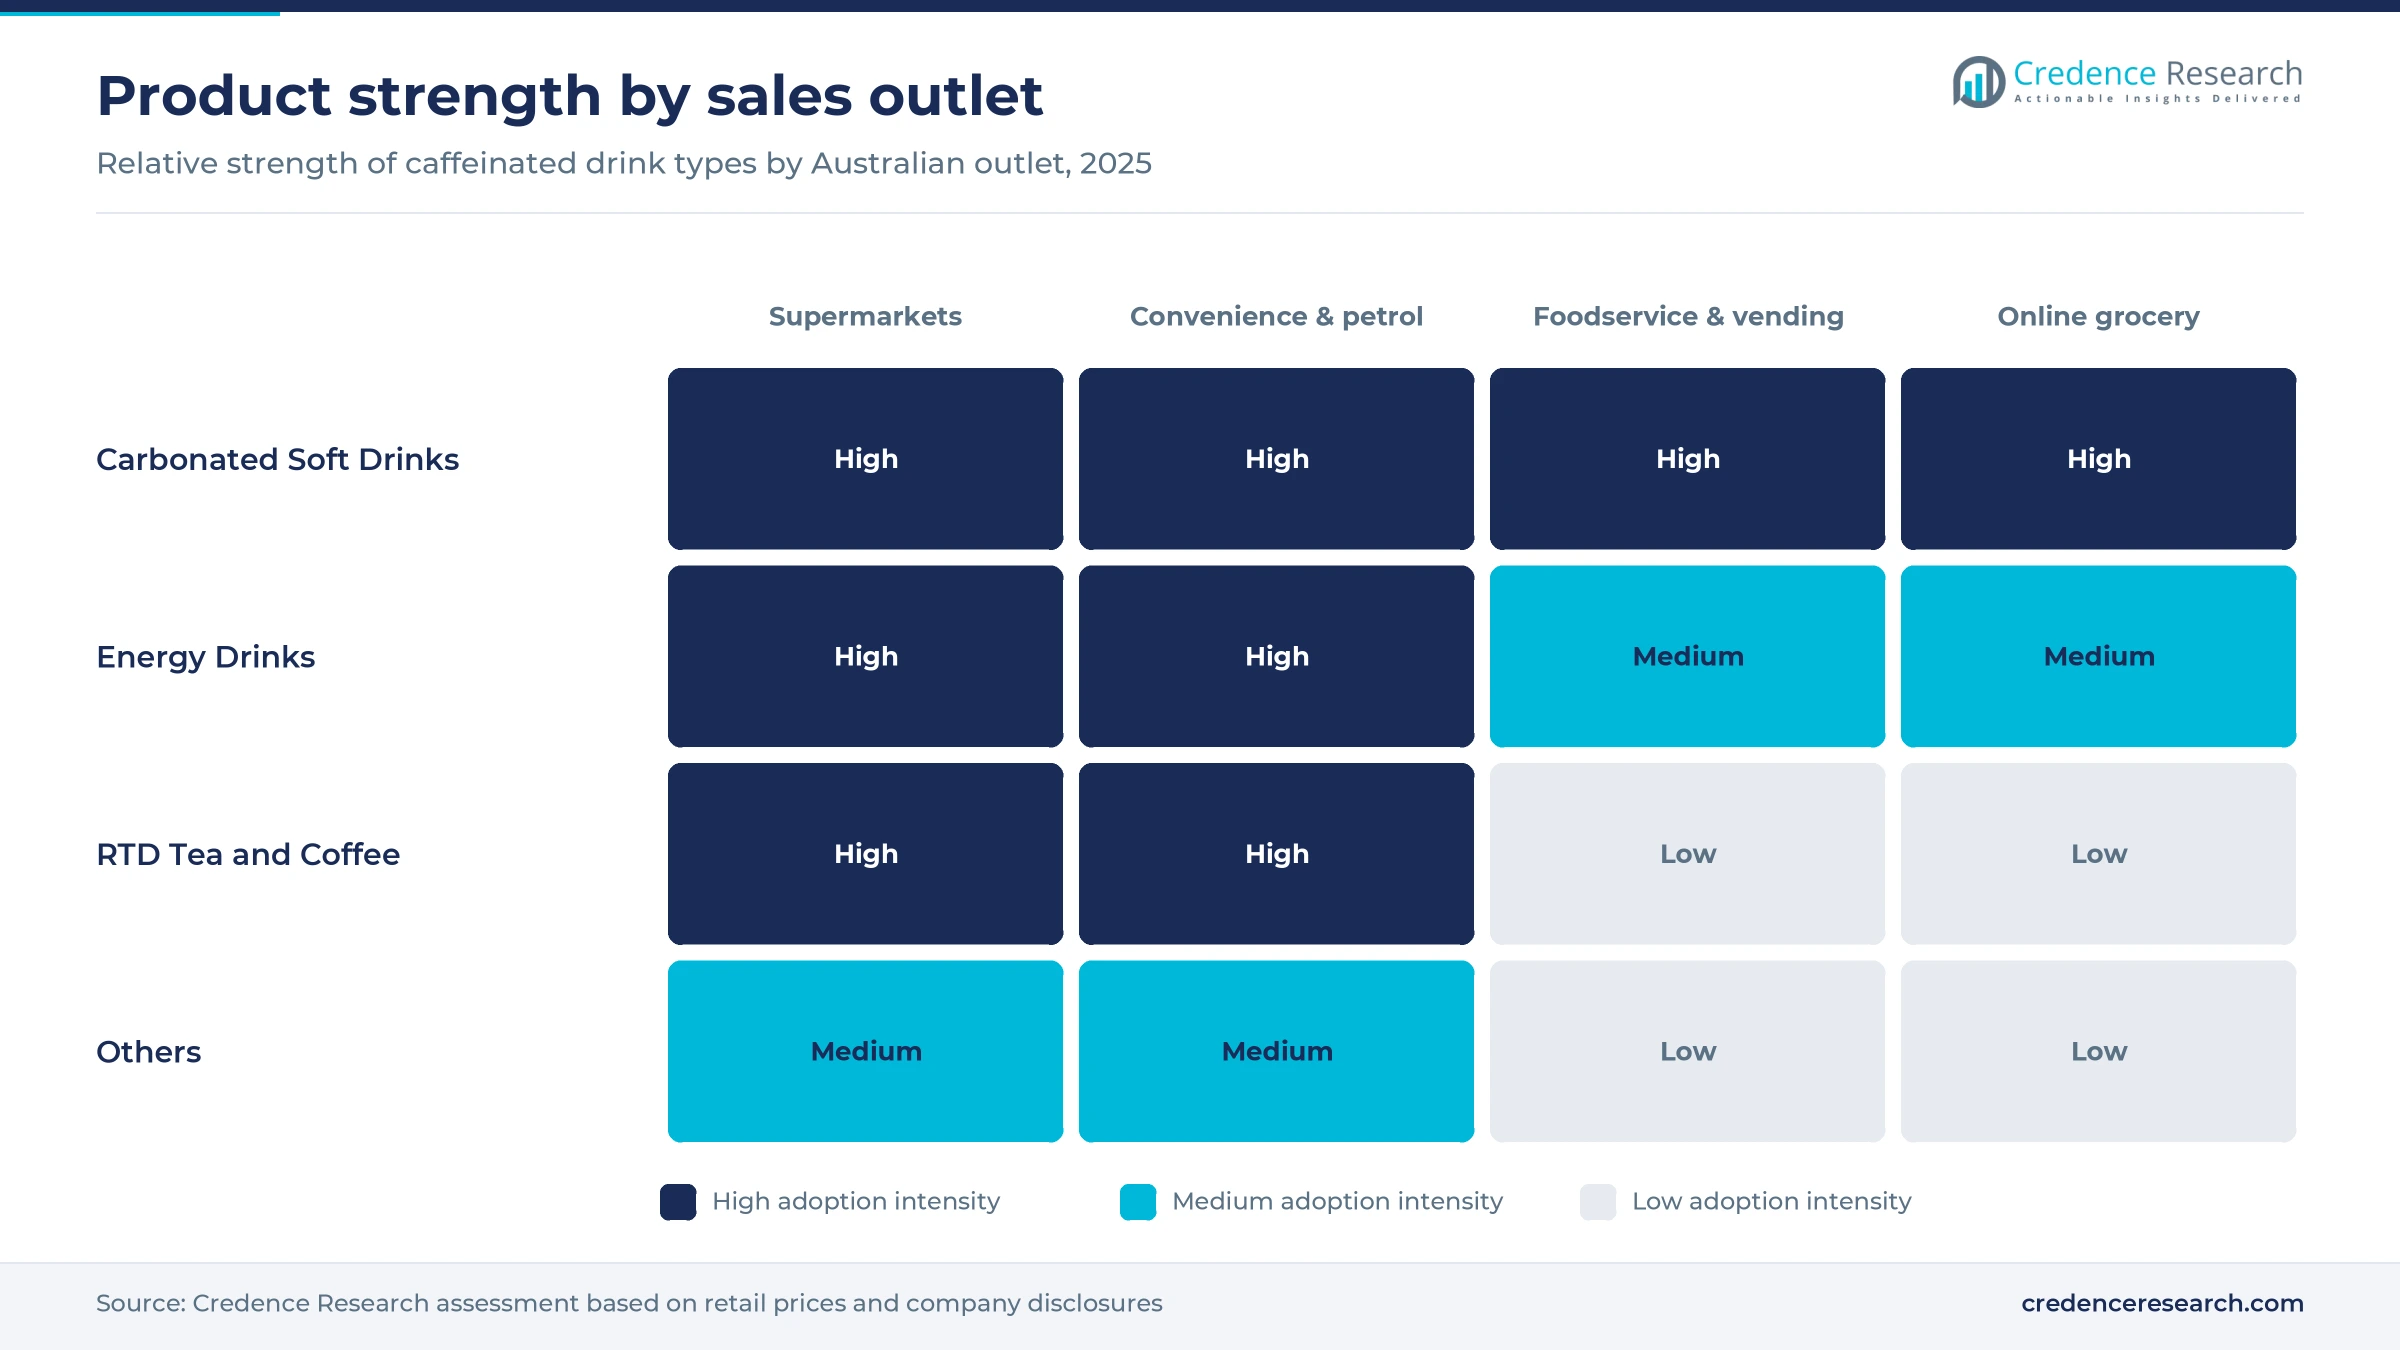
The report counts packaged drinks that contain caffeine and are sold in Australia, valued at manufacturer and brand-owner selling prices excluding the goods and services tax. It covers caffeinated carbonated soft drinks such as colas, energy drinks sold as formulated caffeinated beverages, ready-to-drink coffee and tea including milk-based iced coffee, and other caffeinated drinks such as sparkling coffee and caffeinated juice. Sales through supermarkets, convenience stores, petrol stations, vending machines, foodservice and online grocery are included.
Coffee brewed in cafes, instant and roast coffee, loose tea, caffeine-free colas and alcoholic ready-to-drink products are excluded. The value chain runs from concentrate and flavor suppliers through bottlers, dairy processors and can makers to two large supermarket chains, convenience operators and route distributors, which together decide most ranging and promotional activity.
Australia Caffeinated Beverage Market Insights
- The market reached USD 2.22 billion in 2025 and is projected to reach USD 3.87 billion by 2035 at a 5.72% CAGR, with energy drinks adding the most new volume.
- New South Wales held 30.5% of 2025 value, while Western Australia grows fastest at 6.3% a year on 2.2% population growth.
- Carbonated Soft Drinks led products with 38.0% of 2025 value, while Energy Drinks grow fastest at 7.2% a year.
- Australians bought 15.9 mL of energy drinks per person per day in 2024-25, up 17.8% in a year, according to the Australian Bureau of Statistics.
- Food Standards Australia New Zealand approved its caffeine review on March 10, 2026, giving food businesses two years from gazettal to comply.
Colas still lead while energy drinks grow fastest
Why do colas lead while energy cans gain ground?
Based on product, the market is categorized into carbonated soft drinks, energy drinks, RTD tea and coffee, and others. Carbonated Soft Drinks led with 38.0% of 2025 value because colas sell in far larger volumes than any other caffeinated drink, and Coca-Cola Zero Sugar posted double-digit growth in Australia during 2025, according to the full-year 2025 results of Coca-Cola Europacific Partners. Energy Drinks grow fastest at 7.2% a year, as the same bottler reported double-digit energy volume growth across Australia and the Pacific in 2025, led by Monster. Energy cans also earn more per liter than colas, so each point of volume shift lifts value faster.
Why do formulated flavors still lead while natural recipes gain?
Based on flavor, the market is categorized into natural and synthetic flavor profiles. Synthetic flavors led with 68.0% of 2025 value because mainstream colas and energy drinks rely on formulated flavor and high-intensity sweetener systems, and low- and no-sugar varieties made up 65% of water-based drink sales in 2024, according to a FOODiQ Global study commissioned by the Australian Beverages Council. Natural recipes grow fastest at 6.5% a year, as Red Bull launched Red Bull Zero in June 2025, sweetened with monk fruit extract and sold at Coles, Woolworths and 7-Eleven. Natural recipes cost more to stabilize, so their reach is limited in discount multipacks.
Why does physical retail dominate while online grows?
Based on sales channel, the market is categorized into offline and online sales. Offline sales led with 90.5% of 2025 value because caffeinated drinks are bought chilled and on impulse, and a single 250 mL Red Bull costs about AUD 12.80 per liter at the two main chains, a premium buyers pay mainly at the chilled fridge. Online sales grow fastest at 7.7% a year, as Woolworths reported a record 15.1% online penetration for its Australian food business in fiscal 2025, with ecommerce sales up 17.4%. Online baskets favor multipacks of cola and energy cans rather than single chilled serves.
| Segment Group | Leading Sub-segment | Share, 2025 | Fastest-growing Sub-segment | CAGR, 2026–2035 |
|---|---|---|---|---|
| By Product | Carbonated Soft Drinks | 38.0% | Energy Drinks | 7.2% |
| By Flavor | Synthetic | 68.0% | Natural | 6.5% |
| By Sales Channel | Offline | 90.5% | Online | 7.7% |
Energy cans cost two to three times colas per liter
Caffeinated drinks are priced per single serve in chilled fridges and per multipack in the aisle, and the gap between the two sets the margin structure of the market. A 500 mL energy can sells for about AUD 4 at the two main supermarket chains, roughly AUD 8 per liter, while a 24-pack of zero-sugar cola works out near AUD 3.90 per liter. Frequent supermarket specials pull average prices well below shelf tags, so brand owners fund much of the price through promotion budgets. Every state and territory now runs a container deposit scheme with a 10-cent refund, according to Recycling Near You, which adds a fixed cost that weighs most on small-serve formats.
| Offer or segment | Typical price or fee | Basis |
|---|---|---|
| Red Bull Energy Drink, 250 mL can | AUD 3.20 per can | Grocerize price tracker, Coles and Woolworths, 90-day average, November 2026 |
| Monster Energy Green, 500 mL can | AUD 4.08 per can | Grocerize price tracker, 90-day average, November 2026 |
| V Energy Original, 500 mL can | AUD 4.06 per can | Grocerize price tracker, 90-day average, November 2026 |
| Coca-Cola Zero Sugar, 24 x 375 mL cans | AUD 35.31 per pack | Grocerize price tracker, 90-day average, November 2026 |
| Dare Iced Coffee Espresso, 500 mL | AUD 3.89 per bottle | Grocerize price tracker, Coles 90-day average, November 2026 |
| Ice Break Strong Espresso, 500 mL | AUD 3.95 per bottle | Lactalis recommended retail price, April 2024 |
Request a Free Sample
Fill in your details and we'll send you a free sample report.
- Sample data tables & charts
- Research methodology
Energy volumes, sugar-free colas and new canning lines
Energy drink volumes rise faster than any soft drink
Energy drinks are taking a growing share of the caffeine Australians buy in packaged form, which lifts value because cans sell at high prices per liter. Apparent consumption reached 15.9 mL per person per day in 2024-25, up 17.8% in a year and up from 8.3 mL in 2018-19, the Australian Bureau of Statistics reported in October 2026. Electrolyte and energy drinks rose from 0.6% to 1.1% of discretionary dietary energy over the same period, CommBank noted in its analysis of the data. Brand owners with cold-fridge space in petrol and convenience stores gain the most from this shift, while cola brands lose part of the caffeine occasion.
Zero-sugar colas keep soft drink volumes growing
Sugar-free recipes let cola brands hold on to caffeine-seeking buyers who now avoid sugar, so the largest product line is still growing instead of shrinking. Soft drinks reached 167.4 mL per person per day in 2024-25, up 2.6%, and 46.1% of that volume was intensely sweetened, according to the same statistics release. Over seven years, intensely sweetened drinks rose 38.0% while sugar-sweetened volumes declined, which shows that buyers are switching recipes rather than leaving the category. Asahi Lifestyle Beverages makes Pepsi Max under its PepsiCo bottling agreement, so both large bottlers have a zero-sugar cola to promote. Coca-Cola Zero Sugar and Pepsi Max gain from the switch, while full-sugar lines face slow volume erosion.
Bottlers add canning capacity for energy brands
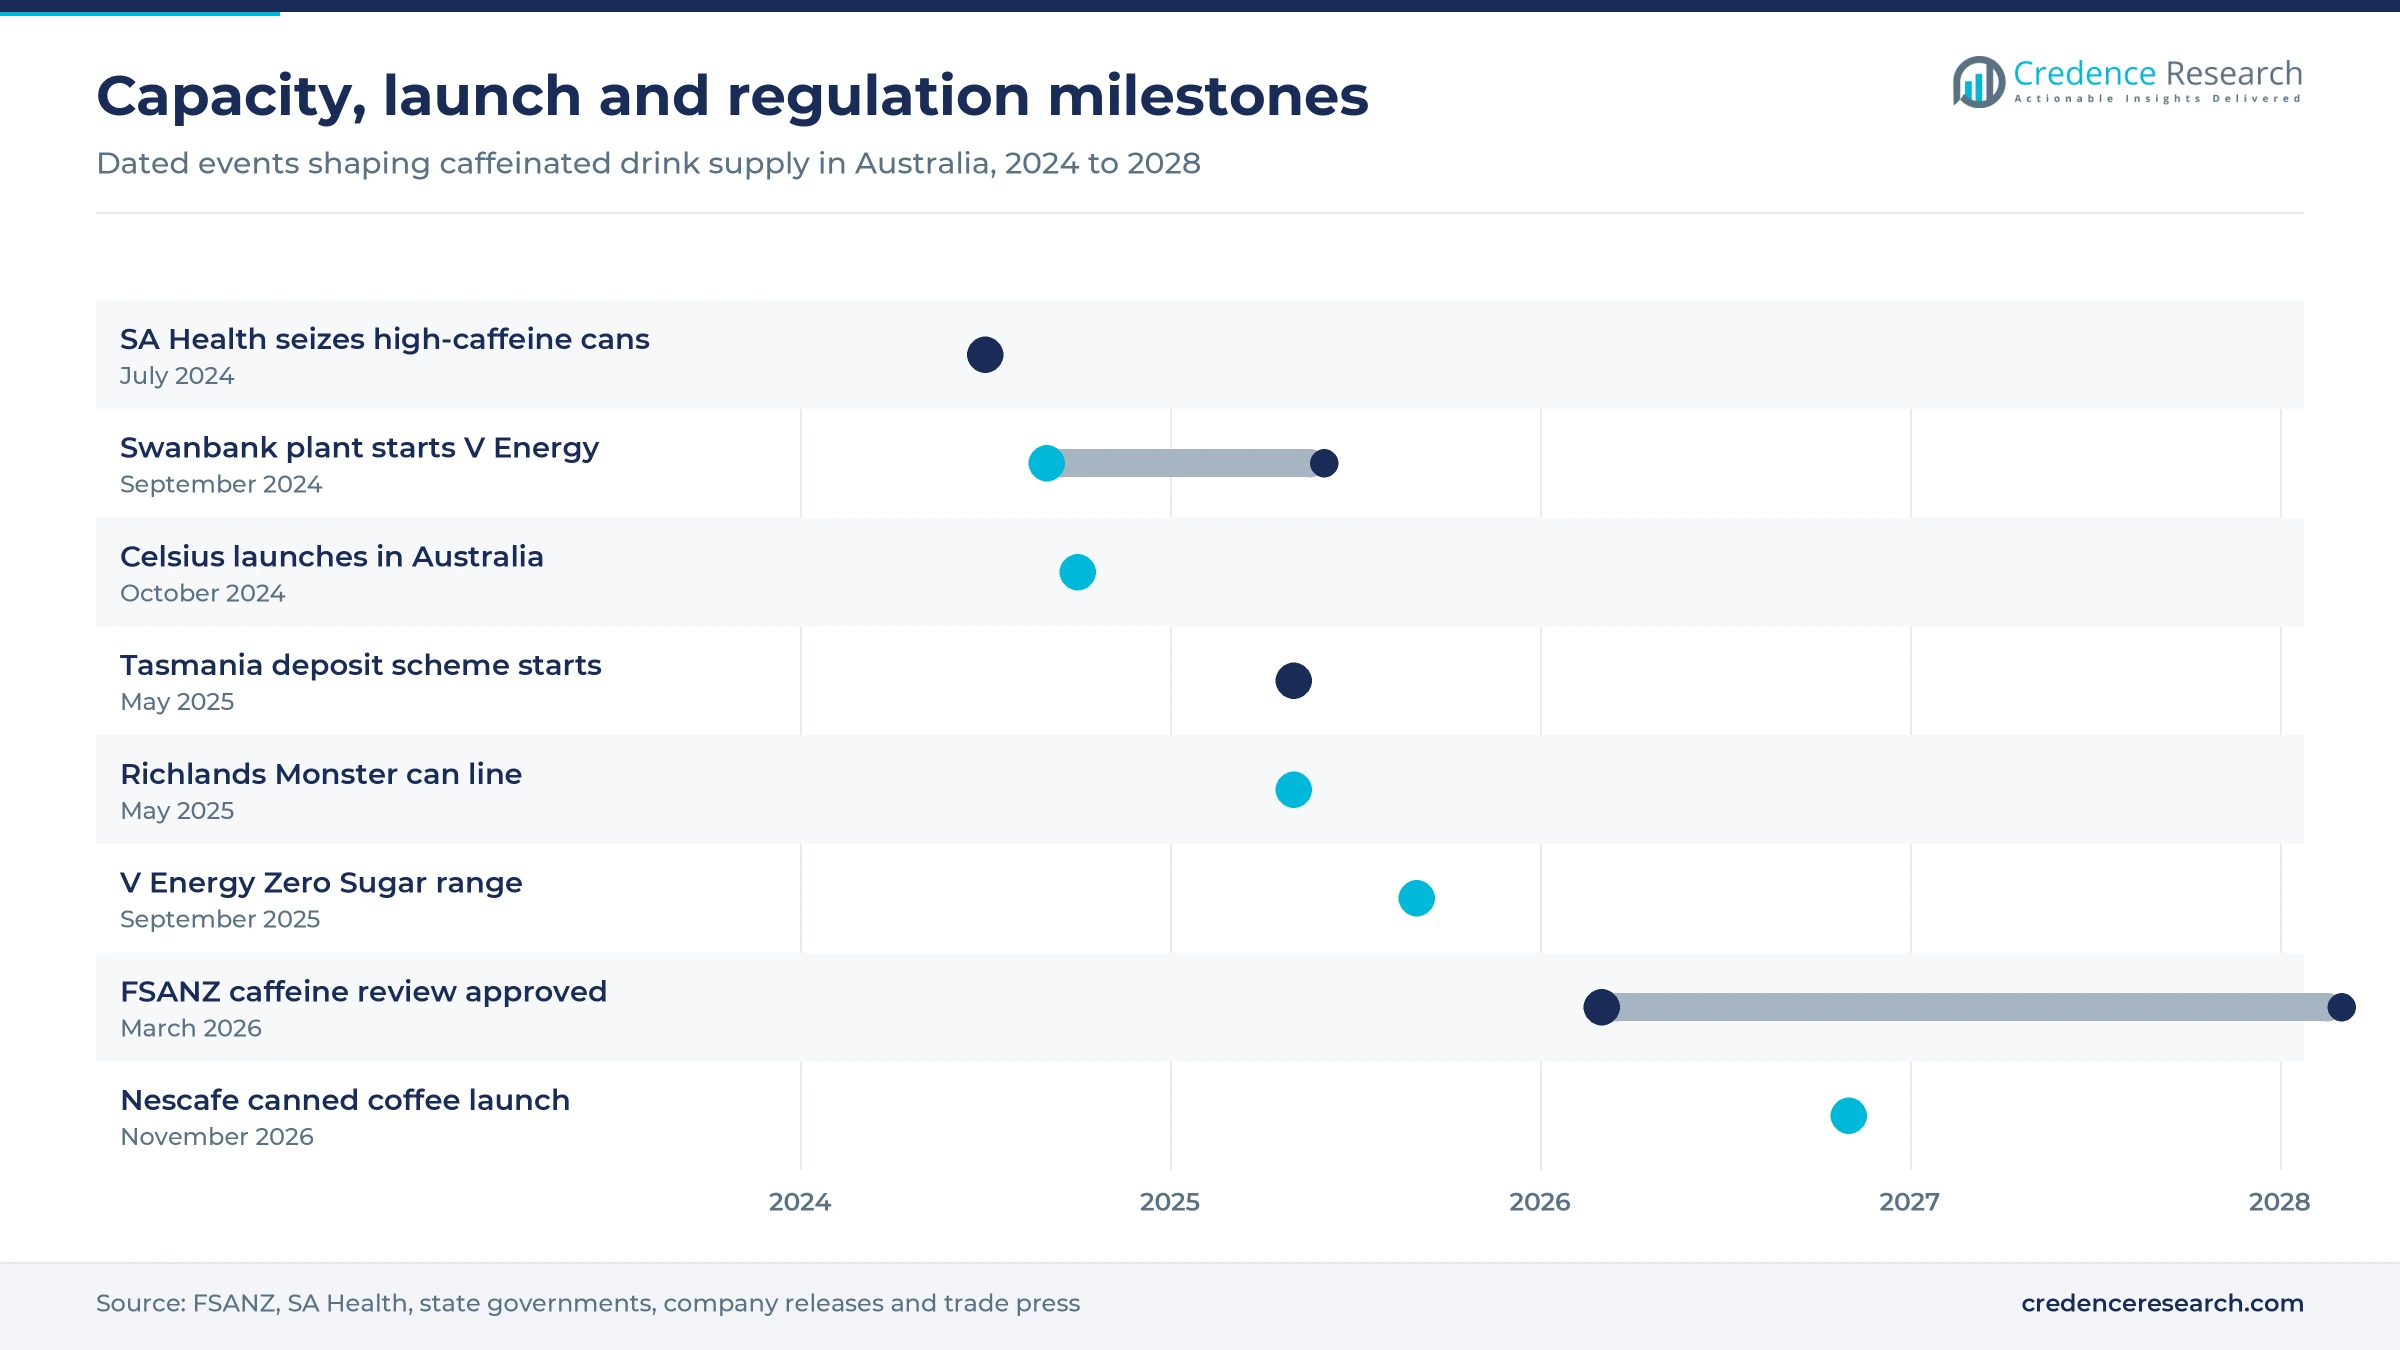
Bottlers are investing in high-speed can lines because energy and cola demand has outgrown older capacity. Coca-Cola Europacific Partners unveiled a AUD 75 million line at its Richlands plant in Brisbane in May 2025, able to fill up to 120,000 cans an hour for Monster and Mother, Food & Drink Business reported. Suntory Oceania started production at its AUD 400 million Swanbank plant in Ipswich in September 2024, with V Energy first off two canning lines rated at 180,000 cans an hour. Local filling cuts freight from overseas, shortens lead times for new flavors and adds demand for aluminum cans made in Australia. Smaller brands without access to these lines must rely on imports or contract fillers.
A cold coffee habit lifts canned and bottled coffee
Younger Australians increasingly take coffee cold and on the move, which shifts part of daily caffeine spending from cafes to packaged drinks. Nestle launched its first canned Nescafe ready-to-drink range in Australia in November 2026, backed by a AUD 5.6 million campaign, Marketing-Interactive reported. The same report said young Australians drink about 40% of their coffee cold and on the run. Bega Cheese's Dare Iced Coffee Espresso averaged AUD 3.89 a bottle at Coles in the 90 days to November 2026. Demand for ready-to-drink coffee favors dairy processors with chilled distribution, while global coffee brands enter through shelf-stable cans that need no refrigeration. Cafes lose part of the takeaway occasion to these packs.
Zero-sugar energy, caffeine labels and protein coffee
Energy brands shift toward zero-sugar ranges
Energy drink makers are moving into zero-sugar ranges to reach buyers who already chose sugar-free colas, creating openings for new flavor lines in the fastest-growing category. Global energy drinks brands lead this shift, and only 19.5% of energy drink volume was intensely sweetened in 2024-25, compared with 46.1% for soft drinks, ABS figures show. The conversion to sugar-free energy recipes therefore still has far to run. Suntory Oceania launched a V Energy Zero Sugar range in three flavors in single-serve cans in September 2025, Food & Drink Business reported. Brands that match original taste without sugar can protect price points while health scrutiny rises.
Caffeine labels spread to high-strength coffee drinks
Regulators are extending caffeine disclosure beyond energy drinks, which shifts compliance work toward coffee brands and sports nutrition makers. Food Standards Australia New Zealand approved its caffeine review on March 10, 2026, and notified food ministers on March 24, 2026. Packaged coffee drinks with at least 200 mg of caffeine per serve must declare caffeine in the nutrition panel and state that they are unsuitable for children under 15. Sports foods are capped at 200 mg of caffeine per one-day quantity, and businesses get two years from gazettal to comply. Strong iced coffees face relabeling costs, while existing energy drink and cola permissions stay unchanged.
Protein iced coffee is an opening for dairy processors
High-protein iced coffee is a clear opening because it combines caffeine with the protein claims that shoppers now seek in dairy. Lactalis gave Ice Break Strong Espresso 25 grams of protein per bottle at launch in April 2024, alongside three shots of robusta coffee, so one product meets both caffeine and protein demand. Under the 2026 caffeine review, any protein coffee with 200 mg or more of caffeine per serve needs the new caffeine declaration. Bega Cheese said in August 2026 that it ranks first in milk-based beverages and is launching high-protein products under brands including Farmers Union. Flavored milk sales rose 37% between 2015 and 2024, the FOODiQ Global study found. Processors with milk supply and chilled routes can add value per bottle, while caffeine-only brands lack the dairy base to follow.
Compliant imports can replace seized high-caffeine cans
Demand for U.S.-style energy brands creates an opening for compliant local versions, because many imported cans exceed the legal caffeine limit. Energy drinks must contain 145 to 320 mg of caffeine per liter, and selling one above that limit is illegal, according to the Western Australian Department of Health. SA Health seized almost 700 cans and found 18 non-compliant products, including Bang and Raze, during inspections reported in July 2024. Celsius entered Australia in October 2024 with 100 mg of caffeine per can, half its U.S. level, through Suntory Oceania. Brands that reformulate for local rules gain shelf access that grey imports lose.
Deep promotions, deposit fees and caffeine scrutiny
Deep supermarket specials erode energy drink margins
Supermarket promotions set the real price of energy drinks, which shifts margin from brand owners to promotional funding. Coles listed Monster Energy Green at AUD 3.25 in November 2026, a saving of AUD 1.45, while Woolworths charged AUD 4.70, Grocerize data show. Brands that depend on two supermarket chains are most exposed, because promotion calendars, not list prices, decide volume. Convenience channels protect margins but carry higher distribution costs per can.
Container deposits add cost to every serve
Container deposit schemes add a fixed charge to every can and bottle, which weighs most on small single-serve drinks. Tasmania started its Recycle Rewards scheme on May 1, 2025, with a 10-cent refund, and residents returned more than 256,000 containers on the first day, the Tasmanian Premier said. With Tasmania's launch, the refund now applies nationwide, so a 250 mL can carries AUD 0.40 of deposit per liter against about AUD 0.27 for a 375 mL can, and small energy serves absorb the highest cost.
Sugar tax calls threaten full-sugar lines
Health bodies keep pressing for taxes on sugary drinks, which would raise shelf prices for full-sugar colas and energy drinks. The World Health Organization launched its 3 by 35 initiative on July 2, 2025, urging countries to raise real prices of sugary drinks, tobacco and alcohol by at least 50% by 2035. A levy built on that target would fall hardest on full-sugar energy drinks, since only 19.5% of energy drink volume was intensely sweetened in 2024-25. Full-sugar cola and energy brands sold in single serves are the most exposed.
Calls for age limits keep energy drinks under scrutiny
Age limits are the main policy risk for energy brands, because young adults drive much of the volume growth. The Australian Beverages Council said on July 22, 2026, that restricting sales to under-16s, as proposed in England, would be disproportionate, after the FSANZ review left energy drink rules unchanged. Retailers in Bridgetown, Western Australia, already agreed in 2023 to stop selling energy drinks to anyone under 18, the RACGP reported. Full-sugar brands aimed at teenagers and convenience stores near schools are the most exposed if a state copies that model.
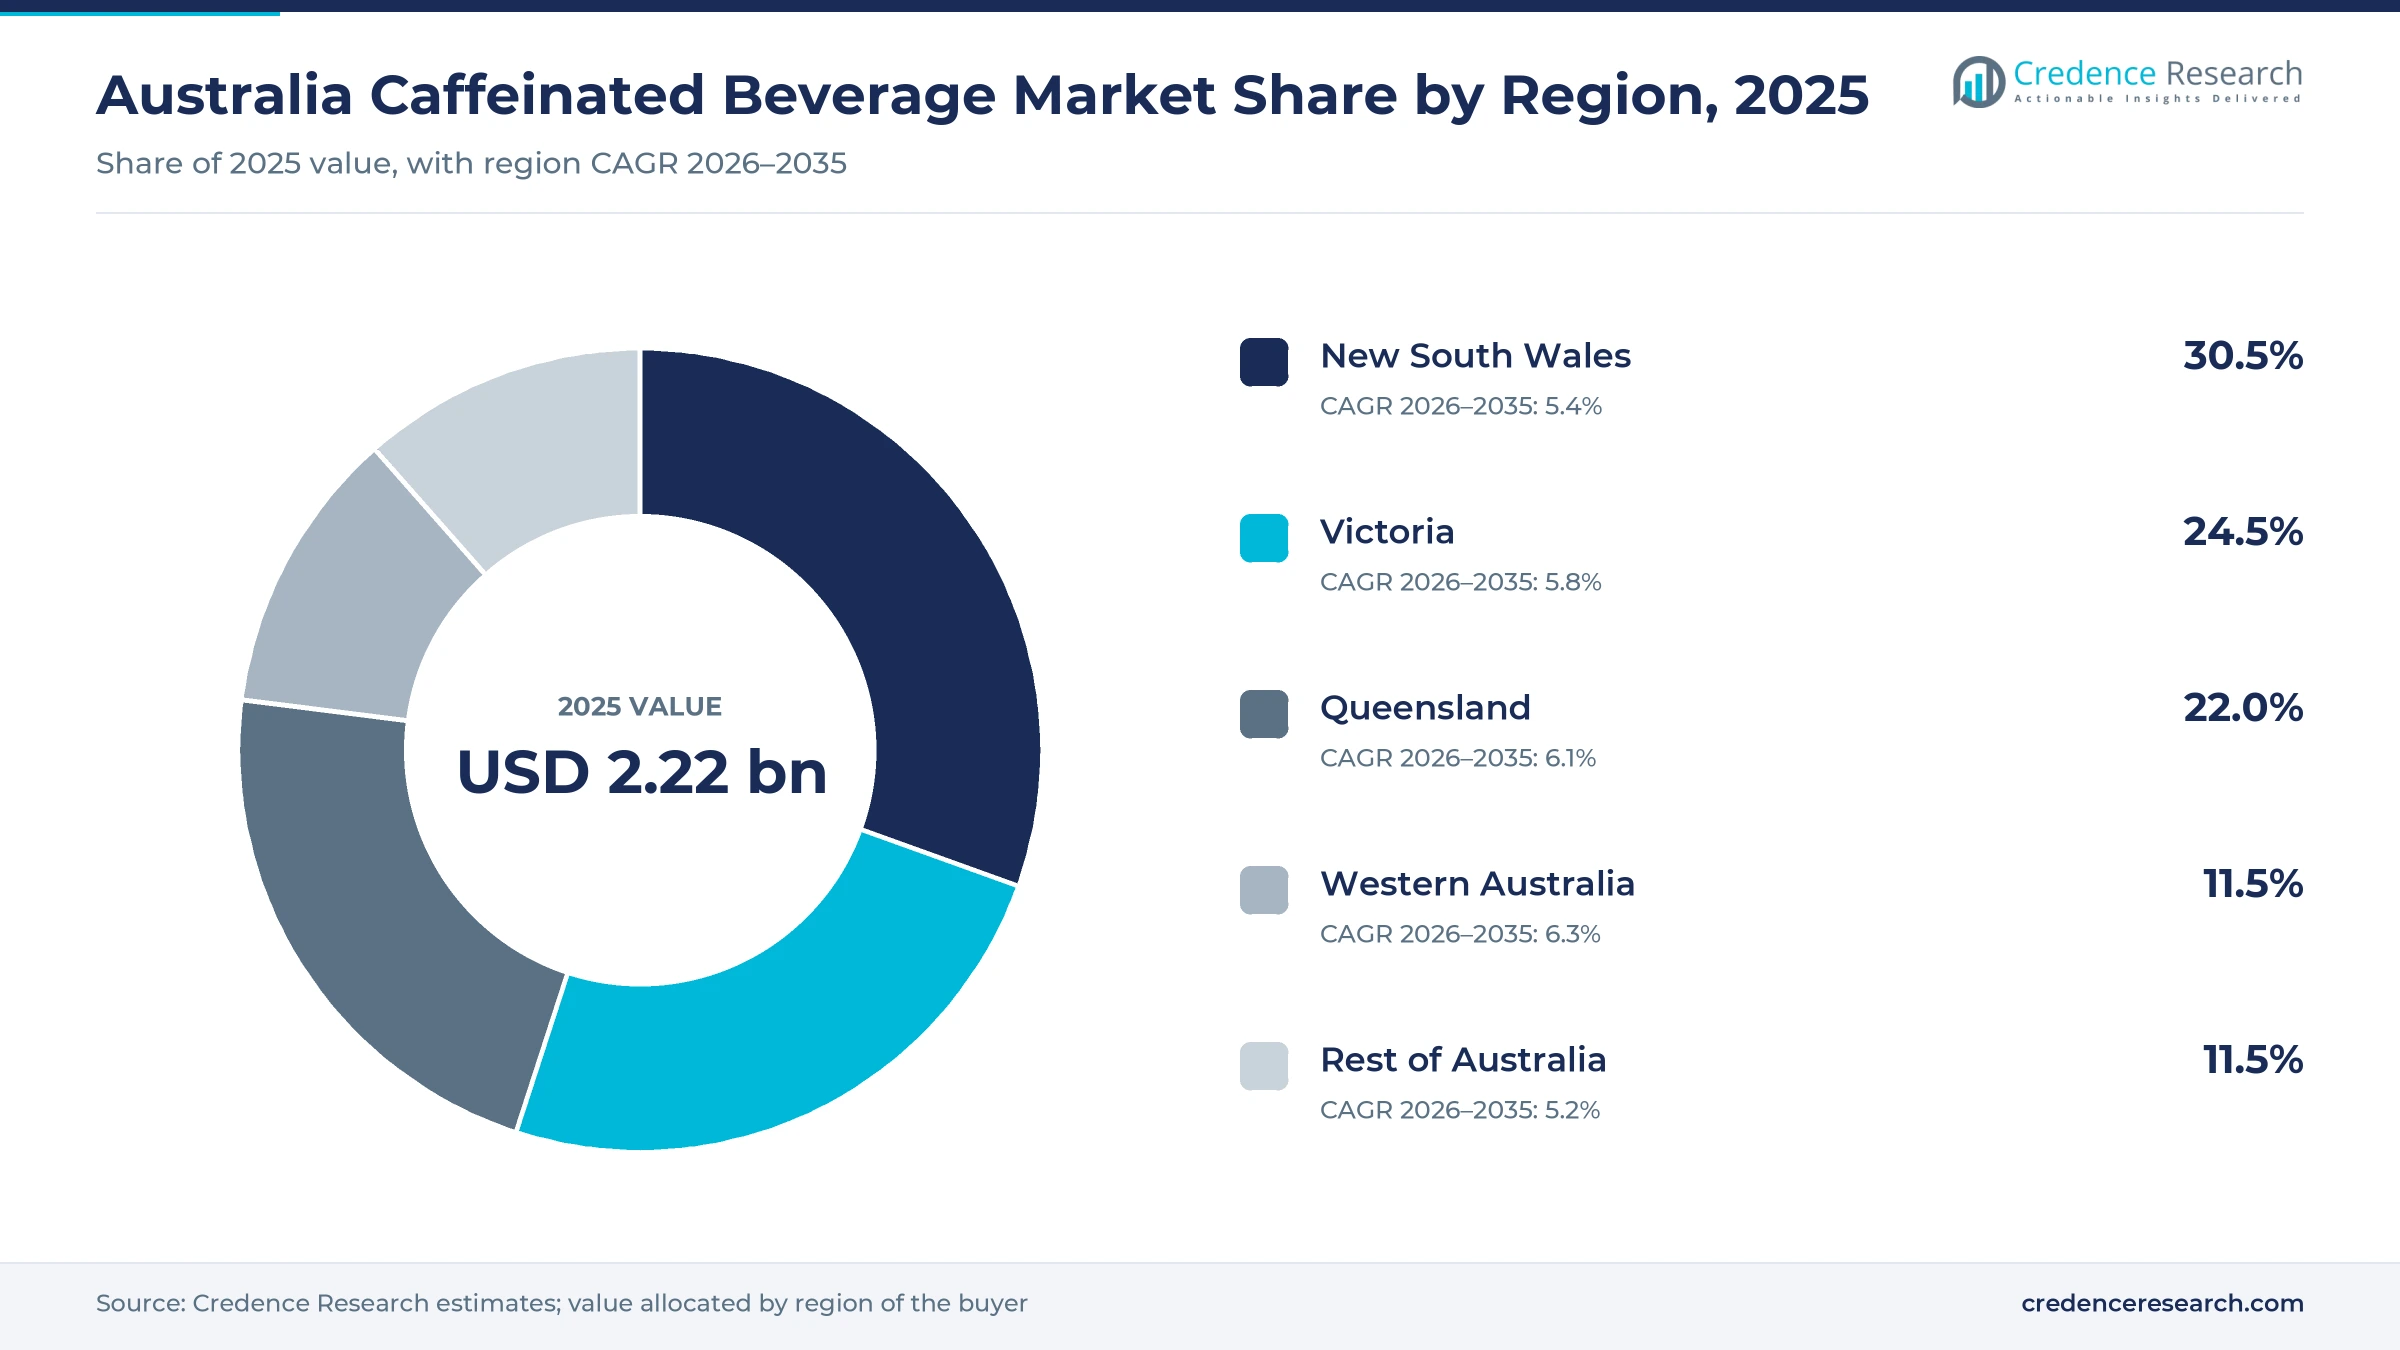
New South Wales leads and Western Australia grows fastest
| Region | Value, 2025 (USD billion) | Share, 2025 | CAGR, 2026–2035 |
|---|---|---|---|
| New South Wales | 0.68 | 30.5% | 5.4% |
| Victoria | 0.54 | 24.5% | 5.8% |
| Queensland | 0.49 | 22.0% | 6.1% |
| Western Australia | 0.26 | 11.5% | 6.3% |
| Rest of Australia | 0.26 | 11.5% | 5.2% |
New South Wales leads on population and retail density
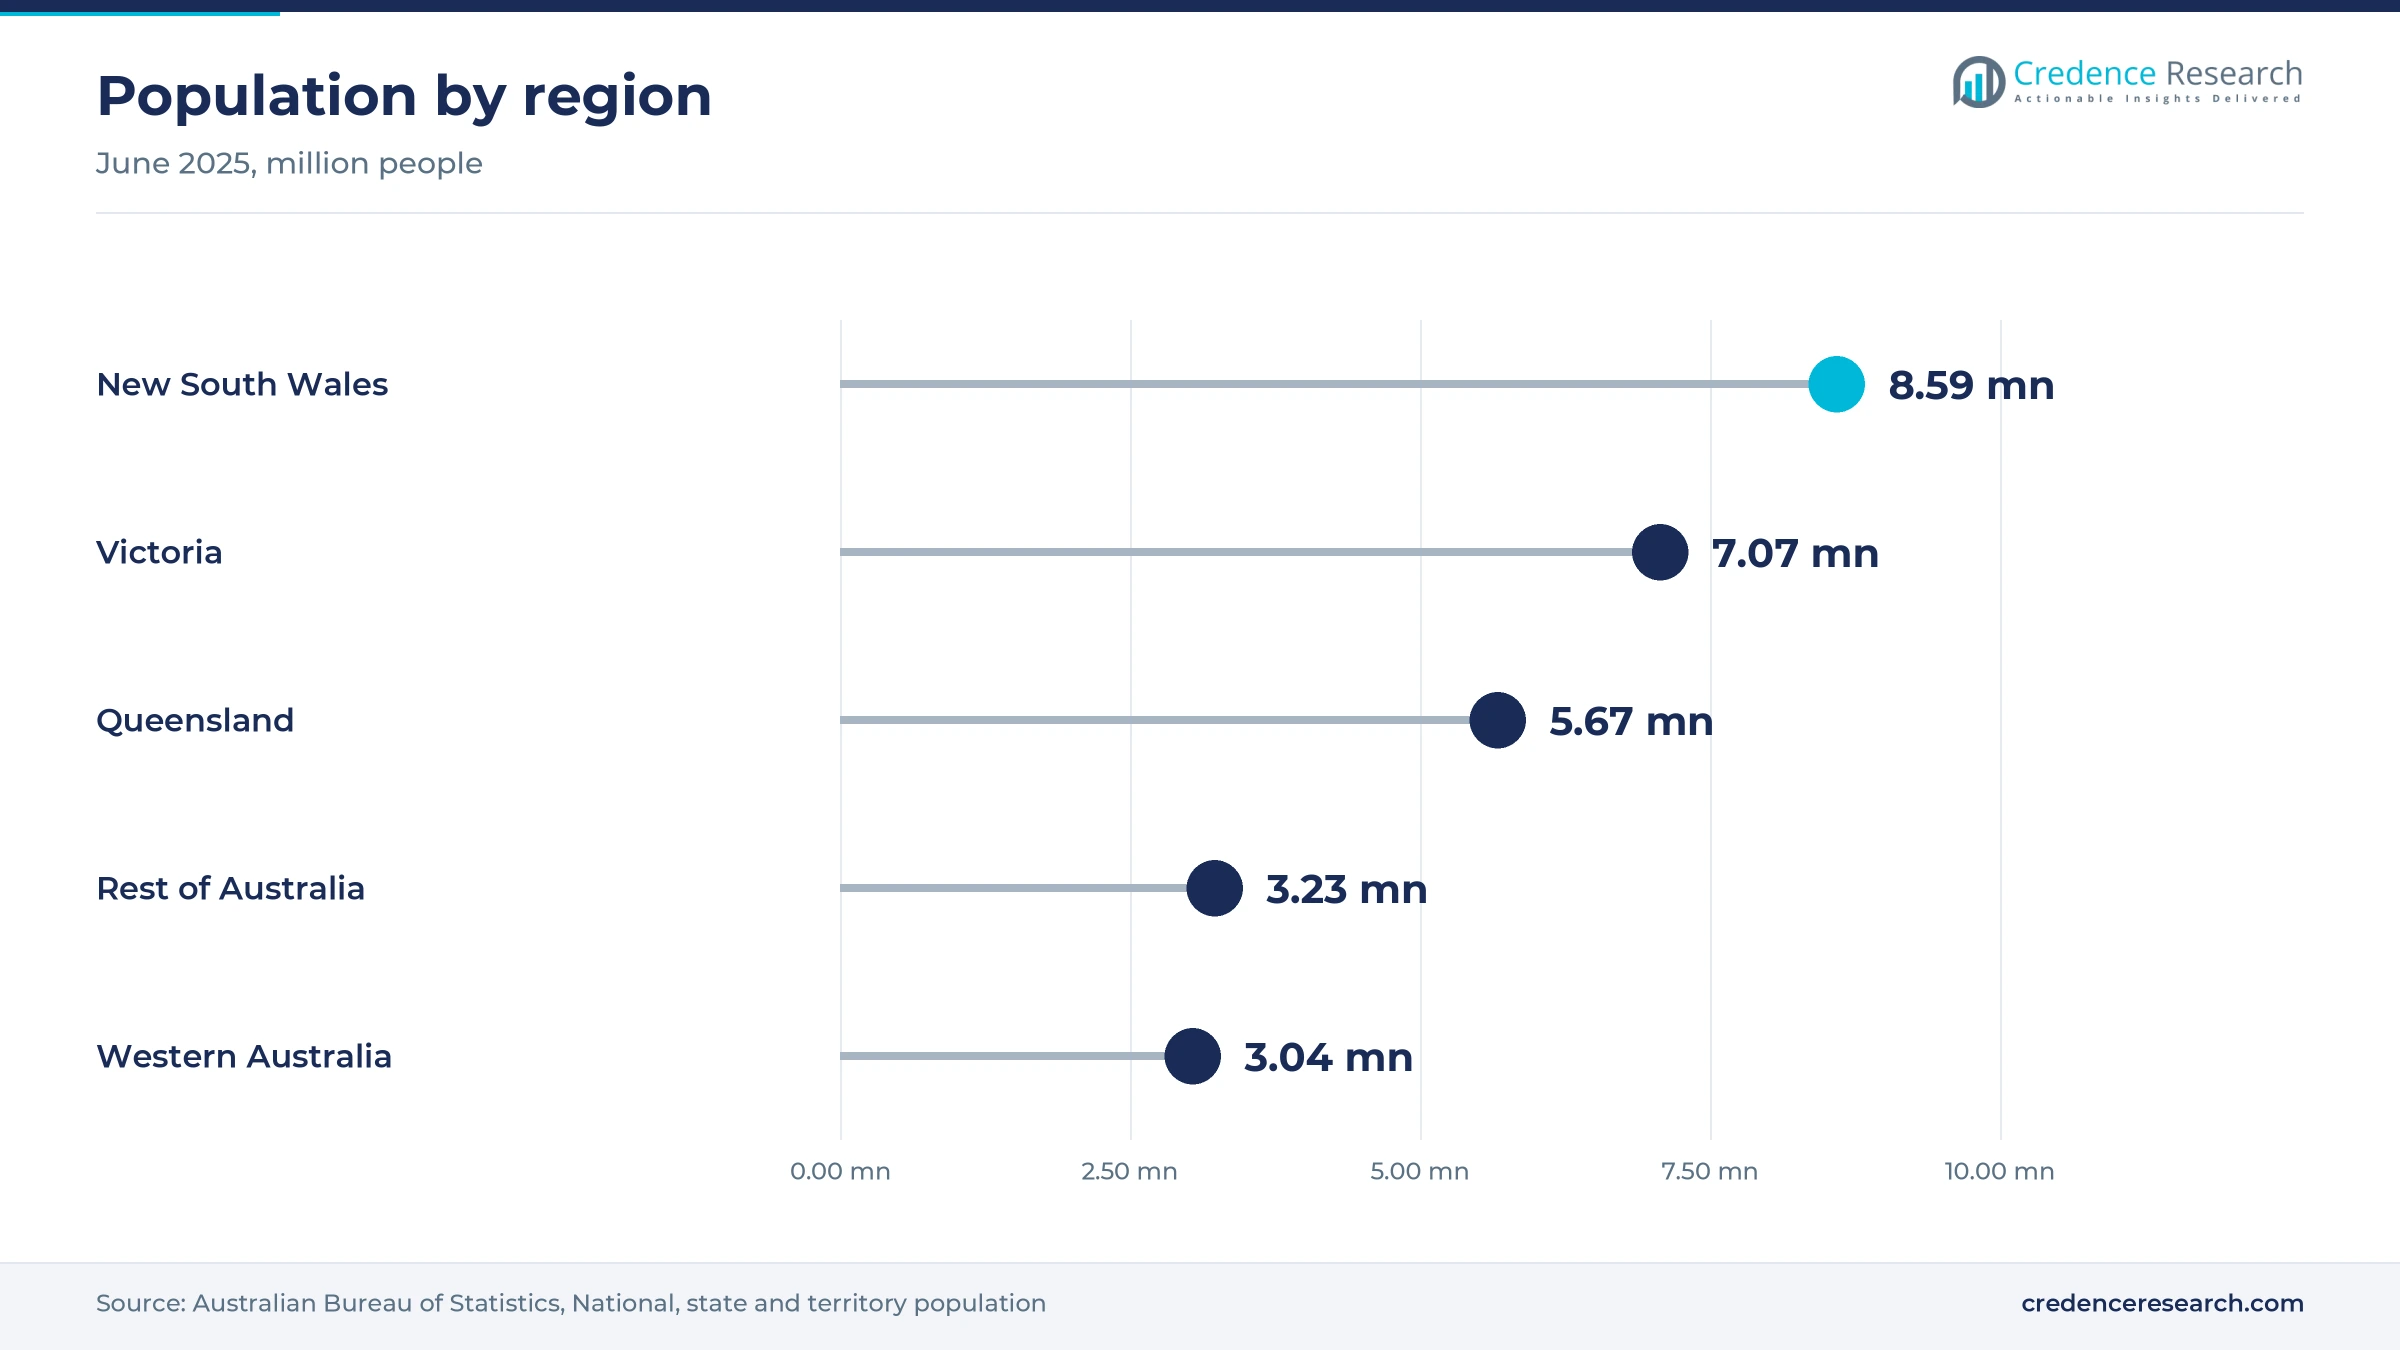
New South Wales held 30.5% of 2025 value and grows at 5.4% a year. The state counted 8.59 million people in June 2025, the largest base in the country, but its population grew only 1.2%, below the national 1.5%. Sydney's dense network of convenience stores and petrol stations supports high sales of chilled single-serve energy cans and iced coffee. Slower population growth means value gains depend on price and on a mix shift toward energy drinks.
Victoria grows with migration and Melbourne coffee habits
Victoria held 24.5% of 2025 value and grows at 5.8% a year. Its population rose 1.8% to 7.07 million in the year to June 2025, one of the fastest rates among the states. Melbourne's cafe culture anchors coffee consumption in the state, and packaged iced coffee competes for the same morning occasion. With 25.6% of the national population, Victoria is the second-largest regional market for chilled single-serve drinks, and value growth tracks migration-led household formation.
Queensland is the production hub for energy cans
Queensland held 22.0% of 2025 value and grows at 6.1% a year. It counted 5.67 million people in June 2025, up 1.8%, and its warm climate supports year-round chilled drink demand. The state is also the main production base for energy drinks, with the Richlands and Swanbank canning lines described in the drivers section both located near Brisbane. Local filling shortens supply routes into Queensland stores and gives eastern distribution a lower freight cost than imports.
Western Australia grows fastest on population gains
Western Australia held 11.5% of 2025 value and grows fastest at 6.3% a year. Its population rose 2.2% to 3.04 million in the year to June 2025, the fastest rate of any state. Most energy cans are filled in Queensland, so supplies to Perth cross the continent by road or rail, which raises delivered costs. Brands with efficient cross-country logistics can win shelf space as the state adds new households and workers.
Smaller states and territories show uneven demand
The rest of Australia, covering South Australia, Tasmania and the two territories, held 11.5% of 2025 value and grows at 5.2% a year. South Australia counted 1.90 million people in June 2025, up 1.1%, while Tasmania grew only 0.2%. Tasmania's Recycle Rewards scheme began only on May 1, 2025, so its shoppers are the latest to absorb the 10-cent deposit on every can and bottle. Slower population growth keeps these markets dependent on price and promotion.
Canning lines, a caffeine ruling and new coffee cans
| Development | Status and market relevance |
|---|---|
| In September 2024, Suntory Oceania started production at its AUD 400 million Swanbank plant in Ipswich with V Energy. | Production launch; the site was still being commissioned and was due to open fully in mid-2025 |
| In October 2024, Celsius rolled out in Australian supermarkets and convenience stores through Suntory Oceania. | Market launch; a 100 mg caffeine formula was used to meet local limits |
| In May 2025, Coca-Cola Europacific Partners unveiled a AUD 75 million canning line at Richlands for Monster products. | Operational launch; adds up to 120,000 cans an hour and 18 full-time roles |
| In March 2026, Food Standards Australia New Zealand approved its caffeine review for retail foods and sports foods. | Approval; food ministers were notified on March 24, 2026, and a two-year transition follows gazettal |
| In November 2026, Nestle launched its first canned Nescafe ready-to-drink coffee range in Australia. | Launch; sold through 7-Eleven and Woolworths with a national advertising campaign |
Sweetener systems and fast can lines reshape supply
- High-intensity and plant sweeteners let colas and energy drinks remove sugar, with plant extracts such as monk fruit now used in zero-sugar energy recipes.
- High-speed aluminum can lines spread fixed costs over national volumes, which favors bottlers with the scale to run them.
- Extended shelf life dairy processing keeps milk-based iced coffee stable through chilled distribution to supermarkets and petrol stations.
- Per-serve caffeine labeling will appear on strong packaged coffees under the 2026 caffeine review, so brands are redesigning packs and some are lowering caffeine per serve.
- Reduced-caffeine export formulas let foreign energy brands meet the 320 mg per liter limit, as Celsius did with a 100 mg can for Australia.
Need a Custom Version of This Report?
Tailor the scope, geography, or segments to your exact requirements.
- Custom geography or segment scope
- Direct access to our analyst team
Two bottlers, Red Bull and dairy groups split the shelf
Competition in the Australia caffeinated beverage market splits between two large bottlers, energy brand owners and dairy processors. Coca-Cola Europacific Partners bottles and sells Coca-Cola, Coca-Cola Zero Sugar and Monster. Asahi Lifestyle Beverages makes Pepsi, Pepsi Max and Mountain Dew under its PepsiCo agreement, a bottling relationship that had already run for 20 years when it was renewed in 2020, according to Food & Drink Business. Red Bull competes through brand strength and constant flavor editions, while Suntory Oceania sells V Energy and distributes Celsius from its Ipswich plant. Bega Cheese leads milk-based beverages with Dare and Farmers Union Iced Coffee, and Lactalis competes with OAK and Pauls. Supermarket ranging and promotion slots decide which brands win volume, and no public brand share statistics are published.
How is supply organized and where do margins sit?
Supply is concentrated in a few large bottlers and brand owners, because canning lines, route distribution and supermarket ranging need scale. Coca-Cola Europacific Partners bottles Coca-Cola brands and Monster, Asahi Lifestyle Beverages is PepsiCo Australia's exclusive bottler, and Suntory Oceania makes V Energy and distributes Celsius. Red Bull sells its cans as an independent brand owner with national ranging. Milk-based iced coffee belongs to dairy processors such as Bega Cheese and Lactalis because it needs chilled supply. Margins sit mainly with energy brand owners, while supermarkets capture value through promotion funding.
Companies profiled and their roles in this market
| Company | Type | Role in the market |
|---|---|---|
| Coca-Cola Europacific Partners | Bottler and distributor | Bottles and sells Coca-Cola, Coca-Cola Zero Sugar and Monster across Australia |
| Monster Beverage Corporation | Energy brand owner | Monster and Mother energy drinks canned locally in Brisbane |
| Red Bull GmbH | Energy brand owner | Red Bull Energy Drink, Sugarfree and Red Bull Zero cans |
| Suntory Oceania (Suntory Beverage & Food) | Manufacturer and distributor | V Energy made at Swanbank, plus exclusive Celsius distribution |
| Asahi Lifestyle Beverages (Asahi Group) | PepsiCo bottler | Makes Pepsi, Pepsi Max and Mountain Dew under its PepsiCo bottling agreement |
| Bega Cheese | Dairy processor | Dare and Farmers Union Iced Coffee milk-based coffee drinks |
| Lactalis Group (Lactalis Australia) | Dairy processor | OAK and Pauls flavored milk and real coffee iced drinks |
| Nestle | Coffee brand owner | Nescafe canned ready-to-drink coffee and espresso concentrates |
| Celsius Holdings | Energy brand owner | Celsius energy drinks with a 100 mg caffeine local formula |
Growth now rides on energy cans and zero-sugar recipes
Credence Research's view is that the Australia caffeinated beverage market now grows through energy cans and sugar-free recipes rather than through more cola volume. Official consumption data show energy drinks rising sharply and zero-sugar colas replacing full-sugar ones. Woolworths' record 15.1% online penetration in fiscal 2025 shows where incremental demand for multipacks is moving. The main risks are regulatory, from caffeine labels to possible age limits, and promotional, from supermarket price wars. The main evidence gaps are brand shares and foodservice sales, which no public source tracks, so the product and regional splits rest on Credence Research estimates.
ABS consumption data and shelf prices anchor values
The report uses 2025 as the base year and 2026 to 2035 as the forecast period. Market values come from the Credence Research model; this edition carries forward the previous estimate to 2025 at its own growth rate and checks it against ABS apparent consumption volumes and supermarket shelf prices. Regional and segment splits are Credence Research estimates based on ABS population data, consumption statistics, plant locations and company disclosures. Sources include the ABS, Food Standards Australia New Zealand, state health departments, company filings and releases, an industry association and trade press. No interviews or surveys were conducted for this edition of the report.
Energy, cold coffee and compliance shape 2035
Growth in the Australia caffeinated beverage market to 2035 rests on three conditions. Energy drinks must keep adding buyers without triggering age limits or new taxes. Cola brands must keep moving shoppers to zero-sugar recipes while holding price. Coffee brands and dairy processors must turn the cold coffee habit into repeat purchases of canned and bottled coffee that meet the new caffeine labels. If these hold, value grows faster than volume, and online sales grow fastest at 7.7% a year.
Energy demand and health rules decide the range
The range of outcomes depends on whether energy drink volumes keep rising and on how far regulators go on caffeine and sugar. The base case assumes steady energy growth, continued conversion to zero-sugar colas and a smooth transition to the new caffeine labels. The downside assumes age limits on energy drinks or a sugar levy that raises shelf prices, while the upside assumes faster growth in canned coffee and zero-sugar energy ranges that win new buyers.
| Scenario | CAGR, 2026–2035 | Value, 2035 | What has to hold |
|---|---|---|---|
| Downside | 4.2% | USD 3.40 billion | Age limits or a sugar levy cut energy volumes and raise prices for single serves |
| Base | 5.72% | USD 3.87 billion | Steady energy growth, zero-sugar cola conversion and smooth caffeine label changes |
| Upside | 7.2% | USD 4.39 billion | Canned coffee and zero-sugar energy ranges attract new buyers across the states |
Frequently Asked Questions
How big is the caffeinated beverage market in Australia?
Which energy drink brands lead in Australia?
How much caffeine can energy drinks contain in Australia?
Are sugar-free and diet sodas growing in Australia?
Is ready-to-drink coffee growing in Australia?
Who makes energy drinks in Australia?
What does the 2026 caffeine review change?
Which Australian state buys the most caffeinated drinks?
Table of Content
Chapter 1 Market Segmentation
- 1.1 Segmentation Framework
- 1.1.1 Product and Service Classification
- 1.1.2 Application and End-Use Classification
- 1.1.3 Technology and Solution Classification
- 1.1.4 Customer and Distribution Channel Classification
- 1.1.5 Geographic Segmentation
- 1.1.6 Market Segment Definitions and Boundaries
- 1.2 By Product
- 1.2.1 Carbonated Soft Drinks
- 1.2.2 Energy Drinks
- 1.2.3 RTD Tea and Coffee
- 1.2.4 Others
- 1.3 By Flavor
- 1.3.1 Synthetic
- 1.3.2 Natural
- 1.4 By Sales Channel
- 1.4.1 Offline
- 1.4.2 Online
Chapter 2 Introduction
- 2.1 Report Objectives and Scope
- 2.2 Product Definition and Industry Terminology
- 2.3 Market Inclusions and Exclusions
- 2.4 Research Process
- 2.4.1 Primary Research and Expert Interviews
- 2.4.2 Secondary Research and Source Review
- 2.4.3 Top-Down and Bottom-Up Estimation
- 2.4.4 Data Triangulation and Verification
- 2.5 Market Size Measurement Basis
- 2.5.1 2025: USD 2.22 billion → 2035: USD 3.87 billion
- 2.6 Historical and Forecast Reference Periods
- 2.6.1 Historical Period: 2018-2025
- 2.6.2 Base Year: 2025
- 2.6.3 Forecast Period: 2025-2035
- 2.7 Research Assumptions and Limitations
Chapter 3 Executive Summary
- 3.1 Market Snapshot and Key Findings
- 3.2 Base-Year Market Size, 2025
- 3.3 Forecast Market Size, 2035
- 3.4 Revenue and Volume Growth Outlook
- 3.5 Key Demand and Supply Indicators
- 3.6 Leading Market Segments
- 3.7 Fastest-Growing Market Opportunities
- 3.8 Regional Performance Highlights
- 3.9 Technology and Industry Transformation
- 3.10 Competitive Landscape Summary
- 3.11 Analyst View and Strategic Implications
Chapter 4 Australia Caffeinated Beverage Market Trends and Developments
- 4.1 Historical Industry Development, 2018-2025
- 4.2 Recent Market Trends and Developments
- 4.3 Demand and Customer Behavior Trends
- 4.4 Technology and Product Innovation
- 4.5 Artificial Intelligence, Automation and Digitalization
- 4.6 Local Manufacturing and Supply Chain Realignment
- 4.7 Industry Partnerships, Mergers and Acquisitions
- 4.8 Sustainability and Circular Economy Developments
- 4.9 Government and Private Sector Investment Trends
- 4.10 Emerging Business Models and Commercialization
- 4.11 Industry Developments and Announcements
Chapter 5 Australia Caffeinated Beverage Market Production, Supply and Demand Analysis
- 5.1 Demand Trend and Consumption Analysis, 2018-2025
- 5.2 Demand Forecast, 2025-2035
- 5.3 Production and Output Trend, 2018-2025
- 5.4 Production and Output Forecast, 2025-2035
- 5.5 Installed Capacity and Capacity Utilization
- 5.6 Company-Wise Production Plants and Statistics
- 5.6.1 Installed Production Capacity
- 5.6.2 Actual Production
- 5.6.3 Planned Capacity and Expansion Targets
- 5.7 Supply Chain Structure and Procurement Trends
- 5.8 Supply-Demand Gap and Bottlenecks
- 5.9 Import Dependence and Sourcing Structure
- 5.10 Contract Manufacturing and Outsourcing
- 5.11 Regional Supply and Demand Concentration
Chapter 6 Australia Caffeinated Beverage Market Pricing Analysis
- 6.1 Pricing Structure and Measurement
- 6.2 Historical Pricing Trends, 2018-2025
- 6.3 Pricing Outlook, 2025-2035
- 6.4 Average Selling Price and Unit Economics
- 6.5 Pricing by Product and Market Segment
- 6.6 Geographic Pricing Differences
- 6.7 Key Input, Energy, Labor and Logistics Costs
- 6.8 Contract Pricing and Purchasing Models
- 6.9 Pricing Sensitivity and Competitive Positioning
- 6.10 Price, Margin and Profitability Implications
Chapter 7 Australia Caffeinated Beverage Market Dynamics
- 7.1 Market Growth Drivers
- 7.1.1 Demand-Side Drivers
- 7.1.2 Technology and Innovation Drivers
- 7.1.3 Infrastructure and Investment Drivers
- 7.1.4 Regulatory and Policy Drivers
- 7.2 Market Restraints
- 7.2.1 Cost and Affordability Constraints
- 7.2.2 Technology and Adoption Barriers
- 7.2.3 Supply Chain and Operational Constraints
- 7.3 Market Challenges
- 7.3.1 Competitive Pressure and Margin Erosion
- 7.3.2 Skills, Infrastructure and Implementation Gaps
- 7.4 Emerging Market Opportunities
- 7.5 Market Dynamics Impact and Time-Horizon Assessment
Chapter 8 Australia Caffeinated Beverage Value Chain Analysis
- 8.1 Industry Value Chain Overview
- 8.2 Upstream Suppliers and Critical Inputs
- 8.3 Technology and Component Providers
- 8.4 Manufacturing or Service Delivery
- 8.5 Distribution, Channel Partners and Integrators
- 8.6 Downstream Applications and End Users
- 8.7 Value Addition and Profit Pools
- 8.8 Vertical Integration and Outsourcing
- 8.9 Supplier Concentration and Risk
- 8.10 Supply Chain Localization and Resilience
Chapter 9 Australia Caffeinated Beverage Market Regulations and Policies
- 9.1 Relevant Laws, Standards and Compliance Frameworks
- 9.2 Product, Service, Safety and Quality Requirements
- 9.3 Government Policies, Incentives and Subsidies
- 9.4 Imports, Exports and Trade Barriers
- 9.5 Public Procurement and Local Content Requirements
- 9.6 Environmental and Sustainability Compliance
- 9.7 Upcoming Policy Changes and Market Implications
Chapter 10 Australia Caffeinated Beverage Market Hotspots and Opportunities
- 10.1 Market Opportunity Mapping and Growth Hotspots
- 10.2 High-Growth Applications and Customer Groups
- 10.3 Underserved Markets and White-Space Opportunities
- 10.4 Emerging Technology and Product Opportunities
- 10.5 New Capacity and Investment Hotspots
- 10.6 Market Entry and Expansion Opportunities
- 10.7 Distribution and Partnership Opportunities
- 10.8 Near-Term and Long-Term Commercial Potential
- 10.9 Opportunity Attractiveness and Execution Risks
Chapter 11 Australia Caffeinated Beverage Market Outlook, 2025-2035
- 11.1 Market Size and Analysis
- 11.1.1 Revenue (Market Measurement: 2025: USD 2.22 billion → 2035: USD 3.87 billion)
- 11.1.2 Market Volume and Quantity Sold
- 11.1.3 Historical Market Size, 2018-2025
- 11.1.4 Base-Year Market Size, 2025
- 11.2 Market Forecast, 2025-2035
- 11.2.1 Revenue Forecast to 2035
- 11.2.2 Volume Forecast to 2035
- 11.2.3 CAGR and Year-on-Year Growth
- 11.2.4 Incremental Revenue Opportunity
- 11.3 Forecast Assumptions and Scenario Analysis
- 11.3.1 Base-Case Forecast
- 11.3.2 Optimistic and Conservative Scenarios
- 11.3.3 Technology, Pricing and Policy Sensitivities
- 11.4 Market Attractiveness and Growth Outlook
Chapter 12 Australia Caffeinated Beverage Market Segmentation and Outlook
- 12.1 Segmentation Summary and Market Shares, 2025
- 12.2 Largest and Fastest-Growing Segments
- 12.3 By Product - Market Size and Forecast, 2025-2035
- 12.3.1 Segment Definition and Scope
- 12.3.2 Historical Market Size, 2018-2025
- 12.3.3 Revenue Forecast, 2025-2035
- 12.3.4 Volume Forecast, 2025-2035
- 12.3.5 Base-Year Market Share, 2025
- 12.3.6 Segment CAGR and Growth Drivers
- 12.3.7 Subsegment Market Size and Forecast
- 12.3.7.1 Carbonated Soft Drinks
- 12.3.7.2 Energy Drinks
- 12.3.7.3 RTD Tea and Coffee
- 12.3.7.4 Others
- 12.3.8 Subsegment Pricing and Adoption Trends
- 12.3.9 Leading Suppliers and Competition
- 12.3.10 Regional Demand and Opportunities
- 12.4 By Flavor - Market Size and Forecast, 2025-2035
- 12.4.1 Segment Definition and Scope
- 12.4.2 Historical Market Size, 2018-2025
- 12.4.3 Revenue Forecast, 2025-2035
- 12.4.4 Volume Forecast, 2025-2035
- 12.4.5 Base-Year Market Share, 2025
- 12.4.6 Segment CAGR and Growth Drivers
- 12.4.7 Subsegment Market Size and Forecast
- 12.4.7.1 Synthetic
- 12.4.7.2 Natural
- 12.4.8 Subsegment Pricing and Adoption Trends
- 12.4.9 Leading Suppliers and Competition
- 12.4.10 Regional Demand and Opportunities
- 12.5 By Sales Channel - Market Size and Forecast, 2025-2035
- 12.5.1 Segment Definition and Scope
- 12.5.2 Historical Market Size, 2018-2025
- 12.5.3 Revenue Forecast, 2025-2035
- 12.5.4 Volume Forecast, 2025-2035
- 12.5.5 Base-Year Market Share, 2025
- 12.5.6 Segment CAGR and Growth Drivers
- 12.5.7 Subsegment Market Size and Forecast
- 12.5.7.1 Offline
- 12.5.7.2 Online
- 12.5.8 Subsegment Pricing and Adoption Trends
- 12.5.9 Leading Suppliers and Competition
- 12.5.10 Regional Demand and Opportunities
- 12.6 Segment Growth Comparison
- 12.7 Segment Attractiveness and Priority Matrix
Chapter 13 Australia Caffeinated Beverage Geographic Market Outlook, 2025-2035
- 13.1 Domestic Market Distribution and Demand Clusters
- 13.2 State- or Province-Wise Market Size and Forecast, 2025-2035
- 13.3 City and Metropolitan Market Outlook
- 13.4 Industrial, Manufacturing and Commercial Clusters
- 13.5 Geographic Concentration of Key End Users
- 13.6 Local Pricing and Purchasing Differences
- 13.7 Domestic Production Facilities and Capacity Map
- 13.8 Local Infrastructure and Project Pipeline
- 13.9 State-Level Policy and Incentive Differences
- 13.10 Subnational Investment Hotspots and Opportunities
- 13.11 Distribution and Logistics Networks
- 13.12 Domestic Competitive Footprint
Chapter 14 Australia Caffeinated Beverage Technology, Innovation and Sustainability Outlook
- 14.1 Technology Landscape and Maturity
- 14.2 Product, Process and Service Innovation
- 14.3 AI, Automation and Digital Tools in the Industry
- 14.4 Technology Adoption and Performance Benchmarking
- 14.5 Innovation Pipeline and R&D Investment
- 14.6 Patent and Intellectual Property Trends
- 14.7 Energy Efficiency and Resource Management
- 14.8 Sustainability, Recycling and Circularity
- 14.9 Technology Roadmap, 2025-2035
- 14.10 Risks of Obsolescence and Technology Substitution
Chapter 15 Australia Caffeinated Beverage Market Key Strategic Imperatives
- 15.1 Growth and Market Entry Priorities
- 15.2 High-Return Products and Segments
- 15.3 Pricing, Profitability and Cost Optimization
- 15.4 Technology Investment and Product Differentiation
- 15.5 Supply Chain Localization and Resilience
- 15.6 Distribution and Customer Acquisition
- 15.7 Partnership, Acquisition and Capacity Strategy
- 15.8 Regional Expansion Priorities
- 15.9 Short-, Medium- and Long-Term Actions
Chapter 16 Competition Outlook
- 16.1 Industry Competition Characteristics
- 16.2 Market Structure and Concentration
- 16.3 Market Share and Competitive Positioning, 2025
- 16.4 Company-Wise Revenue and Product Benchmarking
- 16.5 Production and Service Capacity Benchmarking
- 16.6 Technology, Pricing and Differentiation
- 16.7 Regional Footprint and Distribution Strength
- 16.8 Mergers, Acquisitions and Strategic Alliances
- 16.9 New Entrants and Competitive Threats
- 16.10 Porter's Five Forces and Industry Attractiveness
- 16.11 Competitive Outlook, 2025-2035
Chapter 17 Company Profiles
- 17.1 Company Coverage and Selection Criteria
- 17.2 Coca-Cola Europacific Partners
- 17.2.1 Business Description
- 17.2.2 Company Ownership and Geographic Presence
- 17.2.3 Product and Service Portfolio
- 17.2.4 Manufacturing and Operating Footprint
- 17.2.5 Production Capacity and Expansion Plans
- 17.2.6 Financial Performance and Investment
- 17.2.7 Market Share and Competitive Position
- 17.2.8 Technology and Innovation Capabilities
- 17.2.9 Strategic Alliances or Partnerships
- 17.2.10 Recent Developments
- 17.2.11 Growth Strategy and Outlook
- 17.3 Monster Beverage Corporation
- 17.4 Red Bull GmbH
- 17.5 Suntory Oceania (Suntory Beverage & Food)
- 17.6 Asahi Lifestyle Beverages (Asahi Group)
- 17.7 Bega Cheese
- 17.8 Lactalis Group (Lactalis Australia)
- 17.9 Nestle
- 17.10 Celsius Holdings
- 17.11 Other Relevant Market Participants
Note: Every listed company is profiled on the structure shown under the first company. The company list is preliminary and may change based on research findings, market developments, data availability and client requirements.
Chapter 18 Disclaimer
- 18.1 Research and Forecast Disclaimer
- 18.2 Data Source and Estimation Limitations
Note: The depth of individual sections depends on data availability for this market. Volume, capacity, trade and other unit-based metrics are included where applicable.