
Outsourced IT operations move to security and cloud
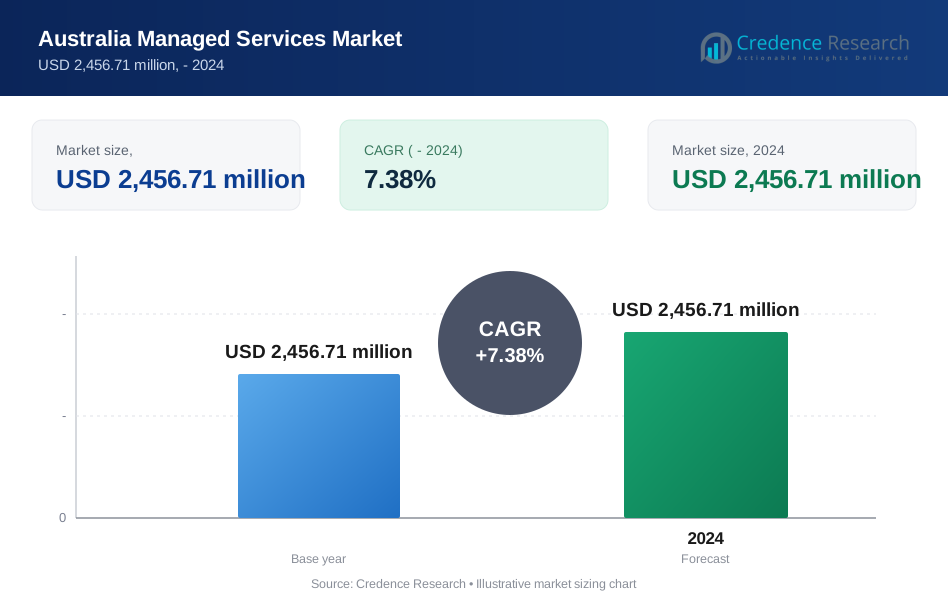
The Australia managed services market was valued at USD 5.46 billion in 2025 and is projected to increase from USD 5.86 billion in 2026 to USD 11.13 billion by 2035, registering a CAGR of 7.38% during 2026–2035. Demand comes from public agencies, banks, insurers and mid-sized firms that hand infrastructure, network and security operations to outside providers instead of hiring scarce specialists. New South Wales held the largest regional share, 35.0% in 2025, because Sydney concentrates state agencies, financial institutions and colocation capacity. The Rest of Australia zone, which includes the Australian Capital Territory, is the fastest-growing region at 8.0% a year as federal agencies renew network and hosting contracts. Commercially, a new prudential standard for banks and insurers took effect in July 2025, and it requires tighter oversight of material service providers. In turn, mandatory ransomware payment reporting began in May 2025, which lifts demand for monitored detection and response services across larger businesses.
Which recurring outsourced IT contracts are counted here?
The market counts recurring fees that Australian organizations pay outside providers to run IT infrastructure and data center hosting, networks, communication and collaboration platforms, and information security under service-level contracts. Buyers usually sign three-year to nine-year agreements through state and federal panels or direct enterprise tenders, and they pay monthly per device, per user or per workload.
The scope excludes one-off consulting, software licenses bought directly by the customer, hardware sales and in-house IT staff costs. The value chain runs from hyperscale and colocation operators through carriers and integrators to specialist security and support firms, which often deliver as subcontractors within larger government and corporate deals.
Australia Managed Services Market Insights
- The market was valued at USD 5.46 billion in 2025 and is projected to reach USD 11.13 billion by 2035, growing at a 7.38% CAGR during 2026–2035.
- New South Wales held the largest regional share in 2025, supported by state agency hosting, major banks and the Sydney data center cluster.
- Managed IT infrastructure & data center services held 32.0% of 2025 value, the largest service type in the market.
- Mandatory ransomware payment reporting began on May 30, 2025 for businesses above AU$3 million turnover, which pushes outsourced detection work.
- Amazon committed AU$20 billion for 2025 to 2029 to Australian data centers, which enlarges the cloud estate that providers manage.
Infrastructure contracts lead while security grows fastest
Why do infrastructure and data center contracts lead?
Based on service type, the market is categorized into managed IT infrastructure & data center, managed network, managed communication & collaboration, managed information & security, and others. Managed IT infrastructure & data center led with 32.0% of 2025 value because public agencies keep core hosting with outside operators. For example, the NSW Department of Communities and Justice extended AC3's AU$64.9 million storage, backup and network contract to 2027, according to techpartner.news in March 2025. Managed information & security grows fastest at 8.7% a year, as the Australian Signals Directorate responded to more than 1,200 incidents in 2024-25, an 11% rise on the prior year.
How far has cloud deployment moved ahead of on-premise?
Based on deployment type, the market is categorized into on-premise and cloud. Cloud led with 62.0% of 2025 value because hyperscale capacity now sits onshore close to buyers. Microsoft said in October 2023 that its Australian data center sites would grow from 20 to 29 under an A$5 billion investment across Canberra, Melbourne and Sydney. Cloud also grows fastest at 7.9% a year, as Amazon announced in June 2025 an AU$20 billion program to expand and operate its Australian data centers through 2029. On-premise contracts persist where agencies and banks still run legacy systems in their own facilities under strict data control rules.
Which buyers spend the most on outsourced operations?
Based on end user, the market is categorized into IT & telecom, BFSI, manufacturing & retail, government and others. BFSI led with 26.0% of 2025 value because APRA's CPS 230 standard, in force since July 1, 2025, makes banks and insurers manage material service providers under tighter contracts, according to iTnews. Government grows fastest at 8.1% a year, as state agencies keep renewing outsourced operations at scale. Victoria Police renewed its statewide end-to-end IT services deal with Kinetic IT for three more years at AU$185 million in July 2025, according to techpartner.news. Carriers and retailers also move internal platforms and store systems to outside partners.
Why are SMEs the fastest-growing buyer group?
Based on enterprise size, the market is categorized into large enterprises and SMEs. Large enterprises led with 64.0% of 2025 value because multi-year, whole-of-agency deals concentrate spending among a few buyers. The Australian Taxation Office's nine-year managed network services contract with Optus has grown to AU$637 million, according to Intermedium. SMEs grow fastest at 8.1% a year, as carriers now package support for them. Telstra Business offers a managed IT service in Basic, Standard and Premium tiers for firms with up to 500 staff, with a 24/7 service desk and Essential Eight-aligned security, as Pulse reported in March 2026.
| Segment Group | Leading Sub-segment | Share, 2025 | Fastest-growing Sub-segment | CAGR, 2026–2035 |
|---|---|---|---|---|
| By Service Type | Managed IT Infrastructure & Data Center | 32.0% | Managed Information & Security | 8.7% |
| By Deployment Type | Cloud | 62.0% | Cloud | 7.9% |
| By End User | BFSI | 26.0% | Government | 8.1% |
| By Enterprise Size | Large Enterprises | 64.0% | SMEs | 8.1% |
Request a Free Sample
Fill in your details and we'll send you a free sample report.
- Sample data tables & charts
- Research methodology
Cyber rules, agency re-tenders and data centers drive demand
Cyber incidents and ransomware reporting lift security outsourcing
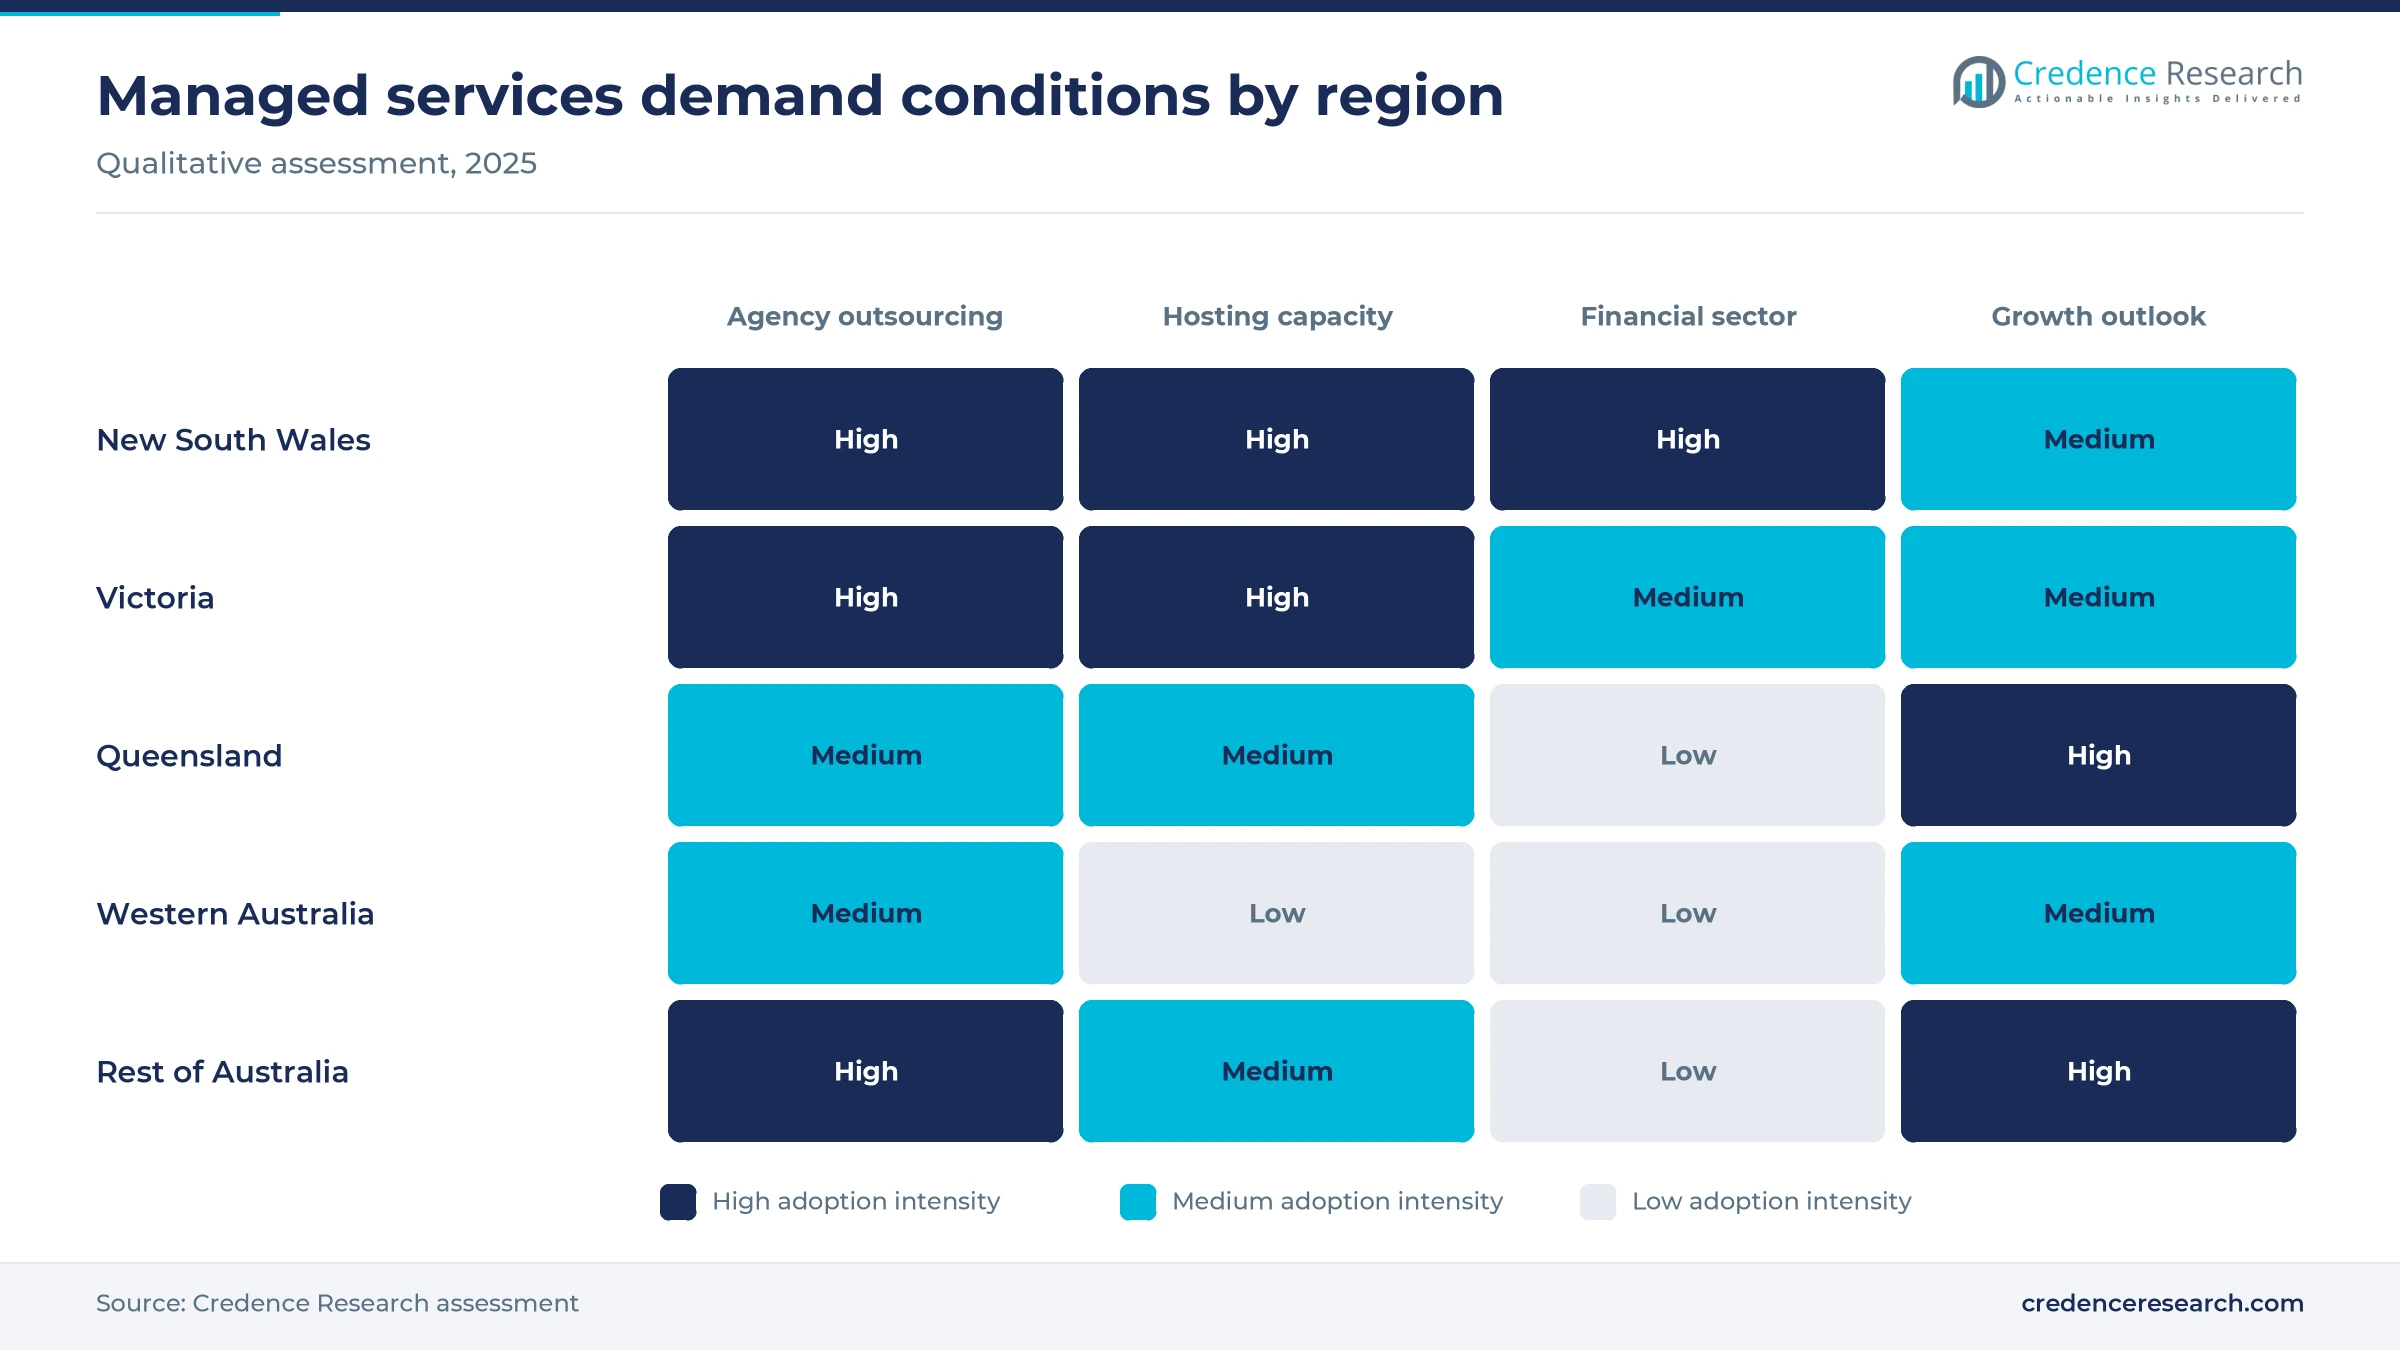
Rising cyber losses push Australian organizations to hand monitoring and response to specialist operators rather than build round-the-clock teams of their own. The Annual Cyber Threat Report released Oct. 14, 2025 counted more than 84,700 cybercrime reports in 2024-25, about one every six minutes, and more than 42,500 calls to the Australian Cyber Security Hotline. In turn, the Cyber Security Act 2024 made ransomware payment reporting mandatory from May 30, 2025 for businesses with annual turnover above AU$3 million, according to MinterEllison. Those reports are due within 72 hours of a payment, with no grace period for compliance. As a result, boards now treat detection, logging and incident response as compliance work, which favors providers that run security operations centers for many clients.
State agencies re-tender core technology operations
State governments are frequent buyers of outsourced operations, and their re-tendering cycle keeps money flowing to outside providers. In September 2025, the NSW Department of Customer Service said it would replace two long-standing outsourcing arrangements with one arrangement covering six capabilities, including managed network services, cloud services, FinOps and enterprise observability. The change splits NTT Australia's AU$34 million managed network deal, which runs to Dec. 31, 2025, and AC3's AU$39 million computing integration deal awarded in 2021. Because the new model admits multiple specialist providers, more firms can bid for each lot. These state contracts keep New South Wales the largest regional market, while government buyers grow at 8.1% a year.
Hyperscale data center build-out widens cloud operations work
Onshore data center investment is enlarging the cloud estate that customers need someone to run, tune and secure. In June 2025, Amazon announced a new AU$20 billion investment for 2025 to 2029 to expand, operate and maintain its Australian data center infrastructure. Microsoft's A$5 billion plan, announced in October 2023, was set to raise its computing capacity in the country by about 250%. NEXTDC lifted contracted utilization by 72.2 MW, or 42%, to 244.8 MW in fiscal 2025, according to techpartner.news, and reported a record forward order book of 133.9 MW. As a result, cloud deployment holds 62.0% of 2025 value, and providers grow cloud consulting and migration work alongside it.
APRA's CPS 230 rewrites bank and insurer supplier contracts
Operational resilience rules for financial institutions are turning supplier oversight into a contract requirement rather than a preference. APRA's CPS 230 standard on operational risk management took effect on July 1, 2025, after the regulator moved the start from January 2024, according to iTnews. The standard covers system resilience, business continuity, incident response and fourth-party risk, and it gives entities up to a further year to renegotiate contracts with existing providers. APRA also said contracts with material service providers should be updated as soon as possible. Because of this, service levels, exit plans and testing move into managed services agreements, and BFSI holds 26.0% of 2025 value.
AI operations and sovereign hosting reshape provider choice
AI-run operations shift managed services toward automation
Providers are moving routine monitoring, ticket triage and data platform work onto AI tools, which changes how contracts are priced and staffed. In January 2025, Telstra said it would invest A$100 million a year for seven years, A$700 million in total, in a joint venture with Accenture to modernize its data and AI platforms, according to iTWire. Telstra holds 40% of the venture and Accenture 60%, and the venture also targets reworking business processes with agentic AI. The NSW Department of Customer Service also listed FinOps and enterprise observability among six capabilities it moved to specialist providers in September 2025, according to iTnews. As a result, buyers ask for outcome-based service levels, and security operations center and MDR contracts increasingly bundle automated response.
Sovereign hosting rules shift public-sector supplier choice
Data sovereignty rules increasingly decide which providers can bid for public work, and this shift favors locally controlled operators. Under the Hosting Certification Framework, protected-level and whole-of-government data must be stored in certified assured or certified strategic data centers, according to iTnews. The Digital Transformation Agency certified four firms, Amazon Web Services, Vault Cloud, Sliced Tech and AUCloud, as the first strategic cloud providers on Oct. 7, 2021, according to the same publication. The agency's Cloud Marketplace, launched on April 1, 2021 to replace the Cloud Services Panel, opened with more than 300 providers, including small and medium firms. In turn, agencies can buy certified hosting and support without separate tenders, which shortens sales cycles for providers with strategic certification.
Packaged security and IT support for small businesses
Small businesses form the largest untapped pool of buyers, because few can staff security or IT support around the clock. Australia had 2,656,469 small businesses in June 2025, or 97.3% of all businesses, according to the Australian Small Business and Family Enterprise Ombudsman. The Australian Signals Directorate put the average self-reported cybercrime cost for a small business at AU$56,600 in 2024-25, up 14% on the previous year. The directorate's Cyber Security Partnership Program also counts more than 133,000 partners, which shows how many firms now seek outside security guidance. SMEs grow at 8.1% a year, so providers that sell fixed-price bundles with backup, endpoint protection and help desk support stand to gain.
Disaggregated state contracts open room for specialist operators
The break-up of large state outsourcing deals creates openings for mid-sized specialists that could not bid for whole-of-government bundles. In Western Australia, Kinetic IT won an estimated AU$96 million Main Roads WA contract in April 2025 covering service management, cyber security, cloud infrastructure and IT and OT network services. ProAV supplies meeting room solutions and Akkodis handles application services under that deal, which shows how prime contractors now share work with specialists. Kinetic IT also planned to add about 45 roles to deliver the contract. Western Australia grows at 7.5% a year, so providers with Perth delivery teams can win similar transport, utility and health tenders.
Skills gaps, legacy contracts and power limit delivery
Cloud and cybersecurity skills stay scarce
Providers compete with their own customers for a small pool of senior engineers. The 2026 Occupation Shortage List from Jobs and Skills Australia kept cloud engineers, DevOps engineers, cybersecurity architects and cyber governance specialists in national shortage for at least six years, according to Information Age in October 2026. Penetration testers were newly added to the list that year. As a result, providers pay more to staff security operations, and some move delivery to offshore centers, which regulated buyers often resist.
Legacy outsourcing contracts slow modernization
Many public contracts still reflect older delivery models, which delays the move to cloud-based managed operations. In September 2025, the NSW Department of Customer Service said its previous arrangements were built around legacy, on-premises environments and traditional service management models. Transitions between providers take years, because incumbent deals are often extended before a re-tender closes. In turn, providers carry the cost of running old and new platforms side by side during handovers.
Data center capacity and lead times strain delivery
Hosting providers must order equipment well before customers sign, which ties up capital and slows response to new demand. In February 2026, Macquarie Technology Group upsized its debt facility from AU$450 million to AU$500 million to fund long lead-time equipment for IC3 Super West in Macquarie Park, according to techpartner.news. The company said customers want larger capacity and faster lead times. The facility is scheduled to open in September 2026, so near-term capacity stays tight.
Power supply and planning approvals limit new capacity
Large data center projects depend on new power supply and planning consent, which can delay the cloud capacity that managed providers resell. NEXTDC bought its S7 site at Eastern Creek in October 2024 for about 550 MW of planned capacity, subject to development approval. Amazon also contracted more than 170 MW from three new solar farms in Victoria and Queensland to support its build-out. Because operators must secure their own energy, project timelines and hosting prices stay exposed to grid constraints.
New South Wales leads while the territories grow fastest
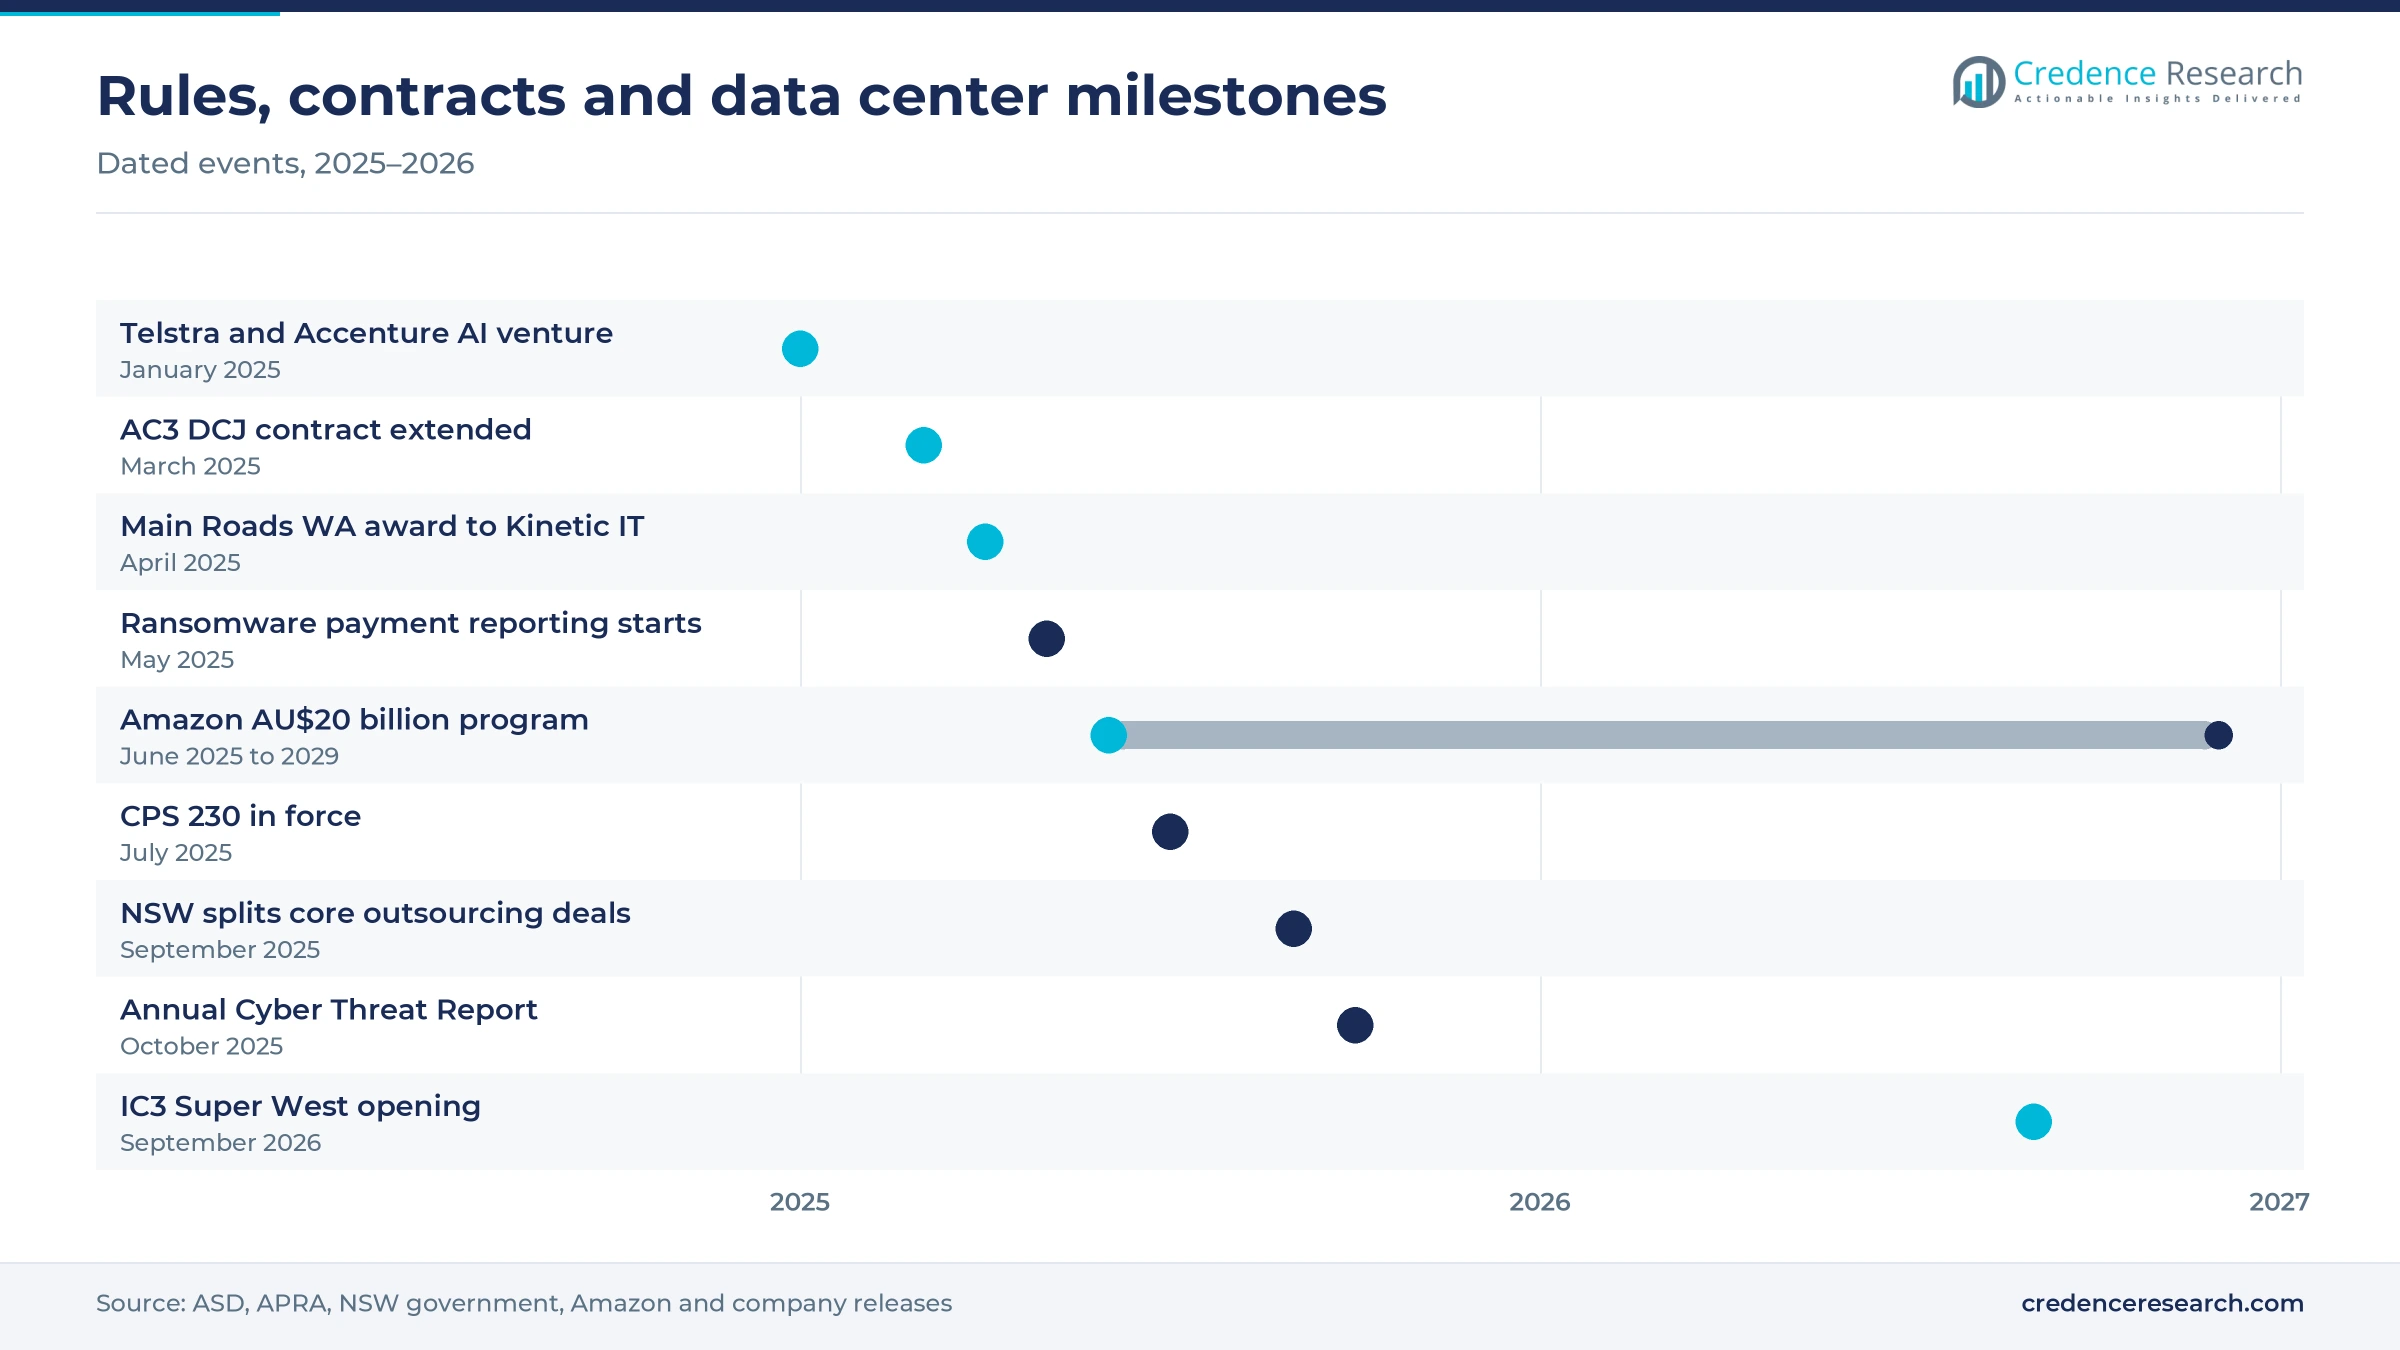
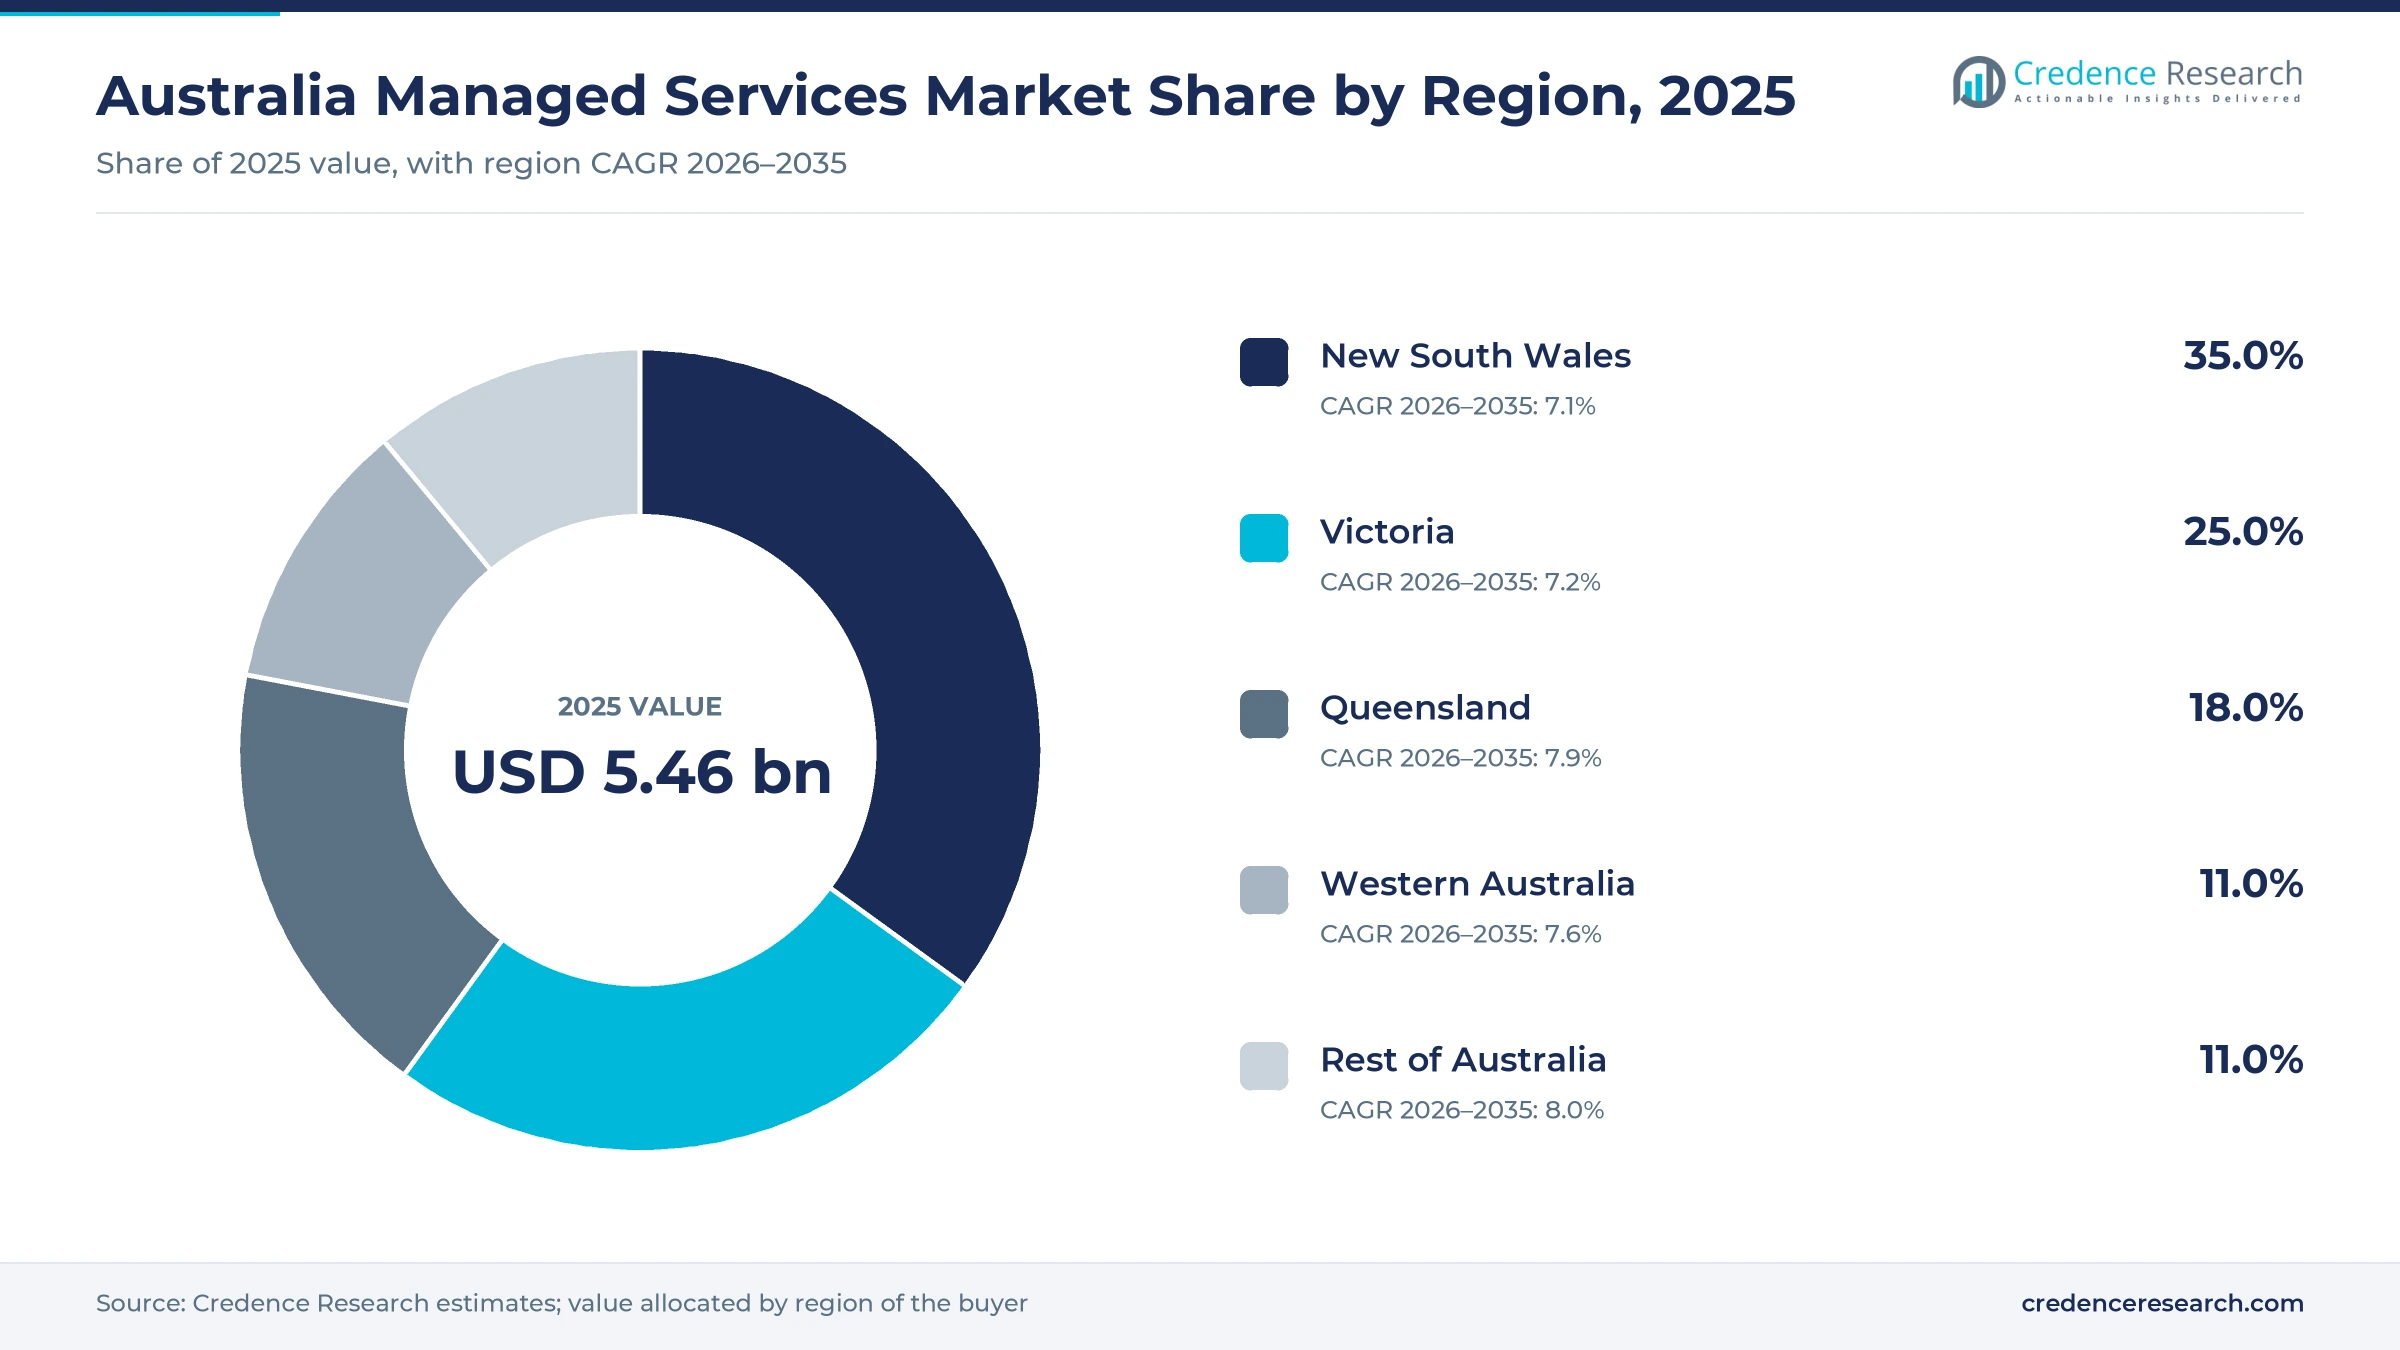
Regional demand follows the location of state agencies, financial headquarters and data center capacity across the country. Australia's economy produced about USD 1.80 trillion in 2025, according to World Bank data, and regional shares below are Credence Research estimates from state output, agency spending and hosting capacity.
| Region | Value, 2025 (USD billion) | Share, 2025 | CAGR, 2026–2035 |
|---|---|---|---|
| New South Wales | 1.91 | 35.0% | 7.0% |
| Victoria | 1.36 | 25.0% | 7.2% |
| Queensland | 0.98 | 18.0% | 7.8% |
| Western Australia | 0.60 | 11.0% | 7.5% |
| Rest of Australia | 0.60 | 11.0% | 8.0% |
New South Wales leads on state agencies and Sydney hosting
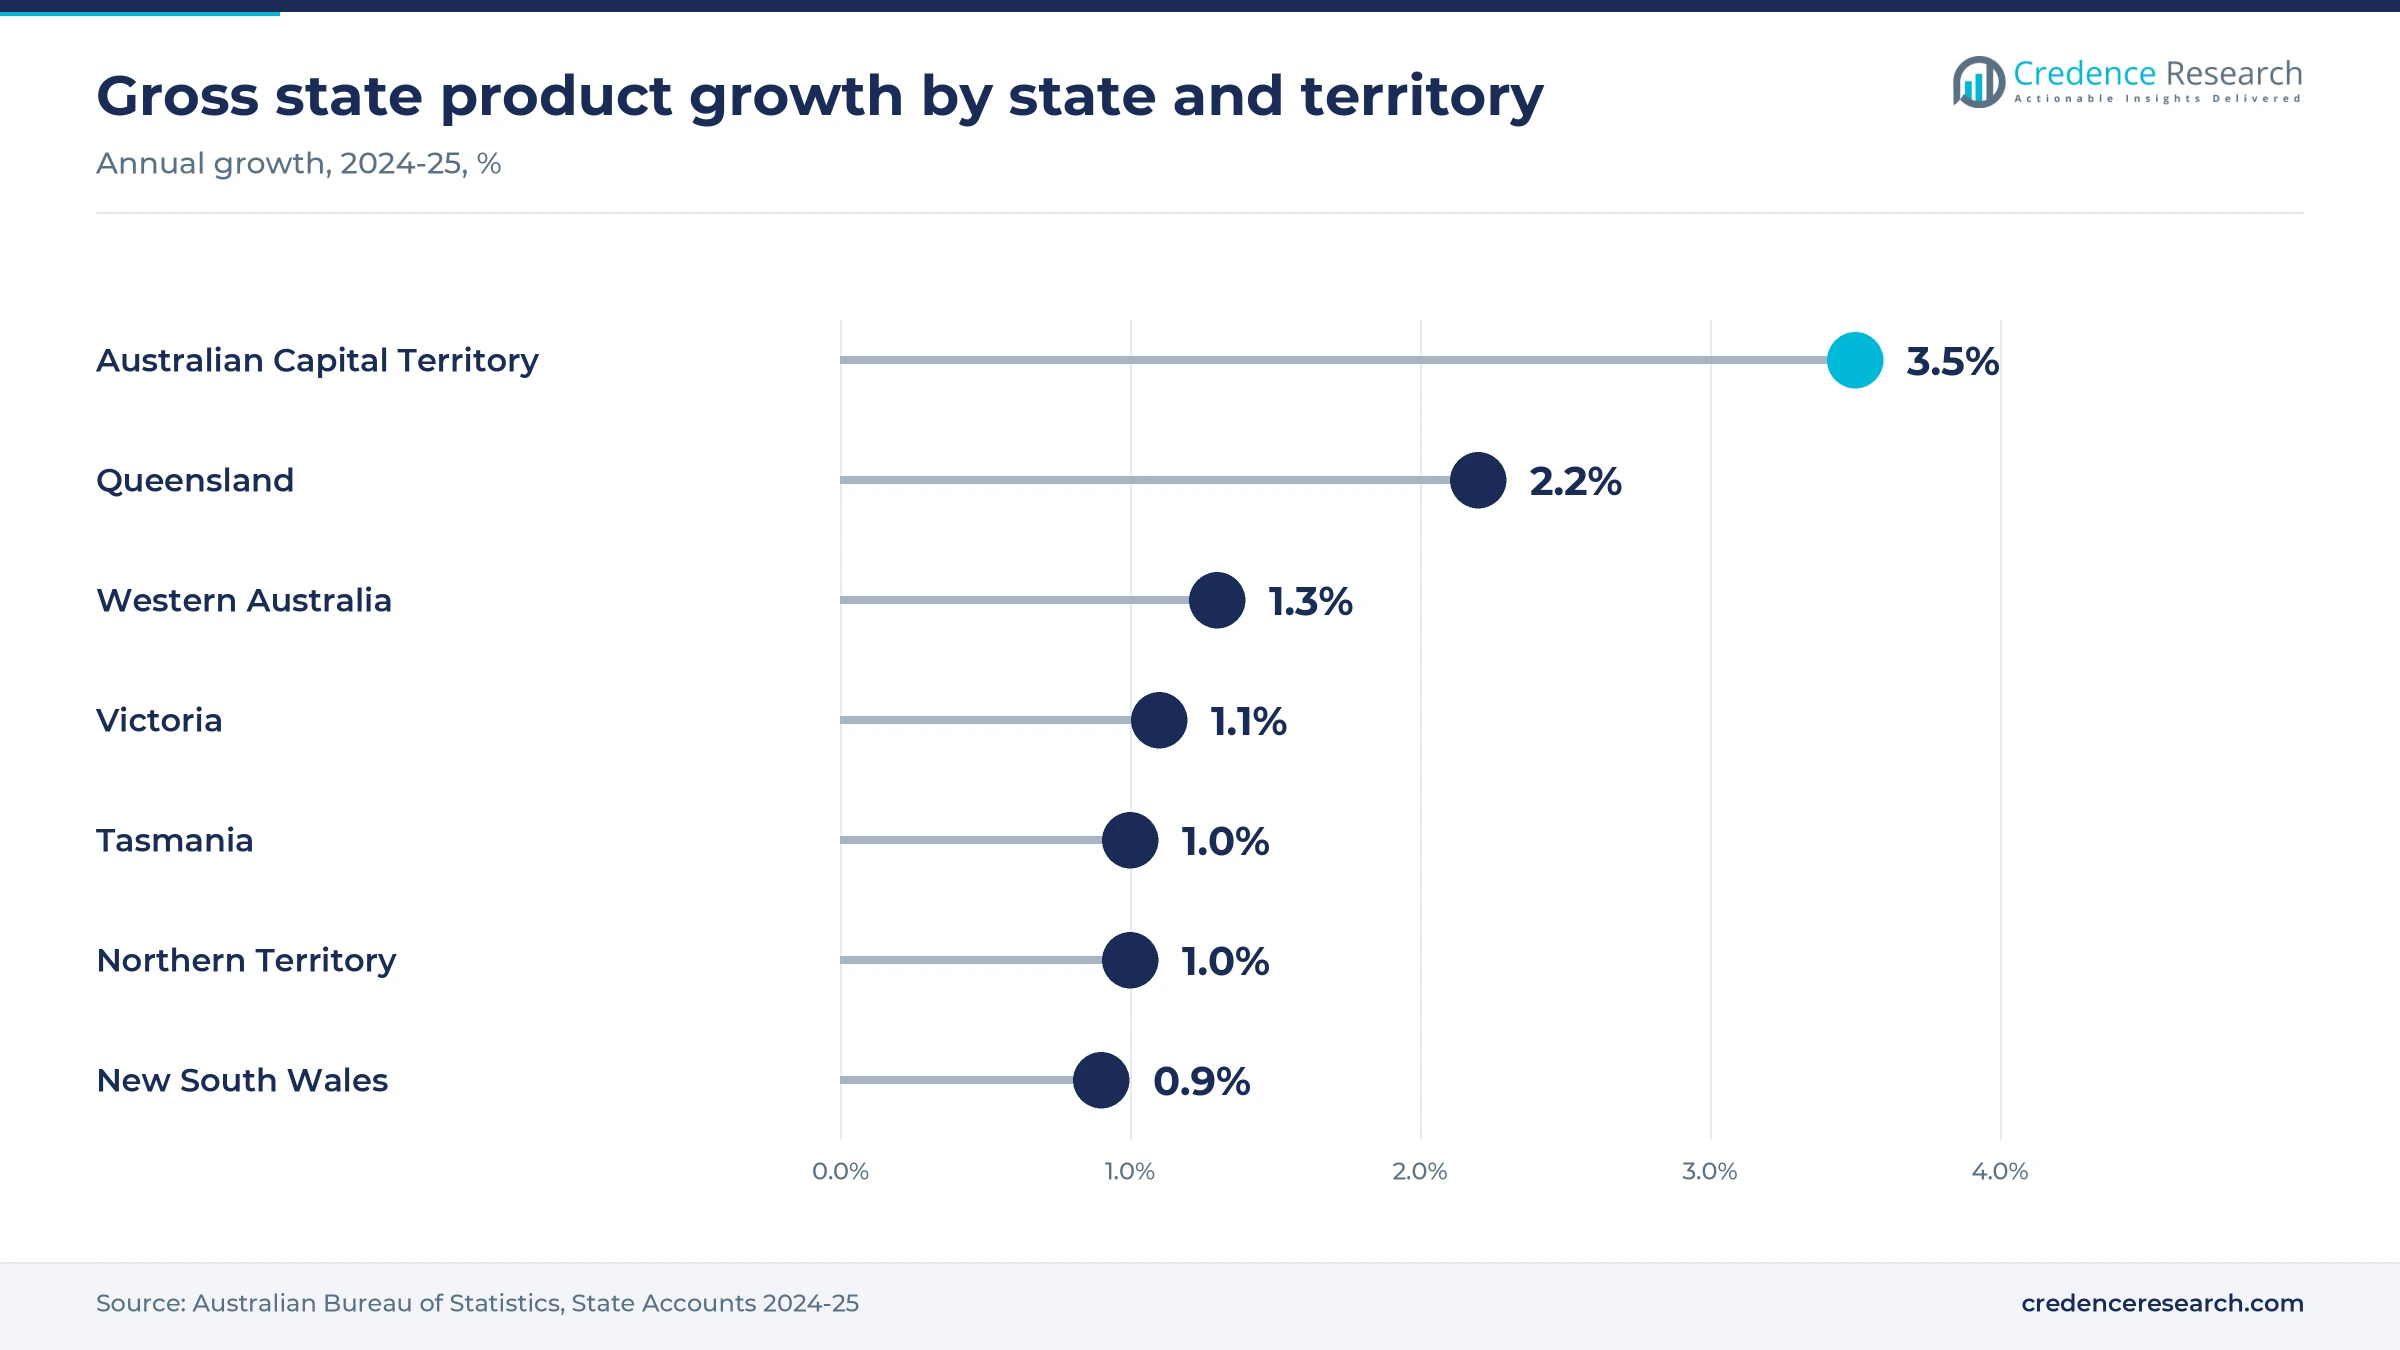
New South Wales held 35.0% of 2025 value and grows at 7.0% a year, the largest share in the country. Sydney hosts the NSW Government Data Centre used by AC3 for justice systems, and Macquarie Park hosts IC3 Super West. The state also houses the head offices of the major banks and insurers covered by CPS 230. However, New South Wales gross state product grew only 0.9% in 2024-25, according to the Australian Bureau of Statistics, which tempers new private spending.
Victoria grows on police, health and cloud campuses
Victoria held 25.0% of 2025 value and grows at 7.2% a year, supported by Melbourne's corporate and public-sector base. Victoria Police kept its statewide IT services with Kinetic IT and DXC Technology, and Melbourne is one of the three cities in Microsoft's data center expansion. Amazon's new solar farms in Victoria support its local cloud operations. Gross state product rose 1.1% in 2024-25, according to the Australian Bureau of Statistics, which keeps demand growth steady.
Queensland adds demand on faster economic growth
Queensland held 18.0% of 2025 value and grows at 7.8% a year, faster than the two largest states. Gross state product rose 2.2% in 2024-25, the second-strongest result after the Australian Capital Territory, according to the Australian Bureau of Statistics. Brisbane agencies, mining services firms and health networks buy outsourced support and hosting from local and national providers. Amazon's solar farms in Queensland also add renewable supply for data center operations in the eastern states.
Western Australia relies on transport and police contracts
Western Australia held 11.0% of 2025 value and grows at 7.5% a year. Perth-based Kinetic IT leads the Main Roads WA contract with ProAV and Akkodis, which shows how state agencies buy bundled operations from local primes. Resources companies also outsource network and security monitoring for remote sites. Gross state product rose 1.3% in 2024-25, according to the Australian Bureau of Statistics, which supports steady renewal of state agency contracts.
The territories and smaller states grow fastest
Rest of Australia, which covers South Australia, Tasmania, the Australian Capital Territory and the Northern Territory, held 11.0% of 2025 value and grows fastest at 8.0% a year. The Australian Capital Territory recorded the strongest gross state product growth, 3.5% in 2024-25, according to the Australian Bureau of Statistics. Canberra hosts federal agencies such as the Australian Taxation Office, whose Optus network contract shows the scale of federal outsourcing, and it hosts hyperscale data center capacity as well.
AI ventures, contract wins and hosting funding
| Development | Status and market relevance |
|---|---|
| In January 2025, Telstra agreed to invest A$700 million over seven years in a data and AI joint venture with Accenture. | Announced; the venture modernizes Telstra platforms and builds agentic AI capability for its operations |
| In March 2025, the NSW Department of Communities and Justice extended AC3's AU$64.9 million infrastructure contract to 2027. | Contract extended; covers storage, backup, network services and hosting from the NSW Government Data Centre |
| In April 2025, Kinetic IT won an estimated AU$96 million contract for end-to-end technology services at Main Roads WA. | Awarded; Kinetic IT planned about 45 new roles to deliver the work |
| In June 2025, Amazon announced AU$20 billion for 2025 to 2029 to expand and operate its Australian data centers. | Investment program under way; adds cloud capacity that managed providers operate for clients |
| In February 2026, Macquarie Technology Group upsized its debt capacity to AU$500 million to speed IC3 Super West capacity. | Funding in place; the facility is scheduled to open in September 2026 |
Automation, detection and FinOps tools change delivery
- AI-driven operations tools triage tickets, predict faults and automate routine fixes, which lets providers serve more endpoints per engineer and price contracts on outcomes rather than on staff hours.
- Managed detection and response platforms collect logs across many clients, flag intrusions around the clock and support the 72-hour ransomware payment reporting duty that applies to larger businesses.
- FinOps and enterprise observability services track cloud spending and system health in one view, and the NSW government now buys them as separate capabilities from specialist providers.
- Sovereign cloud and certified hosting keep protected government data in certified assured or certified strategic facilities inside Australia, which narrows the field of eligible providers for agency work.
Need a Custom Version of This Report?
Tailor the scope, geography, or segments to your exact requirements.
- Custom geography or segment scope
- Direct access to our analyst team
Carriers, local primes and hyperscalers vie for deals
Competition mixes national carriers, local integrators, global IT services firms and hyperscale cloud operators. Telstra and Optus compete on bundled network, security and support contracts, and Optus holds one of the largest federal network deals with the Australian Taxation Office. Local primes such as Kinetic IT in Western Australia and Victoria, and AC3 in New South Wales, win state agency work by pairing local delivery teams with subcontracted specialists. DXC Technology and NTT DATA hold long-running government operations contracts, although NSW is now splitting its larger deals into specialist lots. Macquarie Technology Group competes on certified, locally controlled hosting and managed cloud, while Accenture, Kyndryl and Datacom run large managed infrastructure, network and security contracts on the cloud platforms of Amazon Web Services and Microsoft. Price, certification level, security operations capability and local staffing decide most tenders, and renewals increasingly test AI-driven automation and outcome-based service levels.
Companies profiled and their roles in this market
| Company | Type | Role in the market |
|---|---|---|
| Telstra Group | Carrier and service provider | Managed network, security and SMB IT support tiers; A$700 million AI venture with Accenture |
| Optus | Carrier | Managed network services for the Australian Taxation Office under a nine-year contract |
| Accenture | Global IT services firm | Managed application, cloud and security services, adding CyberCX under an August 2025 deal |
| Kyndryl | Global infrastructure services firm | Managed infrastructure and mainframe services, certified strategic provider for government zCloud |
| Datacom | Regional IT services firm | Managed network and IT service desk contracts for Transport for NSW |
| DXC Technology | Global IT services firm | Part of the Victoria Police IT services arrangement |
| NTT DATA | Global IT services firm | NSW whole-of-government managed network services deal running to December 2025 |
| Kinetic IT | Local integrator | End-to-end IT services for Main Roads WA and Victoria Police |
| AC3 | Local managed services provider | Infrastructure and hosting for the NSW Department of Communities and Justice |
| Macquarie Technology Group | Hosting and cloud provider | IC3 Super West data center in Macquarie Park opening September 2026 |
Security and sovereign cloud will decide the next renewals
Credence Research's view is that security operations and sovereign cloud management will decide most contract renewals through 2035. Ransomware payment reporting, CPS 230 and the Hosting Certification Framework all reward providers that can show audited local delivery and fast incident response. At the same time, NSW's move to specialist lots and the Main Roads WA award show that buyers now split work across several firms rather than one prime. Providers that combine automation with scarce cloud and cyber staff should hold margins, while those relying on headcount-based pricing face pressure as AI tools spread.
How Credence Research sized the market
The report uses 2025 as the base year and forecasts the market to 2035, with growth rates for 2026–2035. Market values come from the Credence Research model, which starts from national IT services spending and the share delivered under recurring managed contracts, and checks the result against public contract values. Regional, segment and growth splits are Credence Research estimates built from Australian Bureau of Statistics state accounts, World Bank GDP data, government contract notices, regulator publications and company announcements. No interviews or surveys were used to prepare this edition of the report.
Managed services spending keeps rising through 2035
The market is expected to grow from USD 5.86 billion in 2026 to USD 11.13 billion by 2035, at a 7.38% CAGR. Security services and cloud operations will take a larger share of spending as reporting rules tighten and hyperscale capacity comes online after 2026. Government buyers will keep re-tendering in smaller lots, which favors specialists and local primes. Small businesses will move toward packaged support as cyber losses rise, while large banks and insurers renegotiate contracts to meet resilience rules. Skills shortages and data center power supply remain the main limits on how fast providers can grow.
Frequently Asked Questions
How big is the Australia managed services market?
Which service type leads the market?
How fast are managed security services growing in Australia?
Which region leads the market?
Who are the main managed service providers in Australia?
How does CPS 230 affect managed services contracts?
Why are small businesses buying more managed IT and security services?
How does cloud deployment compare with on-premise?
Table of Content
Chapter 1 Market Segmentation
- 1.1 Segmentation Framework
- 1.1.1 Product and Service Classification
- 1.1.2 Application and End-Use Classification
- 1.1.3 Technology and Solution Classification
- 1.1.4 Customer and Distribution Channel Classification
- 1.1.5 Geographic Segmentation
- 1.1.6 Market Segment Definitions and Boundaries
- 1.2 By Service Type
- 1.2.1 Managed IT Infrastructure & Data Center
- 1.2.2 Managed Network
- 1.2.3 Managed Communication & Collaboration
- 1.2.4 Managed Information & Security
- 1.2.5 Others
- 1.3 By Deployment Type
- 1.3.1 Cloud
- 1.3.2 On-premise
- 1.4 By End User
- 1.4.1 IT & Telecom
- 1.4.2 BFSI
- 1.4.3 Manufacturing & Retail
- 1.4.4 Government
- 1.4.5 Others
- 1.5 By Enterprise Size
- 1.5.1 Large Enterprises
- 1.5.2 SMEs
Chapter 2 Introduction
- 2.1 Report Objectives and Scope
- 2.2 Product Definition and Industry Terminology
- 2.3 Market Inclusions and Exclusions
- 2.4 Research Process
- 2.4.1 Primary Research and Expert Interviews
- 2.4.2 Secondary Research and Source Review
- 2.4.3 Top-Down and Bottom-Up Estimation
- 2.4.4 Data Triangulation and Verification
- 2.5 Market Size Measurement Basis
- 2.5.1 2025: USD 5.46 billion → 2035: USD 11.13 billion
- 2.6 Historical and Forecast Reference Periods
- 2.6.1 Historical Period: 2018-2025
- 2.6.2 Base Year: 2025
- 2.6.3 Forecast Period: 2025-2035
- 2.7 Research Assumptions and Limitations
Chapter 3 Executive Summary
- 3.1 Market Snapshot and Key Findings
- 3.2 Base-Year Market Size, 2025
- 3.3 Forecast Market Size, 2035
- 3.4 Revenue and Volume Growth Outlook
- 3.5 Key Demand and Supply Indicators
- 3.6 Leading Market Segments
- 3.7 Fastest-Growing Market Opportunities
- 3.8 Regional Performance Highlights
- 3.9 Technology and Industry Transformation
- 3.10 Competitive Landscape Summary
- 3.11 Analyst View and Strategic Implications
Chapter 4 Australia Managed Services Market Trends and Developments
- 4.1 Historical Industry Development, 2018-2025
- 4.2 Recent Market Trends and Developments
- 4.3 Demand and Customer Behavior Trends
- 4.4 Technology and Product Innovation
- 4.5 Artificial Intelligence, Automation and Digitalization
- 4.6 Local Manufacturing and Supply Chain Realignment
- 4.7 Industry Partnerships, Mergers and Acquisitions
- 4.8 Sustainability and Circular Economy Developments
- 4.9 Government and Private Sector Investment Trends
- 4.10 Emerging Business Models and Commercialization
- 4.11 Industry Developments and Announcements
Chapter 5 Australia Managed Services Market Supply and Demand Analysis
- 5.1 Demand Trend and Consumption Analysis, 2018-2025
- 5.2 Demand Forecast, 2025-2035
- 5.3 Supply Chain Structure and Procurement Trends
- 5.4 Supply-Demand Gap and Bottlenecks
- 5.5 Import Dependence and Sourcing Structure
- 5.6 Regional Supply and Demand Concentration
Chapter 6 Australia Managed Services Market Pricing Analysis
- 6.1 Pricing Structure and Measurement
- 6.2 Historical Pricing Trends, 2018-2025
- 6.3 Pricing Outlook, 2025-2035
- 6.4 Pricing by Product and Market Segment
- 6.5 Geographic Pricing Differences
- 6.6 Key Input, Energy, Labor and Logistics Costs
- 6.7 Contract Pricing and Purchasing Models
- 6.8 Pricing Sensitivity and Competitive Positioning
- 6.9 Price, Margin and Profitability Implications
Chapter 7 Australia Managed Services Market Dynamics
- 7.1 Market Growth Drivers
- 7.1.1 Demand-Side Drivers
- 7.1.2 Technology and Innovation Drivers
- 7.1.3 Infrastructure and Investment Drivers
- 7.1.4 Regulatory and Policy Drivers
- 7.2 Market Restraints
- 7.2.1 Cost and Affordability Constraints
- 7.2.2 Technology and Adoption Barriers
- 7.2.3 Supply Chain and Operational Constraints
- 7.3 Market Challenges
- 7.3.1 Competitive Pressure and Margin Erosion
- 7.3.2 Skills, Infrastructure and Implementation Gaps
- 7.4 Emerging Market Opportunities
- 7.5 Market Dynamics Impact and Time-Horizon Assessment
Chapter 8 Australia Managed Services Value Chain Analysis
- 8.1 Industry Value Chain Overview
- 8.2 Upstream Suppliers and Critical Inputs
- 8.3 Technology and Component Providers
- 8.4 Manufacturing or Service Delivery
- 8.5 Distribution, Channel Partners and Integrators
- 8.6 Downstream Applications and End Users
- 8.7 Value Addition and Profit Pools
- 8.8 Vertical Integration and Outsourcing
- 8.9 Supplier Concentration and Risk
- 8.10 Supply Chain Localization and Resilience
Chapter 9 Australia Managed Services Market Regulations and Policies
- 9.1 Relevant Laws, Standards and Compliance Frameworks
- 9.2 Product, Service, Safety and Quality Requirements
- 9.3 Government Policies, Incentives and Subsidies
- 9.4 Imports, Exports and Trade Barriers
- 9.5 Public Procurement and Local Content Requirements
- 9.6 Data Protection, AI and Cybersecurity Compliance
- 9.7 Upcoming Policy Changes and Market Implications
Chapter 10 Australia Managed Services Market Hotspots and Opportunities
- 10.1 Market Opportunity Mapping and Growth Hotspots
- 10.2 High-Growth Applications and Customer Groups
- 10.3 Underserved Markets and White-Space Opportunities
- 10.4 Emerging Technology and Product Opportunities
- 10.5 New Capacity and Investment Hotspots
- 10.6 Market Entry and Expansion Opportunities
- 10.7 Distribution and Partnership Opportunities
- 10.8 Near-Term and Long-Term Commercial Potential
- 10.9 Opportunity Attractiveness and Execution Risks
Chapter 11 Australia Managed Services Market Outlook, 2025-2035
- 11.1 Market Size and Analysis
- 11.1.1 Revenue (Market Measurement: 2025: USD 5.46 billion → 2035: USD 11.13 billion)
- 11.1.2 Historical Market Size, 2018-2025
- 11.1.3 Base-Year Market Size, 2025
- 11.2 Market Forecast, 2025-2035
- 11.2.1 Revenue Forecast to 2035
- 11.2.2 CAGR and Year-on-Year Growth
- 11.2.3 Incremental Revenue Opportunity
- 11.3 Forecast Assumptions and Scenario Analysis
- 11.3.1 Base-Case Forecast
- 11.3.2 Optimistic and Conservative Scenarios
- 11.3.3 Technology, Pricing and Policy Sensitivities
- 11.4 Market Attractiveness and Growth Outlook
Chapter 12 Australia Managed Services Market Segmentation and Outlook
- 12.1 Segmentation Summary and Market Shares, 2025
- 12.2 Largest and Fastest-Growing Segments
- 12.3 By Service Type - Market Size and Forecast, 2025-2035
- 12.3.1 Segment Definition and Scope
- 12.3.2 Historical Market Size, 2018-2025
- 12.3.3 Revenue Forecast, 2025-2035
- 12.3.4 Base-Year Market Share, 2025
- 12.3.5 Segment CAGR and Growth Drivers
- 12.3.6 Subsegment Market Size and Forecast
- 12.3.6.1 Managed IT Infrastructure & Data Center
- 12.3.6.2 Managed Network
- 12.3.6.3 Managed Communication & Collaboration
- 12.3.6.4 Managed Information & Security
- 12.3.6.5 Others
- 12.3.7 Subsegment Pricing and Adoption Trends
- 12.3.8 Leading Suppliers and Competition
- 12.3.9 Regional Demand and Opportunities
- 12.4 By Deployment Type - Market Size and Forecast, 2025-2035
- 12.4.1 Segment Definition and Scope
- 12.4.2 Historical Market Size, 2018-2025
- 12.4.3 Revenue Forecast, 2025-2035
- 12.4.4 Base-Year Market Share, 2025
- 12.4.5 Segment CAGR and Growth Drivers
- 12.4.6 Subsegment Market Size and Forecast
- 12.4.6.1 Cloud
- 12.4.6.2 On-premise
- 12.4.7 Subsegment Pricing and Adoption Trends
- 12.4.8 Leading Suppliers and Competition
- 12.4.9 Regional Demand and Opportunities
- 12.5 By End User - Market Size and Forecast, 2025-2035
- 12.5.1 Segment Definition and Scope
- 12.5.2 Historical Market Size, 2018-2025
- 12.5.3 Revenue Forecast, 2025-2035
- 12.5.4 Base-Year Market Share, 2025
- 12.5.5 Segment CAGR and Growth Drivers
- 12.5.6 Subsegment Market Size and Forecast
- 12.5.6.1 IT & Telecom
- 12.5.6.2 BFSI
- 12.5.6.3 Manufacturing & Retail
- 12.5.6.4 Government
- 12.5.6.5 Others
- 12.5.7 Subsegment Pricing and Adoption Trends
- 12.5.8 Leading Suppliers and Competition
- 12.5.9 Regional Demand and Opportunities
- 12.6 By Enterprise Size - Market Size and Forecast, 2025-2035
- 12.6.1 Segment Definition and Scope
- 12.6.2 Historical Market Size, 2018-2025
- 12.6.3 Revenue Forecast, 2025-2035
- 12.6.4 Base-Year Market Share, 2025
- 12.6.5 Segment CAGR and Growth Drivers
- 12.6.6 Subsegment Market Size and Forecast
- 12.6.6.1 Large Enterprises
- 12.6.6.2 SMEs
- 12.6.7 Subsegment Pricing and Adoption Trends
- 12.6.8 Leading Suppliers and Competition
- 12.6.9 Regional Demand and Opportunities
- 12.7 Segment Growth Comparison
- 12.8 Segment Attractiveness and Priority Matrix
Chapter 13 Australia Managed Services End-Use and Application Market Outlook
- 13.1 End-Use Industry and Customer Demand Structure
- 13.2 Leading Applications and Customer Groups
- 13.3 End-Use Market Size, Share and Forecast
- 13.4 Major End-Use Industry Deep Dives
- 13.4.1 Customer Requirements and Use Cases
- 13.4.2 Demand and Replacement Cycles
- 13.4.3 Technical and Regulatory Considerations
- 13.4.4 Purchasing and Procurement Models
- 13.4.5 Leading Vendors and Distribution Channels
- 13.4.6 Forecast and Commercial Opportunities
- 13.5 Emerging Applications and Cross-Segment Demand
- 13.6 End-Use Industry Investment Priorities
Chapter 14 Australia Managed Services Geographic Market Outlook, 2025-2035
- 14.1 Domestic Market Distribution and Demand Clusters
- 14.2 State- or Province-Wise Market Size and Forecast, 2025-2035
- 14.3 City and Metropolitan Market Outlook
- 14.4 Industrial, Manufacturing and Commercial Clusters
- 14.5 Geographic Concentration of Key End Users
- 14.6 Local Pricing and Purchasing Differences
- 14.7 Domestic Production Facilities and Capacity Map
- 14.8 Local Infrastructure and Project Pipeline
- 14.9 State-Level Policy and Incentive Differences
- 14.10 Subnational Investment Hotspots and Opportunities
- 14.11 Distribution and Logistics Networks
- 14.12 Domestic Competitive Footprint
Chapter 15 Australia Managed Services Technology, Innovation and Sustainability Outlook
- 15.1 Technology Landscape and Maturity
- 15.2 Product, Process and Service Innovation
- 15.3 AI, Automation and Digital Tools in the Industry
- 15.4 Technology Adoption and Performance Benchmarking
- 15.5 Innovation Pipeline and R&D Investment
- 15.6 Energy Efficiency and Resource Management
- 15.7 Sustainability, Recycling and Circularity
- 15.8 Technology Roadmap, 2025-2035
- 15.9 Risks of Obsolescence and Technology Substitution
Chapter 16 Australia Managed Services Market Key Strategic Imperatives
- 16.1 Growth and Market Entry Priorities
- 16.2 High-Return Products and Segments
- 16.3 Pricing, Profitability and Cost Optimization
- 16.4 Technology Investment and Product Differentiation
- 16.5 Supply Chain Localization and Resilience
- 16.6 Distribution and Customer Acquisition
- 16.7 Partnership, Acquisition and Capacity Strategy
- 16.8 Regional Expansion Priorities
- 16.9 Short-, Medium- and Long-Term Actions
Chapter 17 Competition Outlook
- 17.1 Industry Competition Characteristics
- 17.2 Market Structure and Concentration
- 17.3 Market Share and Competitive Positioning, 2025
- 17.4 Company-Wise Revenue and Product Benchmarking
- 17.5 Production and Service Capacity Benchmarking
- 17.6 Technology, Pricing and Differentiation
- 17.7 Regional Footprint and Distribution Strength
- 17.8 Mergers, Acquisitions and Strategic Alliances
- 17.9 New Entrants and Competitive Threats
- 17.10 Porter's Five Forces and Industry Attractiveness
- 17.11 Competitive Outlook, 2025-2035
Chapter 18 Company Profiles
- 18.1 Company Coverage and Selection Criteria
- 18.2 Telstra Group
- 18.2.1 Business Description
- 18.2.2 Company Ownership and Geographic Presence
- 18.2.3 Product and Service Portfolio
- 18.2.4 Manufacturing and Operating Footprint
- 18.2.5 Financial Performance and Investment
- 18.2.6 Market Share and Competitive Position
- 18.2.7 Technology and Innovation Capabilities
- 18.2.8 Strategic Alliances or Partnerships
- 18.2.9 Recent Developments
- 18.2.10 Growth Strategy and Outlook
- 18.3 Optus
- 18.4 Accenture
- 18.5 Kyndryl
- 18.6 Datacom
- 18.7 DXC Technology
- 18.8 NTT DATA
- 18.9 Kinetic IT
- 18.10 AC3
- 18.11 Macquarie Technology Group
- 18.12 Other Relevant Market Participants
Note: Every listed company is profiled on the structure shown under the first company. The company list is preliminary and may change based on research findings, market developments, data availability and client requirements.
Chapter 19 Disclaimer
- 19.1 Research and Forecast Disclaimer
- 19.2 Data Source and Estimation Limitations
Note: The depth of individual sections depends on data availability for this market. Volume, capacity, trade and other unit-based metrics are included where applicable.

