Market Overview:
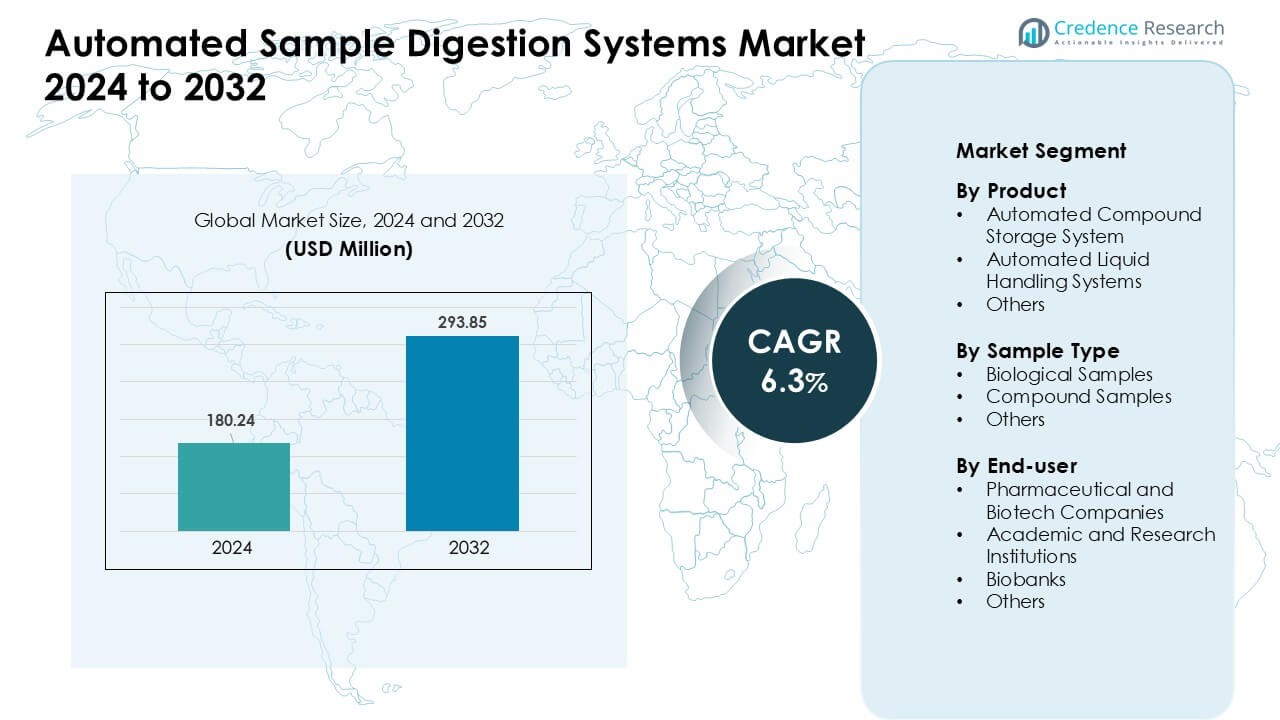
Automated Sample Digestion Systems Market was valued at USD 180.24 million in 2024 and is anticipated to reach USD 293.85 million by 2032, growing at a CAGR of 6.3% during the forecast period.
| REPORT ATTRIBUTE |
DETAILS |
| Historical Period |
2020-2023 |
| Base Year |
2024 |
| Forecast Period |
2025-2032 |
| Automated Sample Digestion Systems Market Size 2024 |
USD 180.24 Million |
| Automated Sample Digestion Systems Market, CAGR |
6.3% |
| Automated Sample Digestion Systems Market Size 2032 |
USD 293.85 Million |
North America led the Automated Sample Digestion Systems Market in 2024 with about 37% share, driven by strong adoption across pharmaceutical, biotech, and academic laboratories. The market is shaped by major players such as Aurora, PerkinElmer, Milestone Srl, CEM Corporation, SEAL Analytical, Anton Paar, SCP SCIENCE, HORIBA, Berghof Products + Instruments, and Analytik Jena. These companies strengthen competitiveness through advanced automated digestion platforms, improved safety features, and strong compatibility with mass spectrometry workflows. Their focus on precision, throughput, and software-driven control helps expand adoption across high-throughput research and regulated testing environments, supporting continued regional leadership.
Access crucial information at unmatched prices!
Request your sample report today & start making informed decisions powered by Credence Research Inc.!
Download Sample
Market Insights:
- The Automated Sample Digestion Systems Market reached USD24 million in 2024 value and will grow at a steady CAGR of 6.3% through 2032.
- Rising demand for high-throughput workflows drives adoption as liquid handling systems held about 46% share in 2024.
- Smart automation trends expand as labs use integrated robotics and connected platforms to improve speed and accuracy.
- Key players compete through advanced digestion units and software upgrades that support precise and safe sample handling.
- North America led with about 37% share in 2024, while Asia-Pacific grew fast, and biological samples dominated the sample type segment with nearly 52% share.
Market Segmentation Analysis:
By Product
Automated Liquid Handling Systems held the dominant position in 2024 with about 46% share. These systems gained strong demand due to rising needs for high-throughput workflows and lower manual error rates. Labs in pharmaceuticals and biotech favored these platforms because they support precise pipetting and consistent sample preparation. Vendors also added advanced software and integrated robotics, which improved speed and accuracy. Automated compound storage systems expanded as firms increased chemical library sizes, while other products grew steadily but remained smaller because users prioritized flexible liquid handling for routine digestion tasks.
- For instance, Beckman Coulter Life Sciences offers the Biomek family of automated liquid handling workstations that allow processing of 96 samples or more in a single run, enabling labs to prepare 50 micrograms of protein from 96 samples for tryptic digestion in under one hour.
By Sample Type
Biological Samples led this segment in 2024 with nearly 52% share. Growth came from rising use of genomic, proteomic, and cell-based studies that require controlled digestion steps. Automated systems helped labs process large volumes with improved reproducibility and cleaner downstream results. Many researchers adopted closed and contamination-free digestion modules to handle sensitive biological materials. Compound samples saw steady uptake in chemical and drug screening programs, yet their share stayed lower because biological workflows formed the core application across clinical and life-science labs.
- For instance, a recent proteomics study using a fully automated workflow processed 192 cell-derived samples in six hours leading to identification of approximately 8,000 protein groups and 130,000 peptide precursors per day when combined with a high-sensitivity mass spectrometer.
By End-user
Pharmaceutical and Biotech Companies dominated the end-user segment in 2024 with about 48% share. These organizations relied on automated digestion to support high-volume screening, regulated workflows, and fast drug discovery timelines. Adoption increased as firms pursued higher accuracy, reduced manual workload, and improved traceability across quality-controlled environments. Academic and research institutions expanded usage for omics research but lacked the same scale of industrial throughput. Biobanks also contributed growth through standardized sample handling, while other users held smaller shares due to limited processing needs.
Key Growth Drivers:
Rising Demand for High-Throughput Sample Processing
Growing need for high-throughput workflows remains a major driver for the Automated Sample Digestion Systems Market. Research labs, biopharma companies, and analytical facilities handle rising sample loads from genomics, proteomics, metabolomics, and pharmaceutical screening. Manual digestion slows downstream analysis and increases variability, so automated platforms help teams maintain consistent processing speed and accuracy. Many users also adopt automation to support strict timelines in drug discovery and regulated testing. Higher throughput reduces bottlenecks across LC-MS and GC-MS pipelines, which strengthens operational efficiency. This shift continues as modern labs upgrade legacy systems to scalable and reliable digestion units that support larger study volumes without extra staffing.
- For instance, a recent end-to-end automated workflow described in the literature processed 96 samples in one run for bottom-up proteomics, handling the full pipeline of protein concentration determination and digestion before LC-MS analysis.
Greater Focus on Accuracy and Reproducibility
Growing focus on reproducibility pushes more laboratories toward automated digestion. Manual steps often create inconsistencies in digestion temperature, reagent handling, and timing, which impact final measurement quality. Automated systems reduce human error and maintain controlled conditions across every cycle. Pharmaceutical companies depend on these improvements for validated workflows, while academic labs use them to improve data integrity. Consistent performance supports regulatory compliance and method standardization across global sites. As precision medicine, biomarker discovery, and quality-controlled testing expand, demand for reliable digestion grows further. This push for reproducible and traceable workflows remains a core driver behind automation investment.
- For instance, a 2024 study reported an automated digestion workflow achieving over 94% digestion efficiency and more than 98% efficiency in TMT labeling, with intra- and inter-batch reproducibility (i.e., consistency across runs) maintained at high levels.
Expanding Adoption in Regulated and Industrial Workflows
Expanding adoption across regulated industries drives market growth. Pharmaceutical, biotech, environmental testing, and food safety labs must meet strict documentation and quality requirements. Automated digestion supports electronic records, batch tracking, and validated protocols that help teams meet compliance standards. Many organizations also seek to cut manual workload and reduce operator exposure to hazardous reagents. Automated modules help maintain safety while improving throughput and cost control. As more industries shift to digital QA/QC frameworks, automated digestion becomes central to routine testing. This trend strengthens as regulatory agencies emphasize audit-ready workflows and consistent analytical performance across large networks.
Key Trends & Opportunities:
Rising Integration with Robotics and Smart Laboratory Systems
Integration with robotics and digital lab platforms has emerged as a key trend. Labs increasingly connect automated digestion units with robotic arms, sample tracking tools, and cloud-based workflow systems. This setup enables end-to-end automation from sample receipt to analytical output, improving both speed and reliability. Growing use of AI-enabled scheduling and predictive maintenance also enhances uptime. These improvements help large research centers streamline operations and reduce turnaround time. Vendors continue adding smart functions, such as automated calibration, real-time monitoring, and adaptive workflows, which strengthen system utility across complex analytical environments.
- For instance, a fully automated sample-preparation workflow on the Opentrons OT-2 robot processed 192 samples in parallel within approximately 6 hours, covering protein extraction, digestion, cleanup, and direct loading onto Evotips producing samples ready for LC-MS/MS without manual intervention.
Growth in Multi-Omics and Advanced Research Applications
Another major trend comes from rapid expansion of multi-omics research. Genomics, proteomics, metabolomics, lipidomics, and environmental molecular studies rely on consistent digestion steps before analysis. Automated digestion supports cleaner extraction, lower contamination risk, and better compatibility with mass spectrometry systems. Funding for advanced research programs across biotech, agriculture, and personalized medicine also fuels demand. This creates opportunities for manufacturers to offer flexible systems that handle diverse sample types, from tissues and cells to chemical compounds. Growing cross-disciplinary studies continue to widen the application scope and encourage adoption of modular, adaptable digestion platforms.
- For instance, a unified automated sample-preparation method demonstrated effective recovery of lipids, metabolites, and proteins from the same biological sample making it suitable for untargeted metabolomics, lipidomics, and proteomics in a single run.
Key Challenges:
High Upfront Investment and Operational Costs
High upfront cost remains a key challenge for wider adoption. Many labs, especially academic and small research centers, face budget constraints and hesitate to invest in advanced digestion platforms. Automated units require specialized components, integration software, and trained operators, which increase both capital and operational expenses. Maintenance contracts, consumables, and calibration cycles add recurring costs that smaller facilities struggle to sustain. These financial barriers slow adoption in price-sensitive regions. Vendors try to ease this issue by offering leasing models and scalable systems, but affordability remains a limiting factor for broad market penetration.
Workflow Complexity and Integration Barriers
Workflow complexity creates another challenge as many labs struggle to integrate automated digestion systems with existing instruments and software. Older LC-MS and GC-MS setups may require custom links or upgraded infrastructure, which delays installation. Users also need training to manage calibration, method setup, and troubleshooting. Inconsistent lab IT environments can limit connectivity between digestion units, LIMS platforms, and robotic handlers. These integration issues raise implementation time and reduce operational efficiency in the early stages. As labs modernize and vendors expand compatibility features, these challenges will ease, but they continue to slow adoption in traditional setups today.
Regional Analysis:
North America
North America held the leading position in the Automated Sample Digestion Systems Market in 2024 with about 37% share. Growth came from strong adoption in pharmaceutical, biotech, and academic labs that rely on automated workflows to support high-throughput research. The region benefits from advanced mass spectrometry networks, strong regulatory frameworks, and high investment in precision medicine programs. Major companies also expand local distribution and service networks, which improves adoption. Rising funding for genomics, clinical diagnostics, and environmental testing continues to strengthen the regional market, while U.S. research institutions drive steady upgrades from manual to automated digestion platforms.
Europe
Europe accounted for nearly 29% share in 2024, supported by strong research infrastructure and well-established pharmaceutical manufacturing hubs. Countries such as Germany, the U.K., and France show high adoption due to strict quality standards and demand for reproducible analytical workflows. Investments in multi-omics programs and environmental testing also drive automated digestion uptake across public laboratories. The region benefits from active academic collaborations and strong regulatory alignment that promotes method validation and automation. Growing interest in robotics-enabled laboratories continues to expand usage, although budget constraints in smaller institutions moderate overall growth.
Asia-Pacific
Asia-Pacific captured approximately 25% share in 2024, driven by rapid expansion of biotech, pharmaceutical, and academic research facilities. China, Japan, South Korea, and India increasingly adopt automated digestion to support rising sample volumes in genomics, drug discovery, and food testing. Government funding for advanced research centers strengthens demand, while growing local manufacturing improves affordability. Many labs upgrade workflows to match global quality standards, which boosts reliance on automated systems. The region’s strong push toward digital laboratories and high-throughput testing continues to accelerate adoption, making Asia-Pacific one of the fastest-growing markets.
Latin America
Latin America held close to 5% share in 2024, with growth led by Brazil, Mexico, and Argentina. Regional labs increasingly adopt automated digestion to improve accuracy and reduce manual workload in pharmaceutical testing, food safety, and environmental monitoring. Expansion of clinical research programs also supports adoption across private and public institutions. However, limited budgets and slower modernization rates constrain growth compared to mature regions. Improved access to international brands and rising investment in laboratory automation help strengthen demand, while partnerships with universities and research centers support gradual integration of advanced digestion systems.
Middle East & Africa
The Middle East & Africa region accounted for roughly 4% share in 2024. Growth was supported by expanding healthcare and research infrastructure in the UAE, Saudi Arabia, and South Africa. Automated digestion systems gained traction as laboratories modernized workflows in clinical diagnostics, environmental testing, and petrochemical analysis. Government initiatives to strengthen biotechnology capabilities further encouraged adoption. Despite these gains, high system costs and limited technical expertise remain barriers in several countries. Ongoing investment in specialized research centers and the rise of quality-focused laboratory networks continue to support steady, long-term market expansion.
Market Segmentations:
By Product
- Automated Compound Storage System
- Automated Liquid Handling Systems
- Others
By Sample Type
- Biological Samples
- Compound Samples
- Others
By End-user
- Pharmaceutical and Biotech Companies
- Academic and Research Institutions
- Biobanks
- Others
By Geography
- North America
- Europe
- Germany
- France
- U.K.
- Italy
- Spain
- Rest of Europe
- Asia Pacific
- China
- Japan
- India
- South Korea
- South-east Asia
- Rest of Asia Pacific
- Latin America
- Brazil
- Argentina
- Rest of Latin America
- Middle East & Africa
- GCC Countries
- South Africa
- Rest of the Middle East and Africa
Competitive Landscape:
The Automated Sample Digestion Systems Market features strong competition led by companies focused on precision, throughput, and workflow automation. Key players such as Aurora, PerkinElmer, Milestone Srl, CEM Corporation, SEAL Analytical, Anton Paar, SCP SCIENCE, HORIBA, Berghof Products + Instruments, and Analytik Jena drive growth through advanced digestion platforms that improve accuracy and reduce manual handling. Many vendors expand portfolios with microwave-based, block-based, and fully integrated automated digestion systems to support diverse sample types. Firms also strengthen their position by offering software-driven control, improved safety features, and seamless compatibility with mass spectrometry workflows. Strategic moves such as product upgrades, regional expansion, and partnerships with analytical labs help companies increase global reach. Growing focus on reproducibility and regulated workflow support continues to push manufacturers toward developing scalable, high-throughput solutions that meet evolving laboratory demands.
Shape Your Report to Specific Countries or Regions & Enjoy 30% Off!
Key Player Analysis:
- Aurora
- PerkinElmer
- Milestone Srl
- CEM Corporation
- SEAL Analytical
- Anton Paar
- SCP SCIENCE
- HORIBA
- Berghof Products + Instruments
- Analytik Jena
Recent Developments:
- In August 2025, SCP SCIENCE (Analytichem) – SCP SCIENCE began rebranding under the AnalytiChem name, with digestion products such as DigiPREP hot-block systems and the SNRG Block digestion system now rolled out under a single global Analytikhem identity, supporting automated and high-throughput sample digestion workflows.
- In June 2025, Analytik Jena – Analytik Jena introduced the ICprep sample preparation solution for AOX, AOF, EOF, TF, TOF and halogen analysis; in its Automatic version, the system enables automated digestion and fraction collection for up to 100 samples in a single sequence, tailored for coupling with the multi EA 5X00 and multi X 2500 elemental analyzers.
- In March 2025, At Pittcon 2025, PerkinElmer launched the QSight 500 LC/MS/MS system and highlighted the Spotlight Aurora FTIR Microscope for material characterization. While these are not strictly digestion systems, the emphasis on high-throughput workflows and reduced sample‑preparation burden reflects the broader trend toward integrated & automated lab workflows.
Report Coverage:
The research report offers an in-depth analysis based on Product, Sample Type, End-User and Geography. It details leading market players, providing an overview of their business, product offerings, investments, revenue streams, and key applications. Additionally, the report includes insights into the competitive environment, SWOT analysis, current market trends, as well as the primary drivers and constraints. Furthermore, it discusses various factors that have driven market expansion in recent years. The report also explores market dynamics, regulatory scenarios, and technological advancements that are shaping the industry. It assesses the impact of external factors and global economic changes on market growth. Lastly, it provides strategic recommendations for new entrants and established companies to navigate the complexities of the market.
Future Outlook:
- Adoption will rise as laboratories shift toward fully automated and integrated sample preparation workflows.
- Demand will increase across genomics, proteomics, and multi-omics applications that require consistent digestion quality.
- Vendors will expand smart features such as real-time monitoring, automation scheduling, and predictive maintenance.
- Integration with robotics and digital lab platforms will strengthen end-to-end workflow automation.
- More pharmaceutical and biotech companies will standardize automated digestion within regulated testing environments.
- Academic and research institutions will accelerate upgrades to support large-scale studies and data-driven research.
- Growing focus on reproducibility will push manufacturers to develop more precise and contamination-free systems.
- Regional expansion in Asia-Pacific and the Middle East will support new growth opportunities.
- Cost-efficient and modular systems will gain traction among mid-sized laboratories.
- Sustainability trends will encourage adoption of energy-efficient and low-reagent digestion technologies.


