
Battery E-Commerce Market
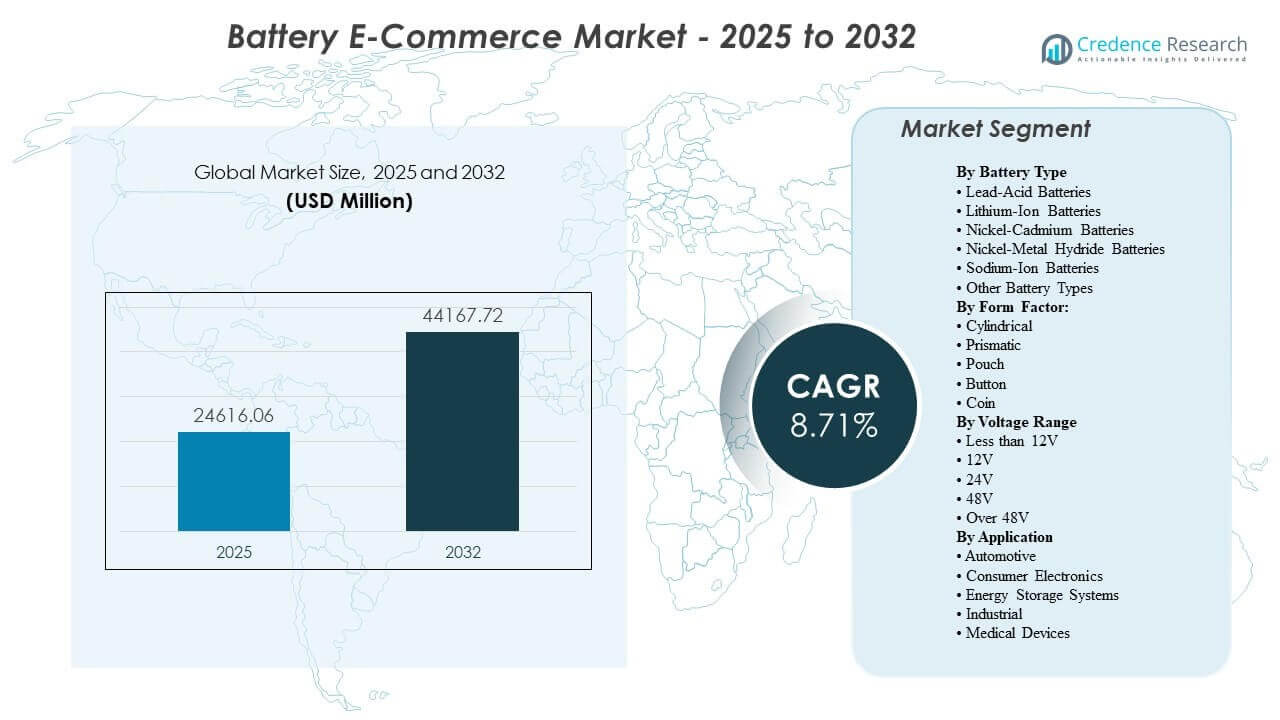
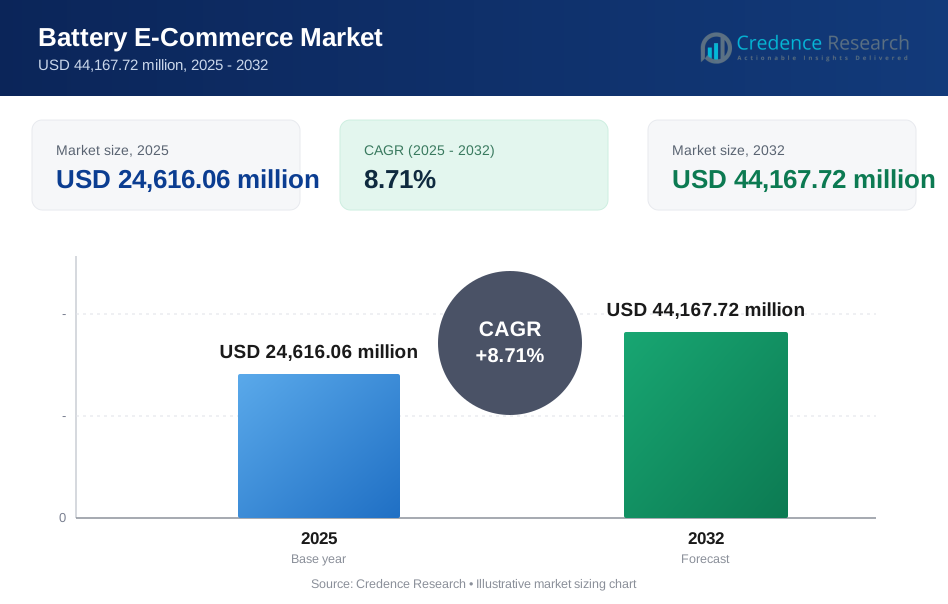
The global Battery E-Commerce Market size was estimated at USD 24,616.06 million in 2025 and is expected to reach USD 44,167.72 million by 2032, growing at a CAGR of 8.71% from 2025 to 2032. Market expansion is primarily driven by the acceleration of online purchasing for standardized replacement batteries and higher-value packs, supported by improved product discovery, compatibility filtering, and faster last-mile delivery for bulky goods. Demand is reinforced by rising electrification across mobility and distributed energy systems, alongside stronger digital penetration in B2C and B2B procurement for industrial and backup power use cases.
| REPORT ATTRIBUTE | DETAILS |
|---|---|
| Historical Period | 2020-2023 |
| Base Year | 2024 |
| Forecast Period | 2025-2032 |
| Battery E-Commerce Market Size 2025 | USD 24,616.06 Million |
| Battery E-Commerce Market, CAGR | 8.71% |
| Battery E-Commerce Market Size 2032 | USD 44,167.72 Million |
Key Market Trends & Insights
- The Battery E-Commerce Market is projected to expand from USD 24,616.06 million in 2025 to USD 44,167.72 million by 2032, reflecting an 8.71% CAGR during 2025–2032.
- Lithium-Ion Batteries accounted for the largest battery type share of 48.37% in 2025, reflecting strong online demand for high-energy-density chemistries across multiple end uses.
- Consumer Electronics represented 28.33% share in 2025 within application demand, supported by high SKU velocity and repeat purchasing behavior in online channels.
- North America held 44% share in 2025, indicating strong marketplace penetration, mature logistics capability, and high replacement-cycle purchases for automotive and backup systems.
- Europe represented 29% share in 2025, supported by broad electrification momentum and a structured ecosystem of online distributors and brand-direct channels for certified products.
Segment Analysis
Battery e-commerce demand is shaped by online-first buying behavior for both commodity replacements and specification-driven battery packs. Product pages, compatibility tools, and verified seller programs reduce mismatch risk, which supports conversion for higher-ticket categories such as mobility packs and modular storage units. Warranty clarity and reverse-logistics capability remain critical purchase factors because batteries are regulated, bulky, and performance-sensitive products.
The Battery E-Commerce Market also benefits from digital channel expansion in both consumer and professional procurement. Buyers increasingly compare voltage, capacity, chemistry, and certification attributes before purchase, which strengthens the role of structured listings and filtering. Growth is further supported by improved fulfillment models for heavy parcels and the availability of installation guidance, which increases buyer confidence and reduces post-purchase friction.
By Battery Type Insights
Lithium-Ion Batteries accounted for the largest share of 48.37% in 2025. Lithium-ion leads because it aligns with demand in mobility, portable electronics, and a growing range of distributed energy products where buyers evaluate capacity and safety specifications online. Standardized datasheets and broader availability across multiple sellers improve price transparency and shorten decision cycles. The segment also benefits from frequent new product introductions that expand choices across form factors and performance tiers.
By Form Factor Insights
Cylindrical, prismatic, and pouch formats collectively benefit from online specification-led purchasing where buyers filter by dimensions, capacity, and compatibility requirements. Cylindrical formats are widely purchased in applications that rely on standardized cells and modular assembly, supporting repeat orders and bundle purchases through e-commerce. Prismatic and pouch formats gain traction where energy density and packaging efficiency influence buying decisions, and where buyers use specialist listings to compare certifications and warranty terms. Button and coin cells remain strong online categories due to low shipping complexity and high repeat purchase frequency.
By Voltage Range Insights
The voltage range mix is influenced by compatibility-first purchasing behavior in e-commerce, where buyers typically start by selecting a required voltage before evaluating capacity and chemistry. Lower-voltage categories are supported by standardized replacement demand for small electronics and accessories, which are well suited to marketplace fulfillment. Mid-range categories are driven by equipment, backup power, and mobility configurations where buyers use online catalogs to match voltage and form factor constraints. Higher-voltage products tend to be more specification-intensive and are often sourced through brand-direct or specialist online distributors that provide compliance documentation and technical support.
By Application Insights
Consumer Electronics accounted for the largest share of 28.33% in 2025. The segment leads because online demand is reinforced by high transaction frequency for small-format batteries and accessories, supported by product reviews and repeat ordering behavior. E-commerce platforms also make it easier to compare capacity, size, and compatibility across many SKUs, improving discovery and purchase confidence. Faster fulfillment and simplified returns further strengthen consumer electronics purchases in digital channels.
Battery E-Commerce Market Drivers
Expansion of online marketplaces and brand-direct battery stores
Marketplace expansion and brand-direct commerce are increasing availability and price transparency for batteries across consumer and professional buyer groups. Product discovery tools, filters, and fitment-based search reduce mismatch risk and support higher conversion for complex SKUs. Retailers and manufacturers are improving content quality through standardized specifications, certifications, and performance claims. These factors collectively make online purchasing more reliable for both replacement and performance-oriented battery purchases. As trust signals improve (verified sellers, warranty clarity, and ratings), buyers are more willing to purchase higher-ticket packs and modules online.
- For instance, Exide’s Battery Finder supports battery identification through VIN, vehicle registration number, country code or license plate, part number, OE number, and EAN barcode scanning in the app, and the company says the tool generates around 2 million searches per year, underscoring how data-rich fitment systems can reduce mismatch risk in online battery purchases.
Rising replacement-cycle demand across mobility and backup power systems
Replacement cycles remain a durable demand driver because many battery categories are consumable components with predictable end-of-life behavior. Automotive, inverter, and backup power segments create recurring online demand when buyers reorder known specifications and formats. Digital channels reduce procurement time by enabling quick comparison and doorstep delivery of heavy products. This supports steady transaction volumes and helps e-commerce sellers optimize inventory around high-turn SKUs. Fitment tools and repeat-order features further accelerate re-purchase behavior in standardized replacement categories.
- For instance, Schneider Electric states that most APC UPS VRLA batteries have an expected service life of 3 to 5 years and recommends replacing them no later than year 5, which clearly supports recurring replacement demand in backup power applications.
Increased electrification across end uses and growing product variety
Electrification trends expand the addressable online catalog as more devices and systems rely on rechargeable battery packs and modules. Wider product variety encourages online shopping because customers compare energy density, charging features, and safety protections across multiple options. Sellers can differentiate through verified authenticity, compliant shipping, and warranty-backed products. This broadens the buyer base and supports higher average order values over time. As EV and storage ecosystems scale, more ancillary items (chargers, BMS accessories, cables) are also pulled into online baskets.
Improvements in logistics, packaging, and reverse fulfillment for bulky goods
Battery e-commerce growth depends on reliable delivery and safe handling for heavy and regulated products. Logistics improvements, better packaging standards, and faster last-mile networks reduce damage rates and delivery times. Returns and warranty processing are becoming more structured, increasing buyer confidence for higher-value packs. These operational upgrades help platforms scale battery categories while maintaining service quality. Specialized hazmat-compliant shipping workflows and better tracking are reducing friction for both sellers and end customers.
Battery E-Commerce Market Challenges
Battery e-commerce faces friction from shipping restrictions, safety compliance requirements, and packaging standards, which can increase costs and limit seller participation. Higher-weight products often have elevated freight costs and return complexity, reducing margin flexibility for sellers and potentially increasing total cost for buyers. Product authenticity risks and uneven seller quality can also weaken buyer confidence, particularly for high-capacity packs where performance and safety are critical. These constraints make compliance documentation and seller verification essential for category scaling.
- For instance, Amazon reported that in 2024 its AI-driven brand protection systems blocked more than 99% of suspected infringing listings before brands had to report them, while its Transparency program had verified more than 2.5 billion product units as genuine across 88,000 enrolled brands, showing how scaled digital verification can strengthen trust in high-risk categories.
The market also contends with compatibility errors and specification confusion, especially when listings lack standardized attributes or clear application guidance. Warranty disputes and reverse logistics can be challenging due to hazardous-material handling constraints and varying regional regulations. Price competition on marketplaces can pressure margins and incentivize aggressive discounting, which may reduce service levels if not managed through strong seller controls. These factors make trust-building and compliant fulfillment central to sustained growth. Improving catalog data quality and enforcing seller standards are key levers to reduce returns and protect customer experience.
Battery E-Commerce Market Trends and Opportunities
Product listings are becoming more specification-rich, with stronger emphasis on certifications, compatibility filters, and standardized attribute frameworks that improve purchase accuracy. Platforms and sellers increasingly bundle batteries with chargers, installation accessories, and service support, which supports higher basket sizes. Subscription-style replenishment and reminders for replacement intervals are also emerging opportunities in standardized categories where end-of-life timing is predictable. Data-driven personalization (fitment suggestions and usage-based reminders) is improving conversion and repeat purchases.
- For instance, Bosch’s CORE18V 8 Ah battery listing specifies compatibility with Bosch 18V tools and chargers, identifies its use of two layers of enhanced 21700 cells, lists a 2.14 lb product weight, and states 50% more runtime plus over 75% more power versus the CORE18V 4 Ah battery, showing how standardized technical attributes can make online battery selection more precise.
Growth opportunities are expanding in higher-value categories as buyers become more confident purchasing advanced packs online. Brand-direct channels can differentiate through authenticity assurance, extended warranties, and technical support for complex applications. Cross-border commerce can improve availability for niche form factors and performance tiers where local supply is limited. As logistics and compliance capabilities mature, digital channels can increasingly serve commercial procurement for industrial and energy storage applications. Over time, B2B e-commerce catalogs and service-network integrations can unlock larger recurring orders from fleet, telecom, and SME storage buyers.
Regional Insights
North America
North America accounted for 44% share in 2025. The region benefits from deep marketplace penetration, mature fulfillment networks, and strong buyer comfort with purchasing heavy items online. Replacement-cycle demand across automotive and backup power applications supports recurring transactions with standardized specifications. Strong seller ecosystems and warranty structures further improve buyer confidence for higher-value packs and modules.
Europe
Europe held 29% share in 2025. Demand is supported by broad electrification momentum and an established network of online distributors and brand-direct channels that emphasize certified products. Cross-border fragmentation can increase complexity, but structured product documentation and compliance practices support steady adoption. Buyers often prioritize verified specifications and warranty clarity, which increases the importance of quality listings and seller standards.
Asia Pacific
Asia Pacific represented 20% share in 2025. Rapid growth in digital commerce and a large installed base of battery-powered devices support expansion across consumer and commercial demand. High product variety encourages online shopping where buyers compare specifications and pricing across multiple sellers. Regional supply ecosystems also support broad SKU availability, reinforcing both marketplace and specialist online channels.
Latin America
Latin America accounted for 4% share in 2025. The market is supported by rising e-commerce penetration and growing aftermarket demand, particularly for replacement categories where buyers value convenience and price comparison. Logistics constraints and uneven delivery coverage can slow adoption for heavier products. Over time, improved fulfillment and stronger local seller networks can support higher online battery transaction volumes.
Middle East & Africa
Middle East & Africa held 3% share in 2025. Demand is supported by increasing online retail adoption and use cases linked to backup power and infrastructure reliability. The seller base is narrower for regulated battery products, which can limit assortment and elevate shipping costs. As compliance capabilities and distribution networks mature, e-commerce can expand in standardized replacement categories and selected commercial procurement lanes.
Competitive Landscape
Competition in the Battery E-Commerce Market is shaped by assortment breadth, listing quality, pricing transparency, and fulfillment capability for bulky and regulated products. Leading participants differentiate through verified sellers, strong warranty and returns handling, and compatibility tools that reduce mismatch rates. Brand-direct channels compete by emphasizing authenticity assurance, technical support, and extended warranty structures for higher-value packs. Marketplace platforms compete through demand aggregation, logistics scale, and merchandising that drives conversion across high-turn SKUs.
Amazon.com, Inc. plays a central role by enabling high product visibility, fast delivery options, and robust customer feedback mechanisms that influence purchase decisions. The platform’s scale supports demand aggregation across both commodity replacements and higher-value battery packs, while seller controls and branded storefronts help improve trust. Continuous enhancements in catalog structure and fulfillment programs support better conversion for specification-driven products. The company’s ecosystem also enables cross-category bundling that can lift basket sizes and repeat purchase behavior.
The industry research and growth report includes detailed analyses of the competitive landscape of the market and information about key companies, including:
- Amazon.com, Inc.
- BatteryMart.com / BatteryMart.co
- Panasonic Energy Co., Ltd.
- Tesla Power USA LLC
- Battery Junction.com
- Exide Industries Ltd.
- Luminous Power Technologies Pvt. Ltd.
- Okaya Power Pvt. Ltd.
- Clarios International Inc.
Qualitative and quantitative analysis of companies has been conducted to help clients understand the wider business environment as well as the strengths and weaknesses of key industry players. Data is qualitatively analyzed to categorize companies as pure play, category-focused, industry-focused, and diversified; it is quantitatively analyzed to categorize companies as dominant, leading, strong, tentative, and weak.
Recent Developments
- In May 2025, Energizer Holdings completed its acquisition of Advanced Power Solutions NV (APS), a manufacturer and marketer of batteries, portable lighting, and related products. Energizer said the deal expands its battery network in Europe and adds manufacturing optionality, which is relevant for companies serving digital and omnichannel battery demand.
- In September 2025, American Battery Technology Company and Call2Recycle launched a strategic partnership to expand lithium-ion battery recycling access for U.S. consumers. The companies said the partnership creates a direct-to-consumer recycling channel, extending ABTC’s business model beyond business-to-business operations.
- In October 2025, CATL signed a strategic cooperation agreement with JD.com covering the battery consumer market, logistics, warehousing, and distribution services. CATL said the two companies will also work together in the battery aftermarket through JD Auto Care’s nationwide service network, directly linking the partnership to battery retail and service channels.
- In November 2025, CATL, GAC, and JD.com unveiled the AION UT Super, a battery-swappable EV jointly developed by the three companies. CATL said the model combines its battery technology and swapping ecosystem with JD.com’s strengths in user insights, car sales, and car maintenance, showing how battery-related products and services are being integrated into e-commerce-led channels
Report Scope
| Report Attribute | Details |
| Market size value in 2025 | USD 24,616.06 million |
| Revenue forecast in 2032 | USD 44,167.72 million |
| Growth rate (CAGR) | 8.71% (2025–2032) |
| Base year | 2025 |
| Forecast period | 2025–2032 |
| Quantitative units | USD million |
| Segments covered | By Battery Type Outlook: Lead-Acid Batteries, Lithium-Ion Batteries, Nickel-Cadmium Batteries, Nickel-Metal Hydride Batteries, Sodium-Ion Batteries, Other Battery Types; By Form Factor Outlook: Cylindrical, Prismatic, Pouch, Button, Coin; By Voltage Range Outlook: Less than 12V, 12V, 24V, 48V, Over 48V; By Application Outlook: Automotive, Consumer Electronics, Energy Storage Systems, Industrial, Medical Devices |
| Regional scope | North America, Europe, Asia Pacific, Latin America, Middle East & Africa |
| Key companies profiled | Amazon.com, Inc.; BatteryMart.com / BatteryMart.co; Panasonic Energy Co., Ltd.; Tesla Power USA LLC; Battery Junction.com; Exide Industries Ltd.; Luminous Power Technologies Pvt. Ltd.; Okaya Power Pvt. Ltd.; Clarios International Inc. |
| No. of Pages | 330 |
Segmentation
By Battery Type
- Lead-Acid Batteries
- Lithium-Ion Batteries
- Nickel-Cadmium Batteries
- Nickel-Metal Hydride Batteries
- Sodium-Ion Batteries
- Other Battery Types
By Form Factor
- Cylindrical
- Prismatic
- Pouch
- Button
- Coin
By Voltage Range
- Less than 12V
- 12V
- 24V
- 48V
- Over 48V
By Application
- Automotive
- Consumer Electronics
- Energy Storage Systems
- Industrial
- Medical Devices
By Region
- North America
- U.S.
- Canada
- Mexico
- Europe
- Germany
- France
- U.K.
- Italy
- Spain
- Rest of Europe
- Asia Pacific
- China
- Japan
- India
- South Korea
- South-east Asia
- Rest of Asia Pacific
- Latin America
- Brazil
- Argentina
- Rest of Latin America
- Middle East & Africa
- GCC Countries
- South Africa
- Rest of the Middle East and Africa
Request a Free Sample
Fill in your details and we'll send you a free sample report.
- Sample data tables & charts
- Research methodology
Need a Custom Version of This Report?
Tailor the scope, geography, or segments to your exact requirements.
- Custom geography or segment scope
- Direct access to our analyst team
Frequently Asked Questions
What is the market size of the Battery E-Commerce Market in 2025 and what is the forecast for 2032?
What is the CAGR for the Battery E-Commerce Market during 2025–2032?
Which battery type segment leads the Battery E-Commerce Market in 2025?
Which application segment leads the Battery E-Commerce Market in 2025?
Which region leads the Battery E-Commerce Market in 2025?
Who are the key players in the Battery E-Commerce Market?
Table of Content
Chapter 1. Report Introduction
- 1.1 Report Description & Purpose
- 1.1.1 Report Title & Market Definition
- 1.1.2 Unique Selling Propositions (USP) & Key Differentiators
- 1.1.3 Value Proposition for Stakeholders
- 1.2 Research Objectives
- 1.2.1 Market Sizing Objectives (Volume & Revenue)
- 1.2.2 Segmentation Objectives
- 1.2.3 Competitive Intelligence Objectives
- 1.2.4 Forecast & Scenario Objectives
- 1.3 Report Scope
- 1.3.1 Battery E-Commerce Scope – Types & Subtypes Covered
- 1.3.2 Geographic Scope – Regions & Countries Covered
- 1.3.3 Historical Period, Base Year & Forecast Period (2025; forecast to 2032)
- 1.3.4 Inclusions & Exclusions
- 1.4 HS Code & Classification Framework
- 1.5 Currency, Units & Pricing Basis
- 1.6 Target Stakeholders
- 1.7 Limitations & Assumptions
Chapter 2. Executive Summary
- 2.1 Global Battery E-Commerce Market Snapshot
- 2.1.1 Market Size – Historical (2025) & Forecast (2025-2032) (2025: USD 24,616.06 million → 2032: USD 44,167.72 million)
- 2.1.2 Volume & Revenue – Global Totals
- 2.1.3 Key Market Highlights – Top Five Facts
- 2.2 Battery E-Commerce Market Segmentation Snapshot
- 2.2.1 Market Split by Region – 2025 vs. 2032
- 2.3 Competitive Snapshot
- 2.3.1 Top 10 Players by Revenue Share – 2025
- 2.3.2 Top 10 Players by Volume Share – 2025
- 2.3.3 Recent Strategic Developments (18-Month Summary)
- 2.4 Key Investment Highlights & Strategic Conclusions
Chapter 3. Battery E-Commerce Market Dynamics & Industry Analysis
- 3.1 Market Overview & Context
- 3.1.1 Battery E-Commerce Market Position in the Broader Automotive Value Chain
- 3.1.2 OEM vs. Replacement Market Dynamics
- 3.1.3 Market Maturity & Development Stage by Region
- 3.2 Battery E-Commerce Market Drivers
- 3.3 Battery E-Commerce Market Restraints & Challenges
- 3.4 Battery E-Commerce Market Opportunities
- 3.5 Porter's Five Forces Analysis
- 3.5.1 Threat of New Entrants
- 3.5.2 Bargaining Power of Suppliers
- 3.5.3 Bargaining Power of Buyers
- 3.5.4 Threat of Substitutes
- 3.5.5 Competitive Rivalry – Intensity Assessment
- 3.6 Battery E-Commerce Value Chain Analysis
- 3.6.1 Upstream – Raw Material/Input Suppliers
- 3.6.1.1 Raw Material/Input 1
- 3.6.1.2 Raw Material/Input 2
- 3.6.1.3 Raw Material/Input 3
- 3.6.2 Midstream – Production/Manufacturing/Service Delivery
- 3.6.2.1 Production/Process Overview
- 3.6.2.2 Key Facility Locations & Capacity by Manufacturer
- 3.6.3 Downstream – Distribution & End Consumer
- 3.6.3.1 Primary Channel – B2B/OEM
- 3.6.3.2 Secondary Channels – Dealer, Retail, Online, Direct
- 3.6.4 Value Chain Profitability Analysis
- 3.6.1 Upstream – Raw Material/Input Suppliers
- 3.7 PESTEL Analysis
- 3.7.1 Political Factors
- 3.7.2 Economic Factors
- 3.7.3 Social Factors
- 3.7.4 Technological Factors
- 3.7.5 Environmental Factors
- 3.7.6 Legal Factors
- 3.8 Battery E-Commerce Supply Chain Analysis
- 3.8.1 Raw Material/Input Supply Risk Assessment
- 3.8.2 Manufacturing Concentration Risk (Geographic Exposure)
- 3.8.3 Trade Disruption Impact Analysis
- 3.9 Regulatory & Policy Landscape
Note: The regulatory and policy landscape section covers regulations based on their applicability to the market, Battery E-Commerce category, geography, and scope of the study. Only regulatory frameworks with a material impact on operations, compliance, trade, sustainability, or market access are analyzed in detail.
Chapter 4. Key Investment Pockets & Opportunity Analysis
- 4.1 Battery E-Commerce Market Attractiveness Analysis
- 4.1.1 By Region – Investment Attractiveness Matrix (Volume × CAGR)
- 4.2 Absolute Revenue Growth Opportunity
- 4.2.1 By Region – Absolute USD Growth Through 2032
- 4.3 Incremental Volume Opportunity
- 4.3.1 By Region – Incremental Volume Through 2032
- 4.3.2 Segment – Incremental Volume
- 4.4 Emerging Submarket Opportunity Deep Dive (Subject to Applicability)
- 4.5 Emerging Market Opportunity Scorecards
- 4.5.1 United States
- 4.5.2 Europe
- 4.5.3 Asia
- 4.5.4 Middle East & Africa
Note: Emerging Market Opportunity Scorecards will be included based on relevance and strategic importance. Regions listed are indicative and may vary depending on data availability and market dynamics.
Chapter 5. Battery E-Commerce Import-Export Analysis & Trade Flows
- 5.1 Global Trade Overview
- 5.1.1 Global Export Value by Country (2025)
- 5.1.2 Global Export Volume by Country (2025)
- 5.1.3 Global Import Value by Country (2025)
- 5.1.4 Global Import Volume by Country (2025)
- 5.1.5 Net Trade Balance by Country (2025)
- 5.2 Export Analysis – Segment
- 5.2.1 Type 1 (HS Code)
- 5.2.2 Type 2 (HS Code)
- 5.2.3 Type 3 (HS Code)
- 5.2.4 Type 4 (HS Code)
- 5.2.5 Type 5 (HS Code)
- 5.3 Import Analysis – Segment
- 5.3.1 Type 1 (HS Code)
- 5.3.2 Type 2 (HS Code)
- 5.3.3 Type 3 (HS Code)
- 5.3.4 Type 4 (HS Code)
- 5.3.5 Type 5 (HS Code)
- 5.4 Average Unit Trade Prices
- 5.4.1 Average Export Price – Segment & Country
- 5.4.2 Average Import Price – Segment & Source Country
- 5.4.3 Price Trends (2025)
- 5.5 Key Trade Route Analysis
- 5.5.1 Trade Route 1
- 5.5.2 Trade Route 2
- 5.5.3 Trade Route 3
- 5.5.4 Trade Route 4
- 5.5.5 Trade Route 5
- 5.6 Trade Policy Impact Assessment
- 5.6.1 US Anti-Dumping & Section 301 Tariffs
- 5.6.2 EU Customs Union Impact
- 5.6.3 Major Free Trade Agreements
- 5.6.4 USMCA Rules of Origin
Note: Trade policy analysis will be included only where relevant to the Battery E-Commerce market.
Chapter 6. Competitive Landscape & Company Benchmarking
- 6.1 Battery E-Commerce Market Concentration & Structure
- 6.1.1 Herfindahl-Hirschman Index (HHI) – vs. 2025
- 6.1.2 Tier 1, Tier 2 & Tier 3 Market Structure
- 6.1.3 Global, Regional & Local Player Dynamics
- 6.2 Battery E-Commerce Market Share Analysis – 2025
- 6.2.1 Global Revenue Share by Company
- 6.2.2 Global Volume Share by Company
- 6.2.3 Regional Revenue Share
- 6.2.4 Market Share Evolution ( vs. 2025)
- 6.2.5 OEM Segment Share by Company
- 6.2.6 Replacement Segment Share by Company
- 6.3 Production/Delivery Capacity & Facility Analysis
- 6.3.1 Global Installed Capacity
- 6.3.2 Capacity Utilization Rates
- 6.3.3 Production/Output Volume
- 6.3.4 Facility Locations & Capacity Map
- 6.3.5 Planned Capacity Additions
- 6.4 Battery E-Commerce Competitive Benchmarking Matrix
- 6.4.1 Revenue, Volume, CAGR & Profitability Comparison
- 6.4.2 Channel Revenue Mix
- 6.4.3 Geographic Revenue Exposure
- 6.4.4 R&D Intensity
- 6.4.5 Sustainability Maturity
- 6.5 Strategic Developments in Battery E-Commerce (Last 24 Months)
- 6.5.1 Mergers, Acquisitions & Divestments
- 6.5.2 New Battery E-Commerce Launches
- 6.5.3 Facility Expansions
- 6.5.4 Strategic Alliances, Joint Ventures & Partnerships
- 6.5.5 Distribution Expansion & Market Entry
- 6.5.6 Sustainability & ESG Initiatives
- 6.6 Competitive Strategy Mapping
- 6.6.1 Leader, Challenger, Follower & Niche Classification
- 6.6.2 Pricing Strategy Comparison
- 6.6.3 Channel Strategy Matrix
Note: Strategic developments are included based on their materiality and the availability of reliable information.
Chapter 7. Global Battery E-Commerce Market – By Distribution Channel
- 7.1 Segment Overview
- 7.1.1 Volume & Revenue Split by Channel (2025 & 2032)
- 7.1.2 Channel Mix Evolution (2025-2032)
Chapter 8. Regional Market Analysis – Global Overview
- 8.1 Global Regional Overview
- 8.1.1 Regional Volume Share
- 8.1.2 Regional Revenue Share
- 8.1.3 Regional Volume by Region
- 8.1.4 Regional Revenue by Region
- 8.1.5 Regional Forecast Through 2032
- 8.2 Cross-Regional Segment Analysis
- 8.2.1 By Distribution Channel
- 8.2.2 By Brand/Price Tier
Chapter 9. North America Battery E-Commerce Market
- 9.1 United States
- 9.2 Canada
- 9.3 Mexico
Chapter 10. Europe Battery E-Commerce Market
- 10.1 Germany
- 10.2 France
- 10.3 Italy
- 10.4 United Kingdom
- 10.5 Spain
- 10.6 Poland
- 10.7 Russia
- 10.8 Netherlands
- 10.9 Belgium
- 10.10 Sweden
- 10.11 Denmark
- 10.12 Norway
- 10.13 Rest of Europe
Chapter 11. Asia Pacific Battery E-Commerce Market
- 11.1 China
- 11.2 India
- 11.3 Japan
- 11.4 South Korea
- 11.5 Thailand
- 11.6 Indonesia
- 11.7 Vietnam
- 11.8 Malaysia
- 11.9 Australia
- 11.10 Rest of Asia Pacific
Chapter 12. Latin America Battery E-Commerce Market
- 12.1 Brazil
- 12.2 Argentina
- 12.3 Colombia
- 12.4 Chile
- 12.5 Rest of Latin America
Chapter 13. Middle East Battery E-Commerce Market
- 13.1 Saudi Arabia
- 13.2 United Arab Emirates
- 13.3 Turkey
- 13.4 Israel
- 13.5 Iran
- 13.6 Rest of the Middle East
Chapter 14. Africa Battery E-Commerce Market
- 14.1 South Africa
- 14.2 Egypt
- 14.3 Nigeria
- 14.4 Morocco
- 14.5 Rest of Africa
Chapter 15. Battery E-Commerce Company Profiles
- 15.1 [Company 01]
- 15.1.1 Company Overview
- 15.1.2 Key Management Personnel
- 15.1.3 Products & Services Portfolio
- 15.1.4 Financial Performance
- 15.1.5 Key Market Focus & Geographic Presence
- 15.1.6 Recent Developments & Strategic Initiatives
Note: The company profile list is preliminary and may change based on research findings, market developments, data availability, and client requirements.
Chapter 16. Appendices
- Appendix A – List of Abbreviations & Acronyms
- Appendix B – Industry Classification Code Reference – Full Series
- Appendix C – Production & Capacity Data Tables
- Appendix D – End-Use & Demand Base Tables
- Appendix E – Consumption & Replacement Rate Assumptions
- Appendix F – ASP Reference Tables
- Appendix G – Manufacturing & Facility Database
- Appendix H – Import-Export Data Tables
- Appendix I – Regulatory Summary Tables
- Appendix J – Primary Research Participant List (Anonymized)
- Appendix K – Primary Research Questionnaire Framework
- Appendix L – Data Sources & Bibliography
- Appendix M – Market Size Divergence & Source Comparison
Chapter 17. Research Methodology
- 17.1 Research Framework & Philosophy
- 17.2 Secondary Research – Sources, Hierarchy & Data Extraction
- 17.3 Data Modeling – Bottom-Up & Top-Down Market Sizing
- 17.4 Primary Research – Stakeholder Framework, LOI & Sample Sizes
- 17.5 Forecast Methodology – Regression, Scenario & Sensitivity Analysis
- 17.6 Quality Control – Four-Layer Validation Framework
- 17.7 Limitations & Standard Assumptions
- 17.8 Disclaimer
