
Market Overview
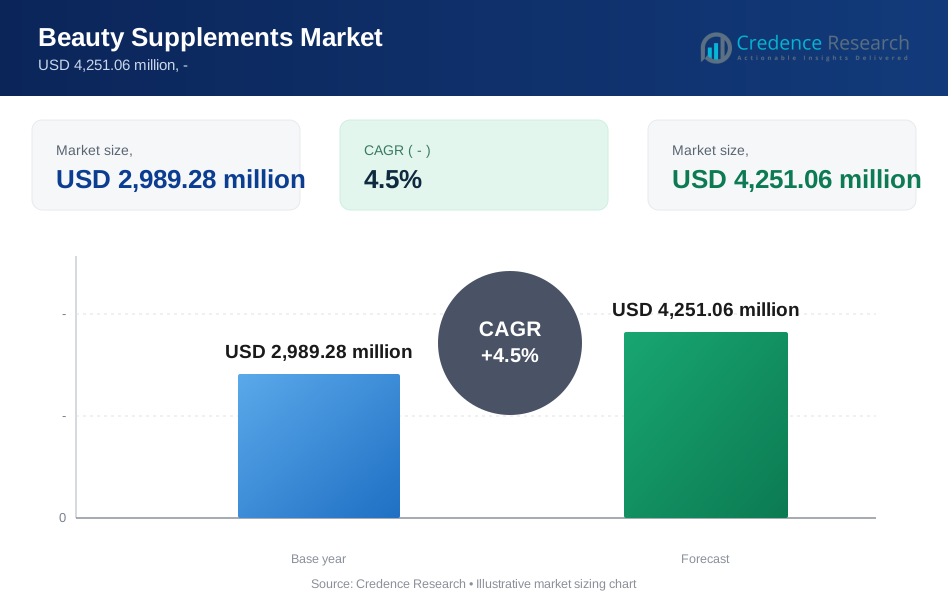
Beauty Supplements market size was valued USD 2,989.28 million in 2024 and is anticipated to reach USD 4,251.06 million by 2032, at a CAGR of 4.5% during the forecast period.
| REPORT ATTRIBUTE | DETAILS |
|---|---|
| Historical Period | 2020-2023 |
| Base Year | 2024 |
| Forecast Period | 2025-2032 |
| Beauty Supplements market Size 2024 | USD 2,989.28 million |
| Beauty Supplements market, CAGR | 4.5% |
| Beauty Supplements market Size 2032 | USD 4,251.06 million |
The beauty supplements market includes oral products meant to support skin, hair and nail health through vitamins, minerals, collagen, antioxidants and other nutrients. Its growth stems from rising consumer interest in natural beauty, aging population, stress on appearance and quick access to health knowledge.
Social media and influencer trends boost demand. Wellness‑oriented lifestyles and willingness to invest in preventive self‑care help drive market expansion. The Asia‑Pacific region leads the market, holding around 40% of global revenue, driven by strong demand in China, Japan and South Korea where beauty and wellness traditions combine with modern innovation.
North America comes next, supported by high consumer spending and broad retail presence. Europe also grows steadily, bolstered by clean‑beauty trends. Market players focus on product innovation, clean‑label claims and personalization to stay competitive. Age‑targeted supplements, collagen blends, plant‑based ingredients and convenient formats such as gummies and powders gain popularity. Distribution through e‑commerce, health stores and direct‑to‑consumer channels expands reach. Consumers now seek evidence‑based formulations with transparency about sourcing and efficacy, pushing brands to invest in clinical validation and clear labeling.
Market Insights
- Asia Pacific holds the largest regional share at 40%, led by strong demand in China, Japan, and South Korea.
- Vitamins are the top product segment with a 37% share due to their popularity and daily usability.
- Beauty applications dominate the market with a 60% share, driven by skin, hair, and anti-aging needs.
- Online sales channels lead distribution with 45% share, supported by influencer marketing and subscriptions.
- The 31-50 age group captures nearly 39% of the market, focusing on aging and hormonal support.
Market Segment
By Product
Based on Product, the market is categorized into Vitamins, Mineral, Enzymes, Botanicals, Proteins, Omega-3, Probiotics, Others. Vitamins held the largest share about 37% of revenue in 2024 thanks to their foundational role, affordability, and familiarity. Botanicals, while smaller, are the fastest-growing segment, driven by rising demand for natural, plant-based formulations with perceived wellness and clean-beauty appeal.
- For instance, Bayer AG reported that its One A Day vitamin line surpassed 2.8 billion tablets sold globally in 2023, showing continued consumer trust in multivitamin formats.
Based on Application, the market is categorized into Beauty and Women’s Health. Beauty leads globally due to strong consumer focus on skin, hair, and overall appearance. Products marketed for glow, anti-aging, and radiance outperform those solely for health benefits. Growth stems from influencer visibility and visible outcomes, fueling purchasing behavior in beauty-oriented users.
- For instance, Amway reported sales of over 450 million Nutrilite beauty-focused supplements in 2023, highlighting strong consumer preference for skin and hair wellness.
Based on Age Group, the market is categorized into Age 15–30, Age 31–50, Age 51–70, Above 70 years. The 31–50 age group dominates with nearly 39–39.4% revenue share in 2023–2024. Women in this range face life stage changes pregnancy, early menopause, aging so they seek supplements for skin aging, hormonal balance, energy, and bone strength, driving demand in tailored blends.
By Consumer GroupBased on Consumer Group, the market is categorized into Prenatal, Postnatal, PMS, Perimenopause, Postmenopause, Others. The “general women’s health” or “others” category led with around a 30% share in 2024. This broad segment includes supplements aimed at overall wellness rather than niche life-stage concerns. Drivers include preventive health focus, micronutrient gaps, stress support, and broad aging-related wellbeing needs across multiple life phases.
By Sales ChannelBased on Sales Channel, the market is categorized into Online, Direct Sales, Pharmacies/Drug Stores, Other offline channels. Online dominates with approximately 45% of sales, owing to convenience, wider product choice, subscription models, influencer outreach, discrete access, and global reach. Digital channels also support education, reviews, personalization, and seamless repeat purchases, which align with consumer preferences for hassle-free beauty and wellness.
Market Drivers
Rising Focus on Preventive Health and Aging
Consumers are prioritizing long-term wellness and aging concerns, driving steady demand for beauty supplements. Collagen, antioxidants, and vitamins aimed at preventing wrinkles, dull skin, and hair loss are top sellers. The shift from reactive to proactive skincare fuels daily supplement intake. Women in their 30s and 40s especially seek products that support visible beauty from within, as part of a broader self-care routine centered on aging control and maintenance.
- For instance, NeoCell’s collagen supplements reached distribution in more than 47 countries, with over 25 million bottles sold annually.
Growth of Social Media and Influencer Marketing
Social platforms push beauty supplement trends, especially among younger buyers. Influencers share personal results using collagen, hair gummies, and skin glow pills, building product trust. Hashtag-driven campaigns and user-generated testimonials shape buying behavior. Short video formats and creator partnerships also boost product visibility, making online promotion a key sales driver. Consumers rely on peer reviews and viral content to decide on daily supplement choices.
- For instance, SugarBearHair, popularized through Instagram influencers and celebrity endorsements, sold more than 2.3 million bottles of hair vitamins by 2022.
Clean Label and Natural Ingredient Demand
Consumers are moving toward products with plant-based, non-GMO, and additive-free labels. Botanical supplements, marine collagen, and naturally sourced vitamins are gaining attention. The demand for transparency and clean sourcing pushes brands to disclose origins and ingredient benefits. Shoppers now favor products with shorter ingredient lists and scientific claims, especially those avoiding synthetic fillers, artificial colors, and allergens. This preference is strongest in premium and specialty online channels.
E-commerce and Subscription-Based Growth
Online sales channels simplify access to a wide range of beauty supplements, including niche or premium products. Auto-ship options, product reviews, and loyalty rewards support repeat purchases. Subscription models are expanding due to convenience and cost benefits. Direct-to-consumer brands use personalized quizzes and AI-driven tools to offer targeted recommendations. This channel's convenience, privacy, and customization features continue to grow its influence in overall category growth.
Key Trends & Opportunities
Demand for Personalized Beauty Supplements
Consumers want supplements tailored to their skin type, age, and lifestyle. Brands now offer quiz-based or AI-driven tools to suggest personalized formulas. DNA-based kits and microbiome analysis are gaining traction in premium segments. This trend supports higher price points and stronger consumer loyalty. Customization also reduces product waste, helping consumers stick to consistent routines with visible results. Growth is strongest in digital-native brands targeting millennials and Gen Z.
Growing Popularity of Collagen and Hyaluronic Acid
Collagen supplements remain top-selling beauty products, especially in powders, drinks, and capsules. Hyaluronic acid is rising fast, favored for skin hydration and elasticity support. These ingredients are linked with anti-aging results, making them popular among consumers over 30. Marine collagen leads due to cleaner sourcing and higher bioavailability. Product innovation in flavors, solubility, and blends with vitamins C and E helps brands stand out in a saturated category.
- For instance, Atolla uses AI and monthly data‑driven formula tweaks, sending a 25‑milliliter serum monthly that lasts about 30 days when used twice daily.
Shift Toward Vegan and Plant-Based Alternatives
More consumers are avoiding animal-derived ingredients like bovine or marine collagen. This opens space for vegan collagen boosters made from algae, silica, and amino acids. Plant-based protein, biotin-rich herbs, and adaptogens are becoming key features. These options appeal to ethical and health-conscious buyers. Growth is fastest in North America and Europe, where plant-based lifestyles are more common. Brands that meet both efficacy and ethical standards are gaining repeat users.
- For instance, Geltor developed PrimaColl™, a bioidentical vegan collagen produced through microbial fermentation, capable of generating 2,000 liters per batch with consistent purity standards.
Expansion of Men’s Beauty Supplement Segment
While women dominate the category, male interest is growing in skin, hair, and aging concerns. Supplements for hair thickening, skin clarity, and energy support are being marketed to men aged 25–45. Brands now use gender-neutral packaging and targeted campaigns to appeal to this audience. Men prefer simple, outcome-based formulas with fewer daily doses. This segment shows strong growth potential as awareness and acceptance of male grooming increases globally.
Key Challenges
Lack of Global Regulatory Standardization
Beauty supplements face inconsistent regulations across regions, complicating product approval and labeling. In the US, supplements are loosely regulated, while Europe enforces strict guidelines. This gap causes delays in international launches and raises compliance costs. Brands must navigate varied rules on health claims, dosage limits, and ingredient safety. These regulatory differences limit scalability and often require reformulation or repackaging for different markets, creating operational inefficiencies for global expansion strategies.
- For instance, Amway reported spending over 75,000 hours annually on global regulatory compliance to meet country-specific supplement rules.
Quality Control and Ingredient Transparency Issues
Ensuring consistent product quality is a key challenge. Sourcing bioavailable, clean, and traceable ingredients can be difficult due to supply chain limitations. Adulteration or mislabeling risks undermine consumer trust. Lab testing, certification, and supplier audits increase costs and complexity. Without clear standards, some brands cut corners, damaging the reputation of the broader market. Transparency in labeling and verified claims is now essential, especially as consumers demand proof of efficacy and purity.
Restrictions on Health and Beauty Claims
Many countries limit how brands can promote beauty supplements. Claims like “anti-aging,” “glowing skin,” or “hair regrowth” often require clinical backing or are banned. Regulators closely monitor advertising, leading to legal risks and pulled products. These restrictions force cautious wording, reducing marketing impact. Smaller companies may struggle to fund clinical trials or gather enough evidence to support strong claims, limiting their ability to compete in crowded markets.
Regional Analysis
Asia Pacific
Asia Pacific holds the largest market share around 40% in 2025 driven by rising disposable incomes, strong beauty traditions in countries like China, Japan, and South Korea, and growing health awareness among consumers. Rapid e-commerce expansion and digital health services are making supplements widely accessible, while natural and plant-based formulations align with regional cultural preferences and clean-beauty trends.
North America
North America commands the second-largest share, estimated at about 35% in 2024. The market benefits from high consumer spending, robust health and wellness culture, strong R&D capabilities, and effective multi-channel distribution. Demand is fueled by personalized, science-backed products that focus on skin vitality, hormonal balance, and preventive beauty, supported by digital engagement and e-commerce.
Europe
Europe holds the third position, with a significant share driven by growing preference for natural, clean-label supplements and an aging population seeking preventive care. The region benefits from stringent regulatory standards that enhance product quality and consumer confidence. Digital health adoption and e-commerce also support steady expansion in beauty-from-within products targeting immunity, skin health, and hormonal balance.
Market Segmentations:
Beauty Supplements Market- By Product
- Vitamins
- Mineral
- Enzymes
- Botanicals
- Proteins
- Omega-3
- Probiotics
- Others
Beauty Supplements Market- By Application
- Beauty
- Women’s Health
Beauty Supplements Market- By Age Group
- Age 15 – 30
- Age 31 – 50
- Age 51 – 70
- Above 70 years
Beauty Supplements Market- By Consumer Group
- Prenatal
- Postnatal
- PMS
- Perimenopause
- Postmenopause
- Others
Beauty Supplements Market- By Sales Channel
- Online
- Direct Sales
- Pharmacies/Drug Stores
- Other offline channels
By Region
- North America
- Europe
- Asia-Pacific
- Latin America
- Middle East & Africa
Competitive Landscape
The beauty supplements market is competitive, with a mix of global brands, specialty wellness companies, and emerging startups. Key players include Amway, Herbalife, Nestlé Health Science, HUM Nutrition, and Nutrafol, each offering targeted products for skin, hair, and overall appearance. These companies invest in R&D, clinical studies, and influencer partnerships to build trust and visibility. Innovation in delivery formats like gummies, powders, and ready-to-drink shots helps brands stand out. Clean-label claims, personalized formulas, and plant-based options are gaining traction. Digital-first brands use direct-to-consumer models and subscription services to drive growth. As demand rises, mergers and product line expansions are increasing. Competitive pressure is highest in collagen, biotin, and anti-aging categories, where product overlap is common and consumer expectations are rising.
Key Players
- Amway
- Herbalife International of America Inc.
- The Nature’s Bounty Co.
- Bayer AG; GNC Holdings Inc.
- Garden of Life (Nestle)
- Taisho Pharmaceutical Co. Ltd
- Swisse Wellness Pty. Ltd.
- Pfizer Inc.
- Fancl Corporation
- Suntory Holdings Limited
- Pharmavite LLC
- Asahi Group Holdings
- Usana Health Sciences
- Blackmores
- Nu Skin Enterprises
- Standard Foods Corporation
- By Health Co. Ltd
- Revital Ltd.
- The Himalaya Drug Company
- Vita Life Sciences
- Grape King Bio Ltd.
Recent Developments
- In 2025, the beauty supplements industry saw a significant shift from traditional pills and capsules toward new delivery formats that emphasize convenience and efficacy. Dissolvable vitamin strips gained attention, with companies such as Diso launching 14 plant-based, sugar-free strips designed to dissolve instantly.
- Marine collagen gummies also rose in popularity, led by products like Pilly Labs Collagen Gummies. These formulations combined marine collagen with vitamin C, biotin, and zinc, offering higher bioavailability than bovine or porcine sources. The move toward marine-based ingredients addressed sustainability concerns while supporting better absorption due to smaller molecular weight.
- In China, regulatory changes reshaped the sector. From May 1, 2025, companies were required to submit complete safety assessment dossiers, while five new testing methods for cosmetic registration came into effect on July 1, 2025.
- The United States advanced MoCRA implementation, mandating enhanced facility registration and safety substantiation for all cosmetic products beginning March 2025.
Report Coverage
The research report offers an in-depth analysis based on Product, Application, Age Group, Consumer Group, Sales Channel and Geography. It details leading market players, providing an overview of their business, product offerings, investments, revenue streams, and key applications. Additionally, the report includes insights into the competitive environment, SWOT analysis, current market trends, as well as the primary drivers and constraints. Furthermore, it discusses various factors that have driven market expansion in recent years. The report also explores market dynamics, regulatory scenarios, and technological advancements that are shaping the industry. It assesses the impact of external factors and global economic changes on market growth. Lastly, it provides strategic recommendations for new entrants and established companies to navigate the complexities of the market.
Future Outlook
- Demand for personalized beauty supplements will increase, driven by DNA-based and lifestyle-specific formulations.
- Plant-based and vegan alternatives will gain share as consumers shift toward ethical and clean-label choices.
- Subscription-based models will grow, offering convenience and stronger brand loyalty.
- Male-targeted beauty supplements will expand, especially for hair and skin health.
- Collagen and hyaluronic acid products will remain central to anti-aging supplement demand.
- Clinical validation and transparent labeling will become essential for consumer trust and regulatory approval.
- E-commerce platforms will dominate sales, with influencer-driven marketing shaping product visibility.
- Innovation in delivery formats like liquid shots and gummies will attract younger buyers.
- Brands will expand into emerging markets with rising disposable incomes and beauty awareness.
- Regulatory harmonization may improve global scalability and reduce launch delays across regions.
Request a Free Sample
Fill in your details and we'll send you a free sample report.
- Sample data tables & charts
- Research methodology
Need a Custom Version of This Report?
Tailor the scope, geography, or segments to your exact requirements.
- Custom geography or segment scope
- Direct access to our analyst team
Frequently Asked Questions
Which is the leading market for Beauty Supplements?
What are the key drivers for the growth of the Beauty Supplements Market?
Which is the major segment in Beauty Supplements Market by Product?
Which is the major segment in Beauty Supplements Market by Application?
How COVID-19 Impacted the global Beauty Supplements Market?
What is the market size of Beauty Supplements?
Table of Content
Chapter 1. Report Introduction
- 1.1 Report Description & Purpose
- 1.1.1 Report Title & Market Definition
- 1.1.2 Unique Selling Propositions (USP) & Key Differentiators
- 1.1.3 Value Proposition for Stakeholders
- 1.2 Research Objectives
- 1.2.1 Market Sizing Objectives (Volume & Revenue)
- 1.2.2 Segmentation Objectives
- 1.2.3 Competitive Intelligence Objectives
- 1.2.4 Forecast & Scenario Objectives
- 1.3 Report Scope
- 1.3.1 Beauty Supplements Scope – Types & Subtypes Covered
- 1.3.2 Geographic Scope – Regions & Countries Covered
- 1.3.3 Historical Period, Base Year & Forecast Period (the historical period; forecast to the forecast period)
- 1.3.4 Inclusions & Exclusions
- 1.4 HS Code & Classification Framework
- 1.5 Currency, Units & Pricing Basis
- 1.6 Target Stakeholders
- 1.7 Limitations & Assumptions
Chapter 2. Executive Summary
- 2.1 Global Beauty Supplements Market Snapshot
- 2.1.1 Market Size – Historical (the historical period) & Forecast (the forecast period) (base year: USD 2,989.28 million → forecast year: USD 4,251.06 million)
- 2.1.2 Volume & Revenue – Global Totals
- 2.1.3 Key Market Highlights – Top Five Facts
- 2.2 Beauty Supplements Market Segmentation Snapshot
- 2.2.1 Market Split by Region – vs.
- 2.3 Competitive Snapshot
- 2.3.1 Top 10 Players by Revenue Share –
- 2.3.2 Top 10 Players by Volume Share –
- 2.3.3 Recent Strategic Developments (18-Month Summary)
- 2.4 Key Investment Highlights & Strategic Conclusions
Chapter 3. Beauty Supplements Market Dynamics & Industry Analysis
- 3.1 Market Overview & Context
- 3.1.1 Beauty Supplements Market Position in the Broader Automotive Value Chain
- 3.1.2 OEM vs. Replacement Market Dynamics
- 3.1.3 Market Maturity & Development Stage by Region
- 3.2 Beauty Supplements Market Drivers
- 3.3 Beauty Supplements Market Restraints & Challenges
- 3.4 Beauty Supplements Market Opportunities
- 3.5 Porter's Five Forces Analysis
- 3.5.1 Threat of New Entrants
- 3.5.2 Bargaining Power of Suppliers
- 3.5.3 Bargaining Power of Buyers
- 3.5.4 Threat of Substitutes
- 3.5.5 Competitive Rivalry – Intensity Assessment
- 3.6 Beauty Supplements Value Chain Analysis
- 3.6.1 Upstream – Raw Material/Input Suppliers
- 3.6.1.1 Raw Material/Input 1
- 3.6.1.2 Raw Material/Input 2
- 3.6.1.3 Raw Material/Input 3
- 3.6.2 Midstream – Production/Manufacturing/Service Delivery
- 3.6.2.1 Production/Process Overview
- 3.6.2.2 Key Facility Locations & Capacity by Manufacturer
- 3.6.3 Downstream – Distribution & End Consumer
- 3.6.3.1 Primary Channel – B2B/OEM
- 3.6.3.2 Secondary Channels – Dealer, Retail, Online, Direct
- 3.6.4 Value Chain Profitability Analysis
- 3.6.1 Upstream – Raw Material/Input Suppliers
- 3.7 PESTEL Analysis
- 3.7.1 Political Factors
- 3.7.2 Economic Factors
- 3.7.3 Social Factors
- 3.7.4 Technological Factors
- 3.7.5 Environmental Factors
- 3.7.6 Legal Factors
- 3.8 Beauty Supplements Supply Chain Analysis
- 3.8.1 Raw Material/Input Supply Risk Assessment
- 3.8.2 Manufacturing Concentration Risk (Geographic Exposure)
- 3.8.3 Trade Disruption Impact Analysis
- 3.9 Regulatory & Policy Landscape
Note: The regulatory and policy landscape section covers regulations based on their applicability to the market, Beauty Supplements category, geography, and scope of the study. Only regulatory frameworks with a material impact on operations, compliance, trade, sustainability, or market access are analyzed in detail.
Chapter 4. Key Investment Pockets & Opportunity Analysis
- 4.1 Beauty Supplements Market Attractiveness Analysis
- 4.1.1 By Region – Investment Attractiveness Matrix (Volume × CAGR)
- 4.2 Absolute Revenue Growth Opportunity
- 4.2.1 By Region – Absolute USD Growth Through the forecast period
- 4.3 Incremental Volume Opportunity
- 4.3.1 By Region – Incremental Volume Through the forecast period
- 4.3.2 Segment – Incremental Volume
- 4.4 Emerging Submarket Opportunity Deep Dive (Subject to Applicability)
- 4.5 Emerging Market Opportunity Scorecards
- 4.5.1 United States
- 4.5.2 Europe
- 4.5.3 Asia
- 4.5.4 Middle East & Africa
Note: Emerging Market Opportunity Scorecards will be included based on relevance and strategic importance. Regions listed are indicative and may vary depending on data availability and market dynamics.
Chapter 5. Beauty Supplements Import-Export Analysis & Trade Flows
- 5.1 Global Trade Overview
- 5.1.1 Global Export Value by Country (the historical period)
- 5.1.2 Global Export Volume by Country (the historical period)
- 5.1.3 Global Import Value by Country (the historical period)
- 5.1.4 Global Import Volume by Country (the historical period)
- 5.1.5 Net Trade Balance by Country (the historical period)
- 5.2 Export Analysis – Segment
- 5.2.1 Type 1 (HS Code)
- 5.2.2 Type 2 (HS Code)
- 5.2.3 Type 3 (HS Code)
- 5.2.4 Type 4 (HS Code)
- 5.2.5 Type 5 (HS Code)
- 5.3 Import Analysis – Segment
- 5.3.1 Type 1 (HS Code)
- 5.3.2 Type 2 (HS Code)
- 5.3.3 Type 3 (HS Code)
- 5.3.4 Type 4 (HS Code)
- 5.3.5 Type 5 (HS Code)
- 5.4 Average Unit Trade Prices
- 5.4.1 Average Export Price – Segment & Country
- 5.4.2 Average Import Price – Segment & Source Country
- 5.4.3 Price Trends (the historical period)
- 5.5 Key Trade Route Analysis
- 5.5.1 Trade Route 1
- 5.5.2 Trade Route 2
- 5.5.3 Trade Route 3
- 5.5.4 Trade Route 4
- 5.5.5 Trade Route 5
- 5.6 Trade Policy Impact Assessment
- 5.6.1 US Anti-Dumping & Section 301 Tariffs
- 5.6.2 EU Customs Union Impact
- 5.6.3 Major Free Trade Agreements
- 5.6.4 USMCA Rules of Origin
Note: Trade policy analysis will be included only where relevant to the Beauty Supplements market.
Chapter 6. Competitive Landscape & Company Benchmarking
- 6.1 Beauty Supplements Market Concentration & Structure
- 6.1.1 Herfindahl-Hirschman Index (HHI) – vs.
- 6.1.2 Tier 1, Tier 2 & Tier 3 Market Structure
- 6.1.3 Global, Regional & Local Player Dynamics
- 6.2 Beauty Supplements Market Share Analysis –
- 6.2.1 Global Revenue Share by Company
- 6.2.2 Global Volume Share by Company
- 6.2.3 Regional Revenue Share
- 6.2.4 Market Share Evolution ( vs. )
- 6.2.5 OEM Segment Share by Company
- 6.2.6 Replacement Segment Share by Company
- 6.3 Production/Delivery Capacity & Facility Analysis
- 6.3.1 Global Installed Capacity
- 6.3.2 Capacity Utilization Rates
- 6.3.3 Production/Output Volume
- 6.3.4 Facility Locations & Capacity Map
- 6.3.5 Planned Capacity Additions
- 6.4 Beauty Supplements Competitive Benchmarking Matrix
- 6.4.1 Revenue, Volume, CAGR & Profitability Comparison
- 6.4.2 Channel Revenue Mix
- 6.4.3 Geographic Revenue Exposure
- 6.4.4 R&D Intensity
- 6.4.5 Sustainability Maturity
- 6.5 Strategic Developments in Beauty Supplements (Last 24 Months)
- 6.5.1 Mergers, Acquisitions & Divestments
- 6.5.2 New Beauty Supplements Launches
- 6.5.3 Facility Expansions
- 6.5.4 Strategic Alliances, Joint Ventures & Partnerships
- 6.5.5 Distribution Expansion & Market Entry
- 6.5.6 Sustainability & ESG Initiatives
- 6.6 Competitive Strategy Mapping
- 6.6.1 Leader, Challenger, Follower & Niche Classification
- 6.6.2 Pricing Strategy Comparison
- 6.6.3 Channel Strategy Matrix
Note: Strategic developments are included based on their materiality and the availability of reliable information.
Chapter 7. Global Beauty Supplements Market – By Distribution Channel
- 7.1 Segment Overview
- 7.1.1 Volume & Revenue Split by Channel ( & )
- 7.1.2 Channel Mix Evolution (the forecast period)
Chapter 8. Regional Market Analysis – Global Overview
- 8.1 Global Regional Overview
- 8.1.1 Regional Volume Share
- 8.1.2 Regional Revenue Share
- 8.1.3 Regional Volume by Region
- 8.1.4 Regional Revenue by Region
- 8.1.5 Regional Forecast Through the forecast period
- 8.2 Cross-Regional Segment Analysis
- 8.2.1 By Distribution Channel
- 8.2.2 By Brand/Price Tier
Chapter 9. North America Beauty Supplements Market
- 9.1 United States
- 9.2 Canada
- 9.3 Mexico
Chapter 10. Europe Beauty Supplements Market
- 10.1 Germany
- 10.2 France
- 10.3 Italy
- 10.4 United Kingdom
- 10.5 Spain
- 10.6 Poland
- 10.7 Russia
- 10.8 Netherlands
- 10.9 Belgium
- 10.10 Sweden
- 10.11 Denmark
- 10.12 Norway
- 10.13 Rest of Europe
Chapter 11. Asia Pacific Beauty Supplements Market
- 11.1 China
- 11.2 India
- 11.3 Japan
- 11.4 South Korea
- 11.5 Thailand
- 11.6 Indonesia
- 11.7 Vietnam
- 11.8 Malaysia
- 11.9 Australia
- 11.10 Rest of Asia Pacific
Chapter 12. Latin America Beauty Supplements Market
- 12.1 Brazil
- 12.2 Argentina
- 12.3 Colombia
- 12.4 Chile
- 12.5 Rest of Latin America
Chapter 13. Middle East Beauty Supplements Market
- 13.1 Saudi Arabia
- 13.2 United Arab Emirates
- 13.3 Turkey
- 13.4 Israel
- 13.5 Iran
- 13.6 Rest of the Middle East
Chapter 14. Africa Beauty Supplements Market
- 14.1 South Africa
- 14.2 Egypt
- 14.3 Nigeria
- 14.4 Morocco
- 14.5 Rest of Africa
Chapter 15. Beauty Supplements Company Profiles
- 15.1 [Company 01]
- 15.1.1 Company Overview
- 15.1.2 Key Management Personnel
- 15.1.3 Products & Services Portfolio
- 15.1.4 Financial Performance
- 15.1.5 Key Market Focus & Geographic Presence
- 15.1.6 Recent Developments & Strategic Initiatives
Note: The company profile list is preliminary and may change based on research findings, market developments, data availability, and client requirements.
Chapter 16. Appendices
- Appendix A – List of Abbreviations & Acronyms
- Appendix B – Industry Classification Code Reference – Full Series
- Appendix C – Production & Capacity Data Tables
- Appendix D – End-Use & Demand Base Tables
- Appendix E – Consumption & Replacement Rate Assumptions
- Appendix F – ASP Reference Tables
- Appendix G – Manufacturing & Facility Database
- Appendix H – Import-Export Data Tables
- Appendix I – Regulatory Summary Tables
- Appendix J – Primary Research Participant List (Anonymized)
- Appendix K – Primary Research Questionnaire Framework
- Appendix L – Data Sources & Bibliography
- Appendix M – Market Size Divergence & Source Comparison
Chapter 17. Research Methodology
- 17.1 Research Framework & Philosophy
- 17.2 Secondary Research – Sources, Hierarchy & Data Extraction
- 17.3 Data Modeling – Bottom-Up & Top-Down Market Sizing
- 17.4 Primary Research – Stakeholder Framework, LOI & Sample Sizes
- 17.5 Forecast Methodology – Regression, Scenario & Sensitivity Analysis
- 17.6 Quality Control – Four-Layer Validation Framework
- 17.7 Limitations & Standard Assumptions
- 17.8 Disclaimer
