Biogas Plant Market Overview:
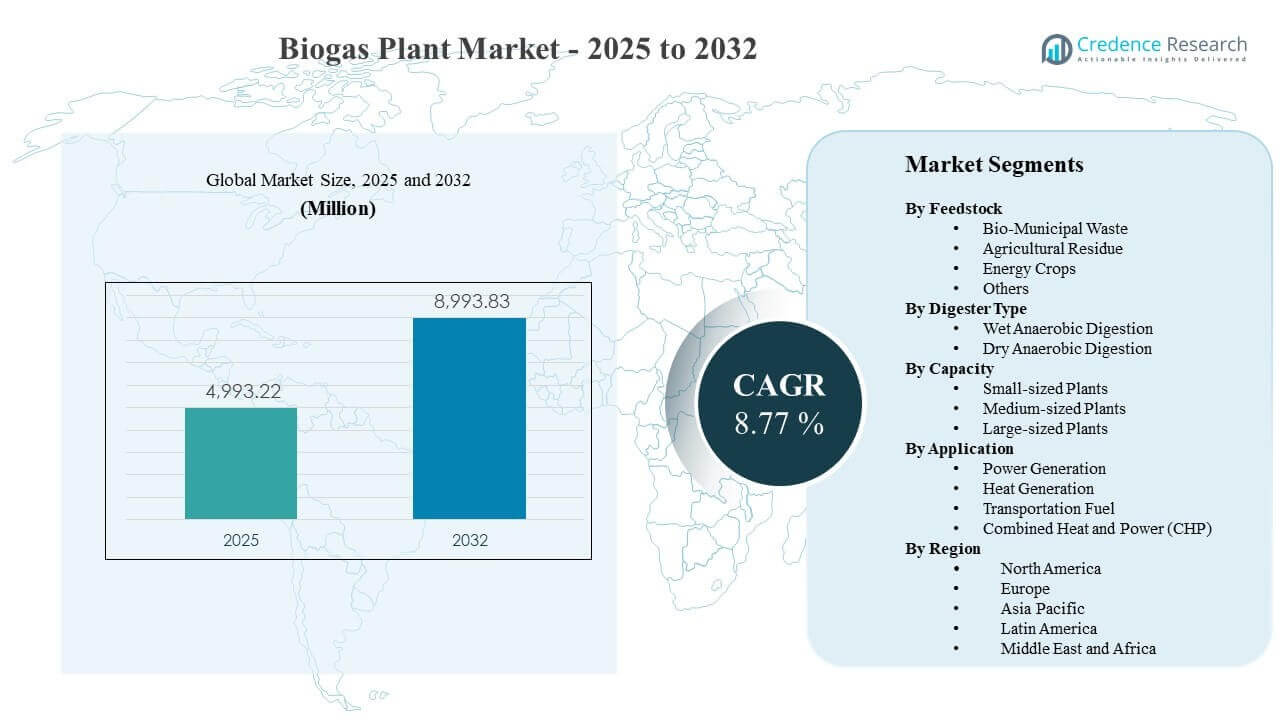
The global Biogas Plant Market size was estimated at USD 4993.22 million in 2025 and is expected to reach USD 8993.83 million by 2032, growing at a CAGR of 8.77% from 2025 to 2032. Investment momentum is being reinforced by rising pressure to divert organic waste from landfills and improve methane management, pushing municipalities, utilities, and agribusiness operators toward scalable anaerobic digestion solutions. Demand is also supported by expanding biomethane and renewable gas use cases where gas upgrading, grid injection, and long-term offtake contracts improve bankability across new and retrofit projects.
| REPORT ATTRIBUTE |
DETAILS |
| Historical Period |
2020-2024 |
| Base Year |
2025 |
| Forecast Period |
2026-2032 |
| Biogas Plant Market Size 2025 |
USD 4993.22 million |
| Biogas Plant Market, CAGR |
8.77% |
| Biogas Plant Market Size 2032 |
USD 8993.83 million |
Key Market Trends & Insights
- The market is projected to expand at a CAGR of 8.77% during 2025–2032, supported by increased deployment across waste-to-energy and renewable gas pathways.
- Europe accounted for 50.8% share in 2025, reflecting mature deployment, supportive incentives, and established project development ecosystems.
- Asia Pacific held 24.1% share in 2025, underpinned by growing municipal waste processing capacity and rising investment in decentralized energy infrastructure.
- Wet anaerobic digestion represented the largest digestion share at 51.4% in 2025, supported by stable operating performance across high-moisture feedstocks.
- Power generation led application demand with 47.6% share in 2025, driven by dispatchable output value and established interconnection models.
Segment Analysis
Segment performance is strongly shaped by feedstock availability, conversion stability, and the monetization route selected by project developers. Agricultural and municipal waste streams continue to attract investment because they support continuous plant loading and align with landfill diversion goals. At the same time, project evaluation increasingly considers digestate handling, odor control, and compliance requirements, which influence technology selection and plant sizing decisions across regions.
Commercial adoption is also being influenced by the shift from single-output models to multi-output optimization. Developers are improving yields and uptime through co-digestion strategies, better pre-treatment, and more precise process control. Where offtake is robust, plant configurations are increasingly designed to improve total value capture through combined electricity, heat utilization, and fuel-grade upgrading routes that reduce revenue volatility.
Access crucial information at unmatched prices!
Request your sample report today & start making informed decisions powered by Credence Research Inc.!
Download Sample
By Feedstock Insights
Agricultural Residue accounted for the largest share of 33.8% in 2025. Its leadership is supported by steady availability across farming and livestock supply chains, which improves feedstock security and reduces seasonal disruption risk. Residue-based systems also align with circular nutrient management because digestate can be recycled back to land, improving acceptance and long-term operating economics. In addition, agricultural residue integrates well with co-digestion strategies that stabilize gas yields and improve plant utilization.
By Digester Type Insights
Wet Anaerobic Digestion accounted for the largest share of 51.4% in 2025. It remains widely preferred due to mature operating practices, proven process stability, and repeatable engineering designs that reduce execution risk. Wet systems are well-suited to high-moisture inputs such as food waste and sewage sludge, supporting consistent digestion performance at scale. Strong process control also improves predictability of gas output, supporting projects designed for grid-connected power or upgrading pathways.
By Capacity Insights
Medium-sized Plants continue to represent a practical balance between capex efficiency and feedstock logistics for many developers. These plants typically match the collection radius available from clustered waste sources while limiting transportation and handling complexity. Small plants are favored for decentralized deployment where community energy access and localized waste management are the priority. Large plants are generally linked to aggregated feedstock supply, industrial offtake arrangements, and more advanced permitting and grid or pipeline interconnection readiness.
By Application Insights
Power Generation accounted for the largest share of 47.6% in 2025. It benefits from established pathways for revenue realization through dispatchable electricity output, especially where grid reliability and baseload support remain valuable. CHP configurations strengthen project economics when there is stable local heat demand, raising total efficiency and improving returns. Transportation fuel applications expand where upgrading and injection infrastructure is available and where renewable fuel credits or long-term offtake contracts support premium pricing.
Biogas Plant Market Drivers
Rising pressure for organic waste diversion and methane abatement
Regulatory tightening and municipal performance targets are pushing cities and industries to divert organics from landfills and cut methane leakage. Biogas plants address both goals by stabilizing waste streams and converting them into usable energy products. This strengthens project appeal for municipal solid waste, wastewater sludge, and commercial food waste programs. As collection, segregation, and contracting improve, developers gain higher confidence in reliable feedstock volumes and consistent plant utilization overall.
- For instance, Waga Energy’s Claye-Souilly WAGABOX unit processes biogas from a landfill handling about 1.1 million tonnes of waste per year and produces 120 GWh of biomethane annually, enough to supply around 20,000 households while avoiding 25,000 tonnes of CO2-equivalent emissions per year.
Expansion of renewable gas and biomethane value chains
Renewable gas pathways are improving biogas project bankability for lenders and investors by adding revenue streams beyond electricity sales. Upgrading equipment enables biomethane production for grid injection, industrial boilers, or transport fleets, expanding the addressable market. Long-term offtake contracts and credit-linked demand can reduce price volatility compared with merchant power exposure. As pipeline access, gas quality standards, and certification frameworks mature, more plants are designed around fuel-grade outputs and flexibility.
Improved process control and plant optimization practices
Advances in pre-treatment, sensors, and automated controls are lifting plant uptime and stabilizing gas yields across variable inputs. Better digester management reduces foaming, inhibition, and unplanned shutdown risk, supporting consistent performance even under mixed-feedstock operations. Operators increasingly use co-digestion, blending, and recipe optimization to maximize methane output and throughput. These improvements enhance lifecycle economics, shorten payback periods, and encourage wider replication of standardized plant configurations across regions and applications reliably.
- For instance, ABB notes that even biogas plants with capacities of 500 kW or less can lose several thousand euros per day during downtime, and its Freelance automation platform is designed to automatically generate diagnostic views and calculate gas-yield potential to support faster operating decisions.
Circular economy benefits from digestate utilization
Digestate handling has become a critical adoption lever, especially for agriculture-linked projects where land application is feasible. Nutrient recovery and soil improvement benefits support acceptance among farmers and local communities while lowering disposal costs. Where regulations permit, digestate can substitute for synthetic fertilizers, creating value streams and improving economics. This circular-economy narrative helps biogas plants stand out versus single-purpose waste treatment options by combining energy recovery with resource recycling locally.
Biogas Plant Market Challenges
Project economics remain highly sensitive to feedstock logistics, permitting duration, and grid or pipeline interconnection readiness. Collection radius, contamination levels, and seasonal variability can disrupt supply, reduce yields, and raise operating costs. Regulatory approvals for odor control, emissions, and digestate management may extend timelines and increase development expense. These barriers are most pronounced where waste segregation is weak and supporting infrastructure for transport, storage, and offtake remains underdeveloped at scale.
Operational complexity is a further constraint, particularly for facilities processing mixed municipal and commercial waste streams. Variability in composition can destabilize digestion and increase the need for pre-treatment, monitoring, and skilled oversight. Operator capability and maintenance discipline strongly influence uptime and methane yield, creating wide performance differences across installations. Financing can also tighten when projects lack long-term offtake contracts, face uncertain incentives, or present higher counterparty and permitting risk materially.
- For instance, the Rialto Bioenergy Solutions Facility in California is designed to process up to 1,000 tons per day of combined food waste extracted from municipal waste streams, liquid waste, and municipal biosolids, and to produce up to 1 million MMBtu of RNG per year.
Biogas Plant Market Trends and Opportunities
A key trend is the move toward multi-revenue designs that combine power, heat use, and biomethane upgrading to improve resilience across market cycles. Developers increasingly build plants that can switch output routing as pricing and offtake conditions change. CHP remains attractive where industrial parks, district heating, or onsite thermal demand supports high utilization. This shift increases demand for modular engineering, scalable upgrading packages, and advanced controls that optimize efficiency today.
- For instance, WELTEC BIOPOWER’s biomethane plant for Evergreen Agricultural Enterprises in Ireland combines an onsite CHP unit generating around 1 megawatt of power with membrane-based upgrading that will produce about 1,300 standard cubic metres of biomethane per hour, while the facility is designed to process 165,000 tonnes of residues annually and deliver 65,000 tonnes of digestate per year, illustrating how one project can monetize electricity, heat, grid-injected biomethane, and by-products through an integrated design.
Another opportunity is strengthening municipal and industrial partnerships to secure long-term feedstock access and stable offtake. Integrated contracts covering collection, digestion, and energy sales improve predictability and reduce counterparty risk. Industrial decarbonization goals are also creating demand for renewable gas and low-carbon process heat. As buyers emphasize verified emissions reductions, projects with stronger measurement, reporting, and certification practices can win premiums and improve competitiveness in tenders and negotiations globally.
Regional Insights
North America
North America accounted for 14.6% share in 2025, supported by continued development of landfill-linked projects and growing interest in renewable gas outputs. The region benefits from established project development capabilities and expanding offtake structures for fuel-grade products. Municipal and commercial waste programs also support steady feedstock availability in select corridors. Adoption is strongest where permitting and interconnection pathways are clearer and offtake contracts reduce revenue uncertainty.
Europe
Europe held 50.8% share in 2025, reflecting mature anaerobic digestion deployment and well-established waste management and agricultural integration. Project pipelines are supported by structured policy frameworks and strong execution ecosystems spanning EPC, upgrading, and O&M providers. Existing installations also contribute to demand through upgrades, efficiency improvements, and retrofits for higher-value outputs. Regional leadership is reinforced by clearer standards for gas upgrading and digestate handling in many markets.
Asia Pacific
Asia Pacific captured 24.1% share in 2025, driven by scaling waste processing capacity and expanding decentralized energy initiatives. Municipal waste growth and rapid urbanization increase the need for diversion and treatment solutions, supporting new project development. Industrial and agricultural residues provide additional feedstock potential, with increasing interest in localized energy self-sufficiency. Momentum is strongest in markets improving waste segregation, project finance availability, and infrastructure readiness.
Latin America
Latin America represented 6.4% share in 2025, supported by growing interest in waste-to-energy and residue-to-energy projects linked to agriculture and landfills. Project development remains uneven, with deployment concentrated in locations where permitting and grid or gas infrastructure supports consistent operations. Financing depth and long-term offtake certainty continue to shape market pace. Still, the region offers attractive feedstock potential where waste collection systems are improving.
Middle East & Africa
Middle East and Africa accounted for 4.1% share in 2025, reflecting early-stage adoption across many markets. Growth is supported by rising attention to municipal waste challenges and the need for local energy resilience. Deployment remains constrained by fragmented waste systems, project finance complexity, and limited upgrading or injection infrastructure in certain areas. Projects tend to progress fastest where public-private models strengthen feedstock assurance and operational continuity.
Competitive Landscape
Competition is shaped by technology and EPC providers offering standardized digester platforms, modular upgrading packages, and long-term O&M services to reduce execution risk. Market positioning increasingly depends on the ability to deliver reliable yields, support permitting and compliance workflows, and optimize total value capture across power, heat, and fuel-grade outputs. Differentiation is also linked to lifecycle support, remote monitoring, and integration with feedstock logistics and digestate handling solutions. Partnerships with energy buyers and municipal stakeholders are becoming more central as developers prioritize stable offtake and contracted feedstock pipelines.
EnviTec Biogas AG is positioned around repeatable plant engineering and upgrading pathways that support higher-value end products. Its portfolio approach emphasizes reliable plant performance, modular delivery, and operational support aligned with long-term uptime targets. The company’s focus on upgrading strengthens its relevance where grid injection and renewable gas contracts are expanding. This positioning also supports retrofit demand as operators seek higher monetization routes from existing digestion assets.
The industry research and growth report includes detailed analyses of the competitive landscape of the market and information about key companies, including:
- EnviTec Biogas AG
- WELTEC BIOPOWER GmbH
- PlanET Biogas Group GmbH
- BTS Biogas Srl
- Air Liquide SA
- Ameresco, Inc.
- Gasum Oy
- Future Biogas Ltd.
- IES BIOGAS Srl
- ENGIE SA
Qualitative and quantitative analysis of companies has been conducted to help clients understand the wider business environment as well as the strengths and weaknesses of key industry players. Data is qualitatively analyzed to categorize companies as pure play, category-focused, industry-focused, and diversified; it is quantitatively analyzed to categorize companies as dominant, leading, strong, tentative, and weak.
Shape Your Report to Specific Countries or Regions & Enjoy 30% Off!
Recent Developments
- In March 2026, PlanET Biogas India, part of PlanET Biogas Group GmbH, partnered with Delta Bio Gas to develop a 12 TPD compressed biogas facility in Andhra Pradesh, supporting India’s SATAT initiative and expanding PlanET’s presence in the CBG segment.
- In May 2025, WELTEC BIOPOWER GmbH entered a strategic collaboration with EAG (Empresarios Agrupados–GHESA) to offer turnkey EPC projects in Spain, combining their expertise to deliver renewable energy and environmental solutions more efficiently.
- In May 2025, Gasum Oy acquired 100% of NSR Biogas AB and the remaining one-third of Liquidgas Biofuels Genesis AB, giving it full ownership of the Helsingborg biogas plant and adjacent upgrading operation in Sweden.
- In May 2024, BTS Biogas Srl highlighted its partnership with A2A around a letter of intent to define a joint venture for building new plants and reconverting existing infrastructure fed by animal and plant waste.
Report Scope
| Report Attribute |
Details |
| Market size value in 2025 |
USD 4993.22 million |
| Revenue forecast in 2032 |
USD 8993.83 million |
| Growth rate (CAGR) |
8.77% (2025–2032) |
| Base year |
2025 |
| Forecast period |
2026-2032 |
| Quantitative units |
USD million |
| Segments covered |
By Feedstock; By Digester Type; By Capacity; By Application |
| Regional scope |
North America, Europe, Asia Pacific, Latin America, Middle East & Africa |
| Key companies profiled |
EnviTec Biogas AG; WELTEC BIOPOWER GmbH; PlanET Biogas Group GmbH; BTS Biogas Srl; Air Liquide SA; Ameresco, Inc.; Gasum Oy; Future Biogas Ltd.; IES BIOGAS Srl; ENGIE SA |
| No.of Pages |
330 |
Segmentation
By Feedstock
- Bio-Municipal Waste
- Agricultural Residue
- Energy Crops
- Others
By Digester Type
- Wet Anaerobic Digestion
- Dry Anaerobic Digestion
By Capacity
- Small-sized Plants
- Medium-sized Plants
- Large-sized Plants
By Application
- Power Generation
- Heat Generation
- Transportation Fuel
- Combined Heat and Power (CHP)
By Region
- North America
- Europe
- Germany
- France
- U.K.
- Italy
- Spain
- Rest of Europe
- Asia Pacific
- China
- Japan
- India
- South Korea
- South-east Asia
- Rest of Asia Pacific
- Latin America
- Brazil
- Argentina
- Rest of Latin America
- Middle East & Africa
- GCC Countries
- South Africa
- Rest of the Middle East and Africa


