
Bioimpedance Analyzers Market
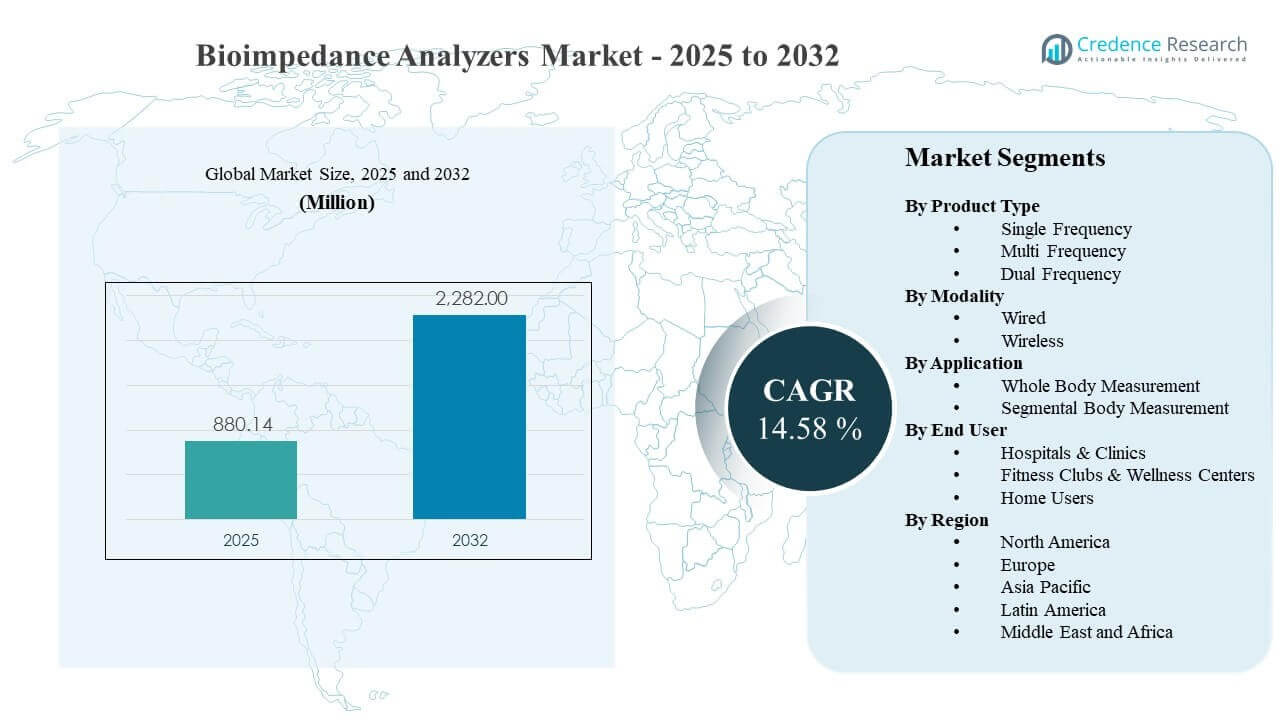
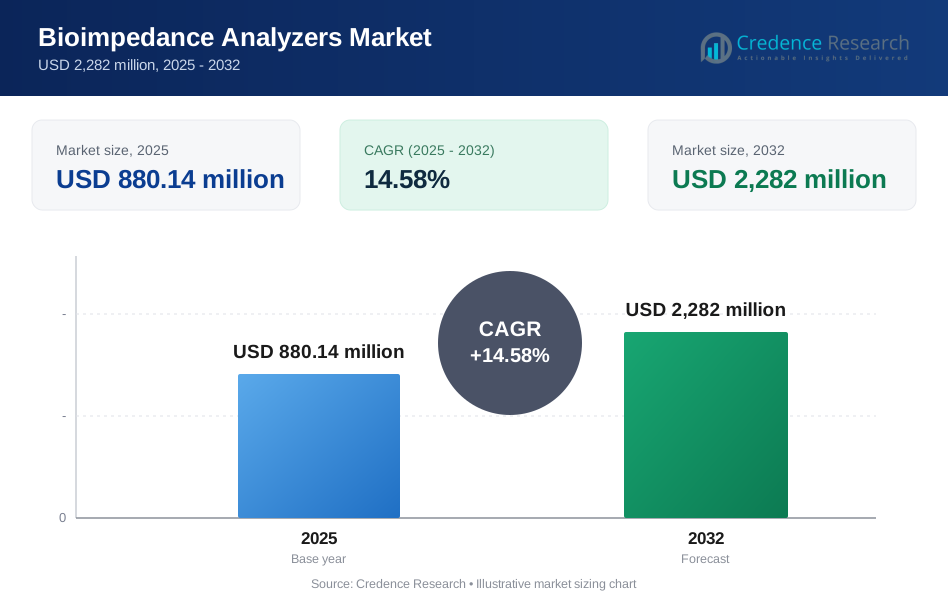
The global Bioimpedance Analyzers Market size was estimated at USD 880.14 million in 2025 and is expected to reach USD 2,282 million by 2032, growing at a CAGR of 14.58% from 2025 to 2032. Growth is primarily driven by rising clinical and wellness demand for fast, non-invasive body composition assessment that supports nutrition management, metabolic risk screening, and hydration monitoring. Bioimpedance Analyzers Market expansion is also supported by broader adoption across outpatient settings and fitness ecosystems, where routine tracking and longitudinal reporting increase device utilization and replacement cycles.
| REPORT ATTRIBUTE | DETAILS |
|---|---|
| Historical Period | 2020-2024 |
| Base Year | 2025 |
| Forecast Period | 2026-2032 |
| Bioimpedance Analyzers Market Size 2025 | USD 880.14 million |
| Bioimpedance Analyzers Market, CAGR | 14.58% |
| Bioimpedance Analyzers Market Size 2032 | USD 2,282 million |
Key Market Trends & Insights
- The Bioimpedance Analyzers Market is projected to expand from USD 880.14 million (2025) to USD 2,282 million (2032), reflecting a 14.58% CAGR (2025–2032).
- North America accounted for 37.20% of Bioimpedance Analyzers Market revenue in 2025, supported by higher utilization across hospitals and wellness networks.
- Multi Frequency systems represented the leading product category with a 51.4% share in 2025, reflecting preference for richer impedance profiling.
- Segmental Body Measurement held a 62.3% share in 2025, indicating strong demand for localized composition insights for personalized programs.
- Hospitals & Clinics contributed 62.0% of demand in 2025, reinforcing the institutional role of clinical nutrition and monitoring pathways.
Segment Analysis
Bioimpedance Analyzers Market demand is shaped by the convergence of clinical screening requirements and consumer-led body composition tracking. Hospitals and outpatient care centers increasingly use bioimpedance analyzers to support nutrition management, prehabilitation and rehabilitation monitoring, and fluid status assessment, which improves the clinical value of routine measurement. At the same time, wellness operators and home users are adopting bioimpedance analyzers to translate weight management goals into actionable composition metrics, increasing frequency of use and supporting upgrade cycles.
Technology choices are also influencing purchasing behavior in the Bioimpedance Analyzers Market. Buyers increasingly prioritize repeatability, workflow efficiency, and analytics-enabled reporting for longitudinal tracking. Multi-frequency designs are favored when use cases require more detailed segmentation of tissue and water compartments, while wireless configurations are gaining preference where portability, throughput, and ease of setup are critical. Segmental measurement remains central to differentiation in both clinical programs and fitness coaching, where localized insights improve personalization and engagement.
By Product Type Insights
Multi Frequency accounted for the largest share of 51.4% in 2025. Bioimpedance Analyzers Market buyers prioritize multi-frequency capabilities because richer impedance profiling improves assessment granularity across body compartments. Multi-frequency platforms also align well with segmental measurement workflows, enabling deeper coaching and clinical interpretation. Procurement preferences further support multi-frequency systems when clinics and wellness chains standardize reporting and longitudinal tracking across multiple sites.
By Modality Insights
Wireless accounted for the largest share in 2025. Bioimpedance Analyzers Market adoption is increasingly influenced by portability and operational convenience, particularly in wellness centers and outpatient environments. Wireless systems reduce setup friction and support higher throughput, which improves return on investment for multi-user settings. Wireless connectivity also supports longitudinal tracking and easier data sharing, which strengthens utilization across recurring measurement programs.
By Application Insights
Segmental Body Measurement accounted for the largest share of 62.3% in 2025. Bioimpedance Analyzers Market demand favors segmental assessment because localized insights support personalized nutrition, rehabilitation, and fitness programs. Segmental outputs also improve user engagement by translating progress into specific body-region changes rather than a single overall score. Technology improvements in sensors and analytics further reinforce segmental measurement as a differentiating capability in professional-grade systems.
By End User Insights
Hospitals & Clinics accounted for the largest share of 62.0% in 2025. Bioimpedance Analyzers Market demand remains anchored in clinical settings where standardized assessments support nutrition management and monitoring workflows. Hospitals and clinics also drive recurring demand through protocol-based usage in programs that require consistent follow-up measurements. Institutional procurement tends to favor validated performance, service support, and integration readiness, reinforcing leadership in this end-user segment.
Bioimpedance Analyzers Market Drivers
Rising demand for non-invasive clinical assessment and nutrition management
Bioimpedance Analyzers Market growth is supported by increasing demand for fast, non-invasive tools that help quantify body composition beyond basic weight measures. Hospitals and clinics use bioimpedance analyzers to strengthen nutrition assessment, track therapy progress, and support hydration-related monitoring in routine care pathways. Clinical programs benefit from repeatability and speed, which improve throughput and reduce workflow burden. As screening expands across outpatient settings, bioimpedance analyzers become a practical instrument for standardized, repeat measurements.
- For instance, the seca mBCA series has been validated against whole‑body MRI, 4‑compartment (4C) models, sodium bromide (NaBr), and deuterium (D2O) dilution in studies including more than 3,000 individuals from Germany, Japan, and Mexico, providing clinically trusted fat‑free mass and total body water data for hospital nutrition teams.
Expansion of fitness and wellness ecosystems adopting composition-based coaching
Bioimpedance Analyzers Market demand is reinforced by the shift from weight-centric tracking to composition-based outcomes in gyms, wellness centers, and corporate health programs. Segmental insights improve personalization, enabling coaches to target localized improvements and maintain user engagement. Subscription-based wellness programs also increase measurement frequency, raising the value of durable devices with stronger reporting features. As fitness chains scale, centralized data tracking encourages standardized device procurement across multiple sites.
Technology improvements supporting richer analytics and better user experience
Bioimpedance Analyzers Market adoption benefits from improvements in sensors, algorithms, and reporting that make results easier to interpret for both clinicians and consumers. Multi-frequency designs support more detailed impedance profiling, enabling broader use across clinical nutrition, rehabilitation, and wellness programs. Better interfaces and faster setup reduce friction, which improves utilization and repeat testing rates. Enhanced reporting and longitudinal dashboards also strengthen the operational value of bioimpedance analyzers for program-based measurement.
- For instance, seca mBCA equations for fat‑free mass, extracellular water, and total body water were developed against a 4‑compartment model in a cohort of 124 adults, enabling automated reports that clinicians can trust without manual recalculation.
Increasing emphasis on preventive health and longitudinal monitoring programs
Bioimpedance Analyzers Market growth is supported by preventive-health models that encourage repeat assessments and early risk identification. Body composition measurement supports structured programs for metabolic risk screening, lifestyle modification, and treatment adherence monitoring. Longitudinal data improves decision-making and strengthens patient and user engagement, which increases measurement cadence. As preventive programs expand across payers, clinics, and employers, demand rises for consistent devices and standardized reporting.
Bioimpedance Analyzers Market Challenges
Bioimpedance Analyzers Market adoption faces constraints related to measurement variability across devices, protocols, and user conditions. Hydration status, recent activity, and timing of measurement can affect readings, which increases the need for standard operating procedures. In clinical workflows, decision makers may require stronger validation and training to ensure repeatability and appropriate interpretation. These requirements can slow adoption in settings where staff time is limited and standardization is difficult to enforce.
- For instance, InBody states that its InBody 970S uses frequencies from 5 kHz to 3 MHz, captures 30 impedance measurements across five body segments using six frequencies, and pairs that design with an 8-point tactile electrode system to deliver 99% reproducibility; the company also provides more than 7 hours of professional training and certification, underscoring how vendors are investing in repeatability and operator standardization to address clinical adoption barriers.
Bioimpedance Analyzers Market growth is also challenged by pricing pressure and procurement complexity across cost-sensitive buyers. Wellness operators and smaller clinics may prioritize lower-cost devices, which intensifies competition and compresses margins. Integration expectations for data export and workflow compatibility can further increase selection complexity, particularly for multi-site organizations. In home-use segments, inconsistent adherence and limited coaching support can reduce long-term engagement, which can affect replacement and upgrade demand.
Bioimpedance Analyzers Market Trends and Opportunities
Bioimpedance Analyzers Market opportunities are expanding through connected reporting and program-based measurement models. Devices that support longitudinal dashboards, remote monitoring workflows, and standardized reporting can improve utilization across clinical nutrition programs and wellness subscriptions. Wireless configurations strengthen adoption where portability and throughput matter, enabling broader deployment in outpatient and fitness settings. As multi-site organizations standardize measurement protocols, vendors can capture larger rollouts and recurring service relationships.
- For instance, seca’s mBCA 525 automatically links its measuring mat to a touchscreen monitor by Wi-Fi and has storage capacity for more than 100,000 measurements, which strengthens longitudinal documentation and supports standardized tracking across hospitals and private practices.
Bioimpedance Analyzers Market trends also include increasing demand for segmental insights and higher-granularity assessment. Segmental measurement enables more personalized coaching and targeted clinical interventions, improving user engagement and perceived value. Multi-frequency platforms are increasingly preferred for advanced programs that require deeper interpretation and repeat monitoring. Vendors that align hardware improvements with better analytics and training support can expand adoption across both institutional and consumer-adjacent channels.
Regional Insights
North America
North America accounted for 37.20% of Bioimpedance Analyzers Market revenue in 2025, supported by higher spending intensity and established clinical screening pathways. Hospitals and multi-site clinics continue to anchor demand through protocol-driven use in nutrition and monitoring programs. Wellness chains also contribute to recurring measurement volumes, increasing utilization and replacement cycles. Vendors with strong service coverage and training capabilities benefit from standardization initiatives across large provider networks.
Europe
Europe represented 25.10% of Bioimpedance Analyzers Market revenue in 2025, supported by broad hospital coverage and structured care delivery in major countries. Procurement often emphasizes standardization, evidence-based practice, and cost-effectiveness across public and private systems. Demand remains strong in clinical nutrition and rehabilitation programs where repeat assessment is common. Suppliers that meet tender requirements and deliver reliable service coverage tend to perform well across multi-country deployments.
Asia Pacific
Asia Pacific contributed 23.40% of Bioimpedance Analyzers Market revenue in 2025, driven by expanding private healthcare capacity and rapid growth in organized fitness ecosystems. Large addressable populations and rising health awareness support increasing measurement volumes across urban centers. Adoption varies by country based on reimbursement, budget capacity, and availability of trained staff to standardize protocols. Vendors benefit from scalable portfolios that serve both clinical and wellness settings with localized distribution support.
Latin America
Latin America accounted for 7.90% of Bioimpedance Analyzers Market revenue in 2025, supported by growth in private healthcare and wellness services in key economies. Demand is concentrated in urban clinics and fitness chains where composition-based coaching is increasingly marketed as a differentiator. Budget constraints can shift purchasing toward mid-range devices, increasing the importance of distributor reach and after-sales service. As preventive programs expand, standardized measurement models can improve utilization and drive incremental demand.
Middle East & Africa
Middle East & Africa held 6.40% of Bioimpedance Analyzers Market revenue in 2025, led by private hospital investment and the growth of premium wellness offerings in select countries. Demand is often centered in high-income urban areas where body composition screening is integrated into preventive and lifestyle programs. Adoption in broader markets can be limited by affordability and uneven access to standardized protocols. Vendors that combine training, distributor support, and scalable device tiers can expand penetration over time.
Competitive Landscape
Bioimpedance Analyzers Market competition is shaped by differentiation across measurement accuracy, workflow efficiency, and reporting quality. Vendors compete by expanding multi-frequency and segmental capabilities, improving usability for higher throughput settings, and strengthening software reporting for longitudinal tracking. Product positioning increasingly separates clinical-grade platforms aimed at hospitals from portable devices targeted at wellness and home use. Channel partnerships and after-sales service coverage remain critical for institutional procurement and multi-site standardization.
Akern S.r.l. positions offerings toward clinical nutrition and monitoring use cases that require repeatable measurement and specialized interpretation. Product strategy emphasizes professional-grade analyzers and protocols that align with clinical workflows and follow-up assessments. Market approach typically benefits from specialization in medically oriented deployments where training, validation, and service reliability influence procurement. Continued portfolio refresh supports competitiveness as buyers seek standardized systems for structured measurement programs.
The industry research and growth report includes detailed analyses of the competitive landscape of the market and information about key companies, including:
- Akern S.r.l.
- Hologic, Inc.
- seca GmbH & Co. KG
- Omron Healthcare, Inc.
- InBody Co., Ltd.
- Tanita Corporation
- Biodynamics Corporation
- RJL Systems, Inc.
- Bodystat Ltd.
- Charder Electronic Co., Ltd.
Qualitative and quantitative analysis of companies has been conducted to help clients understand the wider business environment as well as the strengths and weaknesses of key industry players. Data is qualitatively analyzed to categorize companies as pure play, category-focused, industry-focused, and diversified; it is quantitatively analyzed to categorize companies as dominant, leading, strong, tentative, and weak.
Recent Developments
- In June 2025, BioNTech SE and Bristol Myers Squibb announced a global strategic partnership to co-develop and co-commercialize BNT327, BioNTech’s investigational PD-L1xVEGF-A bispecific antibody for multiple solid tumor types. In the announcement, the companies said the agreement is intended to broaden and accelerate development of the candidate across numerous indications.
- In June 2025, Camurus and Eli Lilly and Company entered a collaboration and license agreement for long-acting incretin products for cardiometabolic health based on Camurus’ FluidCrystal technology and Lilly’s proprietary drug compounds. Camurus said Lilly received exclusive worldwide rights under the deal, which covers up to four Lilly compounds and carries potential milestone payments of up to $870 million plus royalties.
- In March 2024, Celltrion announced the U.S. availability of Zymfentra (infliximab-dyyb), described as the first and only subcutaneous infliximab approved by the FDA in 2023. A published review on subcutaneous infliximab noted that this formulation is considered a potential biobetter because it aims to improve convenience and other treatment characteristics compared with intravenous infliximab.
Report Scope
| Report Attribute | Details |
| Market size value in 2025 | USD 880.14 million |
| Revenue forecast in 2032 | USD 2282 million |
| Growth rate (CAGR) | 14.58% (2025–2032) |
| Base year | 2025 |
| Forecast period | 2026-2032 |
| Quantitative units | USD million |
| Segments covered | By Product Type Outlook: Single Frequency, Multi Frequency, Dual Frequency; By Modality Outlook: Wired, Wireless; By Application Outlook: Whole Body Measurement, Segmental Body Measurement; By End User Outlook: Hospitals & Clinics, Fitness Clubs & Wellness Centers, Home Users |
| Regional scope | North America, Europe, Asia Pacific, Latin America, Middle East & Africa |
| Key companies profiled | Akern S.r.l., Hologic, Inc., seca GmbH & Co. KG, Omron Healthcare, Inc., InBody Co., Ltd., Tanita Corporation, Biodynamics Corporation, RJL Systems, Inc., Bodystat Ltd., Charder Electronic Co., Ltd. companies |
| No.of Pages | 328 |
Segmentation
By Product Type
- Single Frequency
- Multi Frequency
- Dual Frequency
By Modality
- Wired
- Wireless
By Application
- Whole Body Measurement
- Segmental Body Measurement
By End User
- Hospitals & Clinics
- Fitness Clubs & Wellness Centers
- Home Users
By Region
- North America
- U.S.
- Canada
- Mexico
- Europe
- Germany
- France
- U.K.
- Italy
- Spain
- Rest of Europe
- Asia Pacific
- China
- Japan
- India
- South Korea
- South-east Asia
- Rest of Asia Pacific
- Latin America
- Brazil
- Argentina
- Rest of Latin America
- Middle East & Africa
- GCC Countries
- South Africa
- Rest of the Middle East and Africa
Request a Free Sample
Fill in your details and we'll send you a free sample report.
- Sample data tables & charts
- Research methodology
Need a Custom Version of This Report?
Tailor the scope, geography, or segments to your exact requirements.
- Custom geography or segment scope
- Direct access to our analyst team
Frequently Asked Questions
What is the current size of the Bioimpedance Analyzers Market?
What is the forecast size of the Bioimpedance Analyzers Market?
What is the CAGR of the Bioimpedance Analyzers Market?
What is the largest segment in the Bioimpedance Analyzers Market?
Who are the leading companies in the Bioimpedance Analyzers Market?
Which region leads the Bioimpedance Analyzers Market?
Table of Content
Chapter 1. Report Introduction
- 1.1 Report Description & Purpose
- 1.1.1 Report Title & Market Definition
- 1.1.2 Unique Selling Propositions (USP) & Key Differentiators
- 1.1.3 Value Proposition for Stakeholders
- 1.2 Research Objectives
- 1.2.1 Market Sizing Objectives (Volume & Revenue)
- 1.2.2 Segmentation Objectives
- 1.2.3 Competitive Intelligence Objectives
- 1.2.4 Forecast & Scenario Objectives
- 1.3 Report Scope
- 1.3.1 Bioimpedance Analyzers Scope – Types & Subtypes Covered
- 1.3.2 Geographic Scope – Regions & Countries Covered
- 1.3.3 Historical Period, Base Year & Forecast Period (2025; forecast to 2032)
- 1.3.4 Inclusions & Exclusions
- 1.4 HS Code & Classification Framework
- 1.5 Currency, Units & Pricing Basis
- 1.6 Target Stakeholders
- 1.7 Limitations & Assumptions
Chapter 2. Executive Summary
- 2.1 Global Bioimpedance Analyzers Market Snapshot
- 2.1.1 Market Size – Historical (2025) & Forecast (2025-2032) (2025: USD 880.14 million → 2032: USD 2,282 million)
- 2.1.2 Volume & Revenue – Global Totals
- 2.1.3 Key Market Highlights – Top Five Facts
- 2.2 Bioimpedance Analyzers Market Segmentation Snapshot
- 2.2.1 Market Split by Region – 2025 vs. 2032
- 2.3 Competitive Snapshot
- 2.3.1 Top 10 Players by Revenue Share – 2025
- 2.3.2 Top 10 Players by Volume Share – 2025
- 2.3.3 Recent Strategic Developments (18-Month Summary)
- 2.4 Key Investment Highlights & Strategic Conclusions
Chapter 3. Bioimpedance Analyzers Market Dynamics & Industry Analysis
- 3.1 Market Overview & Context
- 3.1.1 Bioimpedance Analyzers Market Position in the Broader Automotive Value Chain
- 3.1.2 OEM vs. Replacement Market Dynamics
- 3.1.3 Market Maturity & Development Stage by Region
- 3.2 Bioimpedance Analyzers Market Drivers
- 3.3 Bioimpedance Analyzers Market Restraints & Challenges
- 3.4 Bioimpedance Analyzers Market Opportunities
- 3.5 Porter's Five Forces Analysis
- 3.5.1 Threat of New Entrants
- 3.5.2 Bargaining Power of Suppliers
- 3.5.3 Bargaining Power of Buyers
- 3.5.4 Threat of Substitutes
- 3.5.5 Competitive Rivalry – Intensity Assessment
- 3.6 Bioimpedance Analyzers Value Chain Analysis
- 3.6.1 Upstream – Raw Material/Input Suppliers
- 3.6.1.1 Raw Material/Input 1
- 3.6.1.2 Raw Material/Input 2
- 3.6.1.3 Raw Material/Input 3
- 3.6.2 Midstream – Production/Manufacturing/Service Delivery
- 3.6.2.1 Production/Process Overview
- 3.6.2.2 Key Facility Locations & Capacity by Manufacturer
- 3.6.3 Downstream – Distribution & End Consumer
- 3.6.3.1 Primary Channel – B2B/OEM
- 3.6.3.2 Secondary Channels – Dealer, Retail, Online, Direct
- 3.6.4 Value Chain Profitability Analysis
- 3.6.1 Upstream – Raw Material/Input Suppliers
- 3.7 PESTEL Analysis
- 3.7.1 Political Factors
- 3.7.2 Economic Factors
- 3.7.3 Social Factors
- 3.7.4 Technological Factors
- 3.7.5 Environmental Factors
- 3.7.6 Legal Factors
- 3.8 Bioimpedance Analyzers Supply Chain Analysis
- 3.8.1 Raw Material/Input Supply Risk Assessment
- 3.8.2 Manufacturing Concentration Risk (Geographic Exposure)
- 3.8.3 Trade Disruption Impact Analysis
- 3.9 Regulatory & Policy Landscape
Note: The regulatory and policy landscape section covers regulations based on their applicability to the market, Bioimpedance Analyzers category, geography, and scope of the study. Only regulatory frameworks with a material impact on operations, compliance, trade, sustainability, or market access are analyzed in detail.
Chapter 4. Key Investment Pockets & Opportunity Analysis
- 4.1 Bioimpedance Analyzers Market Attractiveness Analysis
- 4.1.1 By Region – Investment Attractiveness Matrix (Volume × CAGR)
- 4.2 Absolute Revenue Growth Opportunity
- 4.2.1 By Region – Absolute USD Growth Through 2032
- 4.3 Incremental Volume Opportunity
- 4.3.1 By Region – Incremental Volume Through 2032
- 4.3.2 Segment – Incremental Volume
- 4.4 Emerging Submarket Opportunity Deep Dive (Subject to Applicability)
- 4.5 Emerging Market Opportunity Scorecards
- 4.5.1 United States
- 4.5.2 Europe
- 4.5.3 Asia
- 4.5.4 Middle East & Africa
Note: Emerging Market Opportunity Scorecards will be included based on relevance and strategic importance. Regions listed are indicative and may vary depending on data availability and market dynamics.
Chapter 5. Bioimpedance Analyzers Import-Export Analysis & Trade Flows
- 5.1 Global Trade Overview
- 5.1.1 Global Export Value by Country (2025)
- 5.1.2 Global Export Volume by Country (2025)
- 5.1.3 Global Import Value by Country (2025)
- 5.1.4 Global Import Volume by Country (2025)
- 5.1.5 Net Trade Balance by Country (2025)
- 5.2 Export Analysis – Segment
- 5.2.1 Type 1 (HS Code)
- 5.2.2 Type 2 (HS Code)
- 5.2.3 Type 3 (HS Code)
- 5.2.4 Type 4 (HS Code)
- 5.2.5 Type 5 (HS Code)
- 5.3 Import Analysis – Segment
- 5.3.1 Type 1 (HS Code)
- 5.3.2 Type 2 (HS Code)
- 5.3.3 Type 3 (HS Code)
- 5.3.4 Type 4 (HS Code)
- 5.3.5 Type 5 (HS Code)
- 5.4 Average Unit Trade Prices
- 5.4.1 Average Export Price – Segment & Country
- 5.4.2 Average Import Price – Segment & Source Country
- 5.4.3 Price Trends (2025)
- 5.5 Key Trade Route Analysis
- 5.5.1 Trade Route 1
- 5.5.2 Trade Route 2
- 5.5.3 Trade Route 3
- 5.5.4 Trade Route 4
- 5.5.5 Trade Route 5
- 5.6 Trade Policy Impact Assessment
- 5.6.1 US Anti-Dumping & Section 301 Tariffs
- 5.6.2 EU Customs Union Impact
- 5.6.3 Major Free Trade Agreements
- 5.6.4 USMCA Rules of Origin
Note: Trade policy analysis will be included only where relevant to the Bioimpedance Analyzers market.
Chapter 6. Competitive Landscape & Company Benchmarking
- 6.1 Bioimpedance Analyzers Market Concentration & Structure
- 6.1.1 Herfindahl-Hirschman Index (HHI) – vs. 2025
- 6.1.2 Tier 1, Tier 2 & Tier 3 Market Structure
- 6.1.3 Global, Regional & Local Player Dynamics
- 6.2 Bioimpedance Analyzers Market Share Analysis – 2025
- 6.2.1 Global Revenue Share by Company
- 6.2.2 Global Volume Share by Company
- 6.2.3 Regional Revenue Share
- 6.2.4 Market Share Evolution ( vs. 2025)
- 6.2.5 OEM Segment Share by Company
- 6.2.6 Replacement Segment Share by Company
- 6.3 Production/Delivery Capacity & Facility Analysis
- 6.3.1 Global Installed Capacity
- 6.3.2 Capacity Utilization Rates
- 6.3.3 Production/Output Volume
- 6.3.4 Facility Locations & Capacity Map
- 6.3.5 Planned Capacity Additions
- 6.4 Bioimpedance Analyzers Competitive Benchmarking Matrix
- 6.4.1 Revenue, Volume, CAGR & Profitability Comparison
- 6.4.2 Channel Revenue Mix
- 6.4.3 Geographic Revenue Exposure
- 6.4.4 R&D Intensity
- 6.4.5 Sustainability Maturity
- 6.5 Strategic Developments in Bioimpedance Analyzers (Last 24 Months)
- 6.5.1 Mergers, Acquisitions & Divestments
- 6.5.2 New Bioimpedance Analyzers Launches
- 6.5.3 Facility Expansions
- 6.5.4 Strategic Alliances, Joint Ventures & Partnerships
- 6.5.5 Distribution Expansion & Market Entry
- 6.5.6 Sustainability & ESG Initiatives
- 6.6 Competitive Strategy Mapping
- 6.6.1 Leader, Challenger, Follower & Niche Classification
- 6.6.2 Pricing Strategy Comparison
- 6.6.3 Channel Strategy Matrix
Note: Strategic developments are included based on their materiality and the availability of reliable information.
Chapter 7. Global Bioimpedance Analyzers Market – By Distribution Channel
- 7.1 Segment Overview
- 7.1.1 Volume & Revenue Split by Channel (2025 & 2032)
- 7.1.2 Channel Mix Evolution (2025-2032)
Chapter 8. Regional Market Analysis – Global Overview
- 8.1 Global Regional Overview
- 8.1.1 Regional Volume Share
- 8.1.2 Regional Revenue Share
- 8.1.3 Regional Volume by Region
- 8.1.4 Regional Revenue by Region
- 8.1.5 Regional Forecast Through 2032
- 8.2 Cross-Regional Segment Analysis
- 8.2.1 By Distribution Channel
- 8.2.2 By Brand/Price Tier
Chapter 9. North America Bioimpedance Analyzers Market
- 9.1 United States
- 9.2 Canada
- 9.3 Mexico
Chapter 10. Europe Bioimpedance Analyzers Market
- 10.1 Germany
- 10.2 France
- 10.3 Italy
- 10.4 United Kingdom
- 10.5 Spain
- 10.6 Poland
- 10.7 Russia
- 10.8 Netherlands
- 10.9 Belgium
- 10.10 Sweden
- 10.11 Denmark
- 10.12 Norway
- 10.13 Rest of Europe
Chapter 11. Asia Pacific Bioimpedance Analyzers Market
- 11.1 China
- 11.2 India
- 11.3 Japan
- 11.4 South Korea
- 11.5 Thailand
- 11.6 Indonesia
- 11.7 Vietnam
- 11.8 Malaysia
- 11.9 Australia
- 11.10 Rest of Asia Pacific
Chapter 12. Latin America Bioimpedance Analyzers Market
- 12.1 Brazil
- 12.2 Argentina
- 12.3 Colombia
- 12.4 Chile
- 12.5 Rest of Latin America
Chapter 13. Middle East Bioimpedance Analyzers Market
- 13.1 Saudi Arabia
- 13.2 United Arab Emirates
- 13.3 Turkey
- 13.4 Israel
- 13.5 Iran
- 13.6 Rest of the Middle East
Chapter 14. Africa Bioimpedance Analyzers Market
- 14.1 South Africa
- 14.2 Egypt
- 14.3 Nigeria
- 14.4 Morocco
- 14.5 Rest of Africa
Chapter 15. Bioimpedance Analyzers Company Profiles
- 15.1 [Company 01]
- 15.1.1 Company Overview
- 15.1.2 Key Management Personnel
- 15.1.3 Products & Services Portfolio
- 15.1.4 Financial Performance
- 15.1.5 Key Market Focus & Geographic Presence
- 15.1.6 Recent Developments & Strategic Initiatives
Note: The company profile list is preliminary and may change based on research findings, market developments, data availability, and client requirements.
Chapter 16. Appendices
- Appendix A – List of Abbreviations & Acronyms
- Appendix B – Industry Classification Code Reference – Full Series
- Appendix C – Production & Capacity Data Tables
- Appendix D – End-Use & Demand Base Tables
- Appendix E – Consumption & Replacement Rate Assumptions
- Appendix F – ASP Reference Tables
- Appendix G – Manufacturing & Facility Database
- Appendix H – Import-Export Data Tables
- Appendix I – Regulatory Summary Tables
- Appendix J – Primary Research Participant List (Anonymized)
- Appendix K – Primary Research Questionnaire Framework
- Appendix L – Data Sources & Bibliography
- Appendix M – Market Size Divergence & Source Comparison
Chapter 17. Research Methodology
- 17.1 Research Framework & Philosophy
- 17.2 Secondary Research – Sources, Hierarchy & Data Extraction
- 17.3 Data Modeling – Bottom-Up & Top-Down Market Sizing
- 17.4 Primary Research – Stakeholder Framework, LOI & Sample Sizes
- 17.5 Forecast Methodology – Regression, Scenario & Sensitivity Analysis
- 17.6 Quality Control – Four-Layer Validation Framework
- 17.7 Limitations & Standard Assumptions
- 17.8 Disclaimer
