Blood Pressure Monitoring Devices Market Overview:
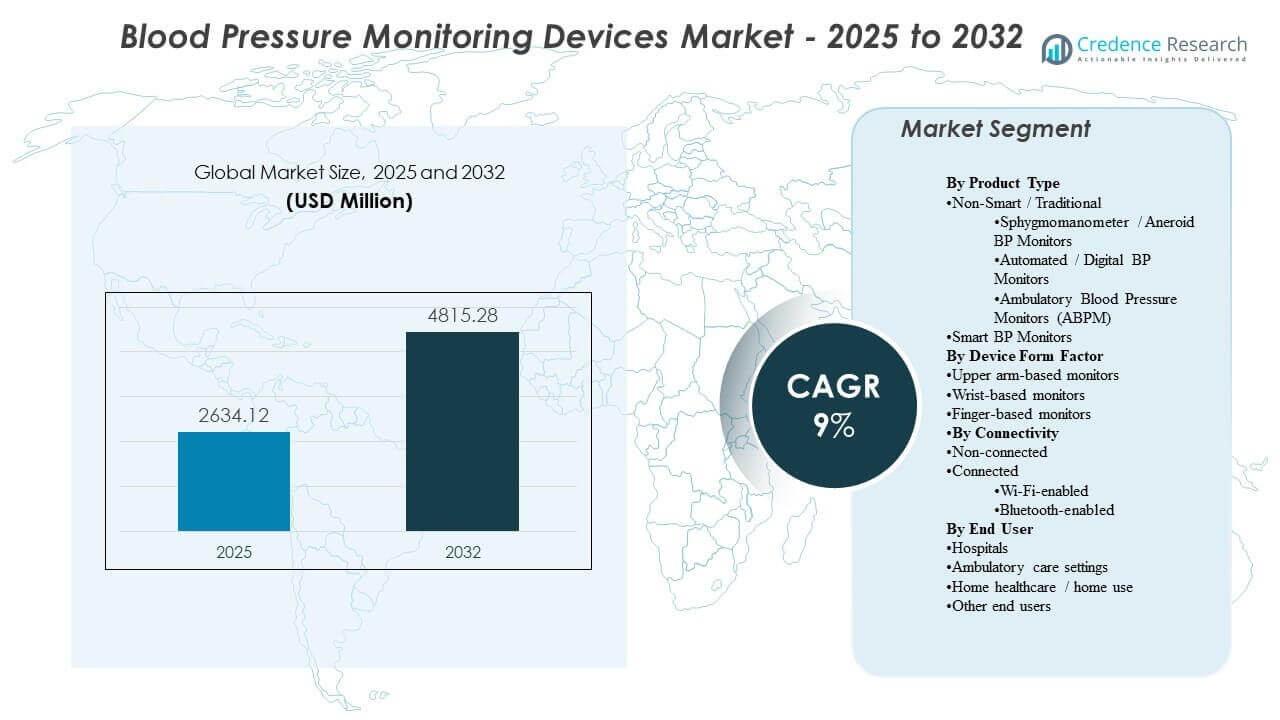
The global Blood Pressure Monitoring Devices Market size was estimated at USD 2634.12 million in 2025 and is expected to reach USD 4815.28 million by 2032, growing at a CAGR of 9% from 2025 to 2032. Demand expansion is primarily supported by rising hypertension prevalence and the steady shift toward routine monitoring across clinical workflows and home settings, which increases replacement cycles and device volume requirements. Adoption momentum remains strongest in developed healthcare systems, while awareness and access improvements are widening usage across emerging markets.
| REPORT ATTRIBUTE |
DETAILS |
| Historical Period |
2020-2024 |
| Base Year |
2025 |
| Forecast Period |
2026-2032 |
| Blood Pressure Monitoring Devices Market Size 2025 |
USD 2634.12 million |
| Blood Pressure Monitoring Devices Market, CAGR |
9% |
| Blood Pressure Monitoring Devices Market Size 2032 |
USD 4815.28 million |
Key Market Trends & Insights
- The Blood Pressure Monitoring Devices Market is projected to expand at a 9% CAGR (2025–2032), reflecting sustained demand from chronic disease monitoring pathways.
- North America accounted for 34.90% share in 2025, supported by high diagnosis rates, reimbursement-backed monitoring, and broad retail availability.
- Europe represented 29.70% share in 2025, benefiting from mature primary care screening and standardized hypertension management practices.
- Asia Pacific held 24.10% share in 2025, underpinned by large patient populations and accelerating uptake of home-use devices.
- Upper arm-based monitors captured 58.3% share in 2025, indicating continued preference for cuff-based accuracy and clinical alignment.
Segment Analysis
Blood Pressure Monitoring Devices Market demand is shaped by the balance between clinical-grade accuracy requirements and user-friendly adoption in home settings. Upper arm-based devices continue to dominate procurement because cuff-based measurements align with clinical protocols and support consistent longitudinal tracking for hypertension management. The connected device category is gaining relevance as more care models incorporate remote monitoring, data sharing, and app-enabled coaching for adherence.
End-user demand is increasingly diversified as monitoring shifts beyond hospitals into ambulatory and home environments. Hospitals still anchor volumes due to routine vitals capture and standardized monitoring infrastructure, but home use is expanding as consumers adopt regular self-measurement for chronic disease control. These forces increase demand for durable devices, easy-to-use workflows, and improved comfort designs that support frequent readings.
Access crucial information at unmatched prices!
Request your sample report today & start making informed decisions powered by Credence Research Inc.!
Download Sample
By Product Type Insights
Non-Smart/Traditional Type accounted for the largest share of the market in 2025. Non-smart systems remain widely adopted because hospitals and clinics rely on familiar workflows and validated measurement approaches for routine assessments. Automated digital monitors within the traditional category support broader home adoption through convenience and quick readings. Smart devices are expanding adoption where remote monitoring programs and app-based tracking support longitudinal management.
By Device Form Factor Insights
Upper arm-based monitors accounted for the largest share of 58.3% in 2025. Upper arm formats remain preferred because cuff positioning and measurement stability align more closely with clinical practice and guideline-based use. Home users often select upper arm monitors to reduce uncertainty around accuracy compared with wrist and finger alternatives. Wrist-based and finger-based formats benefit from portability, but primary-use adoption is more sensitive to consistency and technique.
By Connectivity Insights
Non-Connected accounted for the largest share of the market in 2025. Non-connected monitors continue to serve cost-sensitive demand and straightforward point-measurement use cases in homes and smaller care settings. Connected monitoring is expanding as care teams and consumers prioritize data storage, trend visibility, and easier sharing of readings. Bluetooth-based solutions tend to benefit from phone pairing simplicity, while Wi-Fi models can support more passive uploading in chronic care workflows.
By End User Insights
Hospitals accounted for the largest share of 50.8% in 2025. Hospitals maintain leadership because blood pressure measurement is embedded in triage, inpatient monitoring, perioperative care, and routine vitals capture across departments. Procurement standardization and device uptime requirements support consistent replacement and fleet upgrades. Home healthcare and home use are expanding as chronic disease self-management becomes more common and as care pathways encourage regular monitoring between visits.
Blood Pressure Monitoring Devices Market Drivers
Expanding hypertension screening and chronic disease management
Hypertension screening is widening across primary care, pharmacies, and community programs, increasing the total number of measurements performed each year. These programs support higher demand for reliable monitors across multiple care settings. Chronic disease management pathways also emphasize repeated measurements to confirm control and adjust therapy. This pattern supports recurring purchases and replacement cycles for both clinical and home-use devices. In addition, screening guidelines and quality metrics are pushing providers to document readings more frequently and consistently. Rising comorbidity burdens (diabetes, obesity, CKD) also increase monitoring intensity across patient cohorts.
- For instance, Higi reported that more than 61 million people had used its Higi Stations to complete over 372 million biometric tests, reflecting the measurable scale that company-led community screening infrastructure can achieve.
Growth in home monitoring and self-measurement behavior
Home monitoring adoption is rising as consumers seek convenience and routine tracking outside clinical visits. Providers increasingly encourage self-measurement to reduce white-coat effects and improve longitudinal visibility between appointments. Home use also increases demand for automated devices that simplify reading capture and reduce user error. This driver supports broader retail penetration and higher unit volumes. More patients are adopting structured home BP logs to support medication titration and lifestyle management decisions. Device designs that improve cuff comfort and ease-of-use further encourage repeat measurement and long-term adherence.
- For instance, OMRON’s 10 Series upper-arm monitor stores 200 readings for two users, averages up to three readings taken within 10 minutes, and offers TruRead measurement intervals of 15 seconds, 30 seconds, 60 seconds, or 2 minutes, giving home users a more structured monitoring workflow.
Digital health programs and remote monitoring integration
Remote monitoring programs are increasing demand for devices that can store readings and share data to care teams with minimal friction. Device connectivity enables longitudinal dashboards, threshold alerts, and adherence tracking that can improve care management. This shift encourages manufacturers to expand app ecosystems and compatibility with broader digital platforms. The resulting demand favors devices designed for integration and ongoing engagement. Payers and health systems are also scaling RPM programs for hypertension to reduce avoidable ER visits and complications. As a result, interoperability with EHRs and care management platforms is becoming a more decisive purchase criterion.
Institutional standardization and accuracy-led procurement
Hospitals and larger provider networks prioritize consistent devices and workflows to reduce variability in measurements across sites. Accuracy validation, cuff comfort, durability, and service support influence purchasing decisions. Standardization also supports training efficiency and reduces operational variability. These needs sustain demand for established brands and stable supply models. Facilities increasingly prefer vendors that offer calibration support, multi-cuff sizing, and robust service SLAs to reduce downtime. Standardizing across departments also improves protocol compliance and simplifies staff onboarding in high-turnover environments.
Blood Pressure Monitoring Devices Market Challenges
Pricing pressure remains a key constraint as buyers in cost-sensitive markets prioritize affordable devices and basic functionality. Lower-price competition can compress margins and limit the pace of feature upgrades in entry segments. Accuracy perception differences across form factors and brands can also slow adoption when users lack confidence in readings. Tender-driven purchasing can intensify commoditization, especially for basic digital cuffs and manual devices. Counterfeit and low-quality imports in some markets can further erode trust and weaken brand differentiation.
Data privacy expectations and interoperability demands can complicate connected device adoption in clinical programs. Platform fragmentation across apps and health systems may limit seamless data exchange. These barriers raise the importance of integration support, user onboarding, and long-term software maintenance. Compliance requirements around data handling, consent, and storage add time and cost to deployments, particularly for multi-site providers. Poor integration can also increase clinician workload if readings require manual review or duplicate documentation.
- For instance, Validic reports that its health IoT platform supports 570+ connected devices, processes more than 15 billion annual data transactions, and is available as a standard integration in Epic Showroom and Oracle Health Millennium, illustrating the scale of infrastructure required to support secure and interoperable remote monitoring workflows across providers.
Blood Pressure Monitoring Devices Market Trends and Opportunities
Connected monitoring is becoming more common as healthcare delivery models emphasize longitudinal tracking and between-visit engagement. Manufacturers are prioritizing simpler pairing, better user interfaces, and improved data visualization to strengthen adherence and retention. This trend supports differentiation beyond hardware through software and services. Vendors are increasingly bundling devices with coaching, reminders, and cloud dashboards to improve engagement and outcomes. Partnerships with telehealth and RPM providers are also expanding distribution pathways for connected monitors.
- For instance, OMRON Healthcare’s 2025 integration with Doctor Anywhere enabled health-record sharing from three connected monitor models HEM-7600T, HEM-7361T, and HEM-6232T into a telehealth platform whose Southeast Asia user base exceeds 2 million, highlighting how connected-device ecosystems can extend remote monitoring reach beyond the device itself.
Procurement opportunities are expanding in emerging markets as awareness, access, and localized manufacturing improve affordability and availability. Public health initiatives and private retail distribution growth can broaden consumer uptake. This environment supports growth for brands that combine reliable accuracy with scalable channels and localized support. Urbanization and expanding pharmacy chains are improving last-mile availability of home monitors in many countries. Local assembly and sourcing can also reduce cost barriers and improve supply resilience for large-volume programs.
Regional Insights
North America
North America led the Blood Pressure Monitoring Devices Market in 2025 with a 34.90% share, supported by strong diagnosis rates, routine monitoring culture, and broad access across clinical and retail channels. Provider adoption is reinforced by chronic disease management programs and demand for reliable institutional fleets. Home monitoring growth is supported by consumer preference for self-measurement and ongoing wellness tracking.
Europe
Europe accounted for 29.70% share in 2025, driven by established primary care pathways and standardized screening practices. The region benefits from broad clinical adoption, stable replacement cycles, and strong penetration of automated devices for routine monitoring. Demand also reflects aging demographics and persistent focus on cardiovascular risk management.
Asia Pacific
Asia Pacific represented 24.10% share in 2025, supported by large patient populations, improving healthcare access, and rising home monitoring adoption. Expansion is reinforced by growing awareness of hypertension control and increasing retail availability of automated devices. Manufacturers that optimize affordability and distribution breadth tend to perform well in this region.
Latin America
Latin America held 6.60% share in 2025, with demand supported by growing chronic disease burden and gradual expansion of home monitoring. Adoption is influenced by pricing sensitivity and channel access, with pharmacies and retail networks playing a major role. Public health screening programs can strengthen institutional purchasing over time.
Middle East & Africa
Middle East & Africa accounted for 4.70% share in 2025, reflecting mixed access levels across countries and uneven diagnostic coverage. Demand is supported by expanding hospital infrastructure in select markets and increasing consumer availability in urban centers. Affordable device options and service support remain important purchase drivers.
Competitive Landscape
Competition in the Blood Pressure Monitoring Devices Market is shaped by product accuracy validation, cuff comfort, device durability, and ease of use across clinical and home settings. Brands differentiate through feature sets such as multi-user support, memory capacity, and digital experiences that improve adherence. Distribution strength across hospitals, pharmacies, and consumer channels also plays a major role in share capture.
Omron Healthcare maintains a leading position through a broad blood pressure portfolio spanning home-use automated monitors and clinically oriented solutions. Omron Healthcare focuses on accuracy-led positioning, broad retail availability, and ecosystem development that supports repeat use and longitudinal tracking. Omron Healthcare also benefits from strong brand recognition that supports conversion in home monitoring and chronic disease management routines.
The industry research and growth report includes detailed analyses of the competitive landscape of the market and information about key companies, including:
Qualitative and quantitative analysis of companies has been conducted to help clients understand the wider business environment as well as the strengths and weaknesses of key industry players. Data is qualitatively analyzed to categorize companies as pure play, category-focused, industry-focused, and diversified; it is quantitatively analyzed to categorize companies as dominant, leading, strong, tentative, and weak.
Shape Your Report to Specific Countries or Regions & Enjoy 30% Off!
Recent Developments
- In January 2025, Withings introduced BPM Vision, a travel-size home blood pressure monitor with interchangeable cuffs, a large on-device display, Wi-Fi connectivity, and support for up to eight user profiles. In the same update, the company said the device was planned for U.S. release in April 2025, subject to FDA approval.
- In January 2025, Myant Corp. announced the acquisition of mmHg Inc., a digital health company focused on remote blood pressure monitoring, cardiovascular risk reduction, and chronic disease management. The company said the deal expands Myant’s U.S. footprint and strengthens its position in remote cardiovascular monitoring.
- In June 2025, Babyscripts entered a partnership with Withings Health Solutions to strengthen its remote blood pressure monitoring program for maternity care. Under the partnership, Babyscripts members gained access to Withings’ FDA-cleared BPM Pro 2 device, which supports at-home blood pressure tracking and symptom collection directly on the monitor.
- In June 2025, , Sky Labs unveiled what it described as the world’s first ring-type cuffless blood pressure monitor at the European Society of Hypertension 2025 meeting in Milan. The company also said it planned to launch a consumer-focused version, CART BP, in September 2025.
Report Scope
| Report Attribute |
Details |
| Market size value in 2025 |
USD 2634.12 million |
| Revenue forecast in 2032 |
USD 4815.28 million |
| Growth rate (CAGR) |
9% (2025–2032) |
| Base year |
2025 |
| Forecast period |
2026–2032 |
| Quantitative units |
USD million |
| Segments covered |
By Product Type Outlook: Non-Smart/Traditional Type (Sphygmomanometer/Aneroid BP Monitor, Automated/Digital Blood Pressure Monitor, Ambulatory Blood Pressure Monitor); Smart Type
By Device Form Factor Outlook: Upper arm-based monitors; Wrist-based monitors; Finger-based monitors
By Connectivity Outlook: Non-Connected; Connected (Wi-Fi-based, Bluetooth-based)
By End User Outlook: Hospitals; Ambulatory care settings; Home healthcare / home use; Other end users |
| Regional scope |
North America, Europe, Asia Pacific, Latin America, Middle East & Africa |
| Key companies profiled |
Omron Healthcare; Koninklijke Philips N.V. (Philips Healthcare); GE HealthCare (General Electric Company); A&D Company, Limited (A&D Medical); American Diagnostic Corporation (ADC); Spacelabs Healthcare; Rossmax International Ltd.; Microlife AG; Withings; Welch Allyn |
| No. of Pages |
332 |
Segmentation
By Product Type
- Non-Smart/Traditional Type [Sphygmomanometer/Aneroid BP Monitor, Automated/Digital Blood Pressure Monitor, Ambulatory Blood Pressure Monitor]
- Smart Type
By Device Form Factor
- Upper arm-based monitors
- Wrist-based monitors
- Finger-based monitors
By Connectivity
- Non-Connected
- Connected [Wi-Fi-based, Bluetooth-based]
By End User
- Hospitals
- Ambulatory care settings
- Home healthcare / home use
- Other end users
By Region
- North America
- Europe
- Germany
- France
- U.K.
- Italy
- Spain
- Rest of Europe
- Asia Pacific
- China
- Japan
- India
- South Korea
- South-east Asia
- Rest of Asia Pacific
- Latin America
- Brazil
- Argentina
- Rest of Latin America
- Middle East & Africa
- GCC Countries
- South Africa
- Rest of the Middle East and Africa


