
Blood Transfusion Device Market
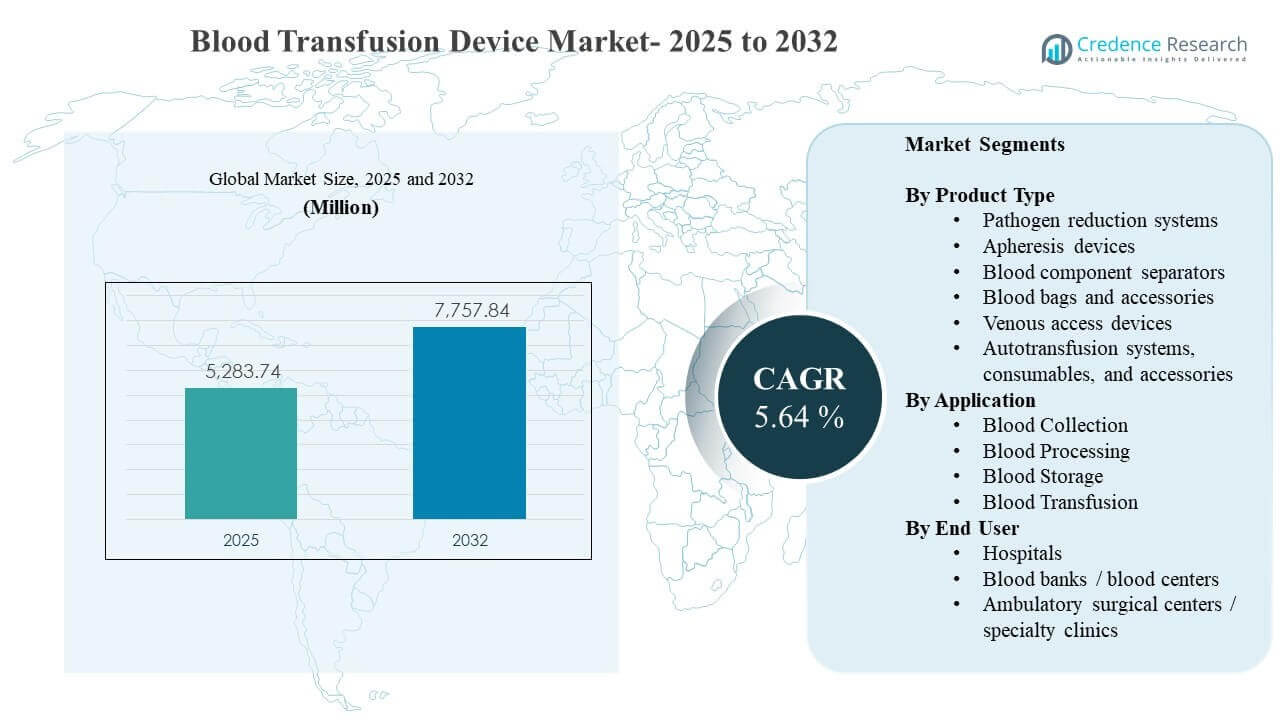
The global Blood Transfusion Device Market size was estimated at USD 5,283.74 million in 2025 and is expected to reach USD 7,757.84 million by 2032, growing at a CAGR of 5.64% from 2025 to 2032. Growth is primarily supported by rising transfusion-linked clinical workloads across surgery, trauma, oncology, and chronic disease management, which increases the recurring need for safe collection, processing, storage, and administration tools in hospitals and blood centers. Ongoing modernization of transfusion workflows, including higher automation in component preparation and stronger safety and traceability practices, continues to reinforce replacement demand and pull-through for consumables across mature markets and rapidly expanding healthcare systems.
| REPORT ATTRIBUTE | DETAILS |
|---|---|
| Historical Period | 2020-2024 |
| Base Year | 2025 |
| Forecast Period | 2026-2032 |
| Blood Transfusion Device Market Size 2025 | USD 5,283.74 million |
| Blood Transfusion Device Market, CAGR | 5.64% |
| Blood Transfusion Device Market Size 2032 | USD 7,757.84 million |
Key Market Trends & Insights
- The Blood Transfusion Device Market is projected to increase from USD 5,283.74 million in 2025 to USD 7,757.84 million by 2032, reflecting sustained demand expansion through the forecast window.
- The market is expected to grow at a CAGR of 5.64% during 2025–2032, supported by steady procedure volumes and ongoing workflow modernization in transfusion services.
- Blood bags & accessories accounted for the largest product share of 37.4% in 2025, reflecting high-frequency consumable usage across routine collection and transfusion pathways.
- Blood Collection represented 42.3% of the application mix in 2025, supported by structural repeat volumes and standardized donation and hospital draw protocols.
- North America held the leading regional share of 39.3% in 2025, supported by mature blood center networks and higher per-procedure device intensity.
Segment Analysis
Demand patterns in the Blood Transfusion Device Market are shaped by recurring consumables and the reliability requirements of transfusion workflows, which sustain purchasing across hospitals and blood centers. Buyers typically prioritize safety, standardization, and compatibility with established processing and administration practices, which favors suppliers offering integrated portfolios spanning collection sets, component preparation, storage consumables, and access devices. Automation is increasingly evaluated through productivity and error-reduction lenses, particularly in high-throughput blood centers that seek consistent component quality and reduced manual handling.
Procurement decisions also reflect a shift toward workflow simplification and traceability, with more emphasis on closed-system handling, labeling discipline, and inventory management to reduce wastage and improve availability. In parallel, hospitals and specialty care settings continue to value dependable transfusion administration and access solutions that can reduce variability across clinical teams. Across regions, the mix of replacement demand and capacity expansion creates a balanced growth profile, with faster adoption of modern systems where healthcare infrastructure is scaling.
By Product Type Insights
Blood bags & accessories accounted for the largest share of 37.4% in 2025. The segment leads because blood bags, tubing, and related consumables are used repeatedly across routine donation, component separation, and bedside administration workflows, creating high-volume pull-through. Standardized configurations and strict quality requirements reinforce consistent procurement and predictable replacement cycles. The large installed base of collection and processing systems further supports steady consumable demand across both hospitals and blood centers.
By Application Insights
Blood Collection accounted for the largest share of 42.3% in 2025. Collection remains the highest-throughput stage because every downstream activity depends on reliable upfront blood draw and donation operations. Standard donation protocols, continuous donor engagement programs, and routine inpatient and outpatient phlebotomy volumes reinforce repeat use of collection sets and associated consumables. Providers also prefer products that improve speed and consistency, which supports adoption of user-friendly collection solutions in high-turnover settings.
By End User Insights
Hospitals accounted for the largest share of 46.8% in 2025. Hospitals lead because transfusion activity is closely tied to surgical procedures, trauma management, oncology care, and critical care pathways that require reliable access and administration readiness. Centralized procurement and protocol-driven transfusion services increase standardization of devices and consumables, supporting higher per-facility purchasing volumes. Hospitals also drive upgrades toward safer and more efficient workflows as they seek to reduce errors and improve component utilization.
Blood Transfusion Device Market Drivers
Rising transfusion-linked clinical workload across hospitals and specialty care
Clinical demand for transfusion support is sustained by procedure-intensive care pathways such as complex surgeries, trauma stabilization, oncology supportive care, and chronic anemia management. These settings require reliable availability of collection, processing, storage, and administration devices with consistent performance. Hospitals typically standardize transfusion protocols, which reinforces repeat demand for validated consumables and compatible accessories. As case volumes rise and clinical teams seek consistency, purchasing increasingly favors dependable products with established quality and supply continuity.
Ongoing modernization and automation of blood center processing workflows
Blood centers and high-volume hospital transfusion services continue to modernize component preparation to improve productivity and reduce manual variability. Automation and integrated processing systems are adopted to standardize yields, lower handling steps, and support consistent component quality. These investments typically increase pull-through for proprietary disposables and validated consumables tied to the installed base. Over time, modernization programs also accelerate replacement cycles as facilities upgrade legacy equipment to meet operational and compliance expectations.
- For instance, Terumo BCT reports that its Reveos system can separate 12 whole blood units into red blood cells, platelets, and plasma up to 24 minutes faster than semi-automated buffy coat processing, reduce hands-on steps by up to 65%, and scale to about 72,000 units annually with one operator using four devices.
Increasing emphasis on safety, standardization, and traceability in transfusion practice
Transfusion pathways are quality-sensitive, driving stronger emphasis on standardized devices and consumables that reduce process variability and support reliable documentation. Providers increasingly value closed or controlled handling systems, consistent labeling practices, and inventory discipline to reduce wastage and improve component availability. These requirements strengthen demand for compatible device ecosystems spanning collection, processing, and administration. Safety-driven procurement also supports adoption of improved access and collection solutions that lower risk and support consistent clinical execution.
- For instance, Haemonetics says its BloodTrack Tx software uses 2D barcode technology each time a specimen is collected, a product is requested, or a transfusion occurs, while its BloodTrack OnDemand with HaemoBank is positioned as a 24/7 virtual automated transfusion service to strengthen bedside verification and traceability.
Expanding healthcare capacity and access to surgical care in developing markets
In many developing markets, healthcare expansion increases the volume of surgeries and acute care services that require transfusion readiness, raising demand for both equipment and consumables. As blood banking infrastructure improves, procurement extends beyond basic supplies into more standardized processing and storage workflows. Public and private investments in hospital capacity also encourage the adoption of reliable transfusion-support devices aligned with modern protocols. This capacity-driven growth supports steady market expansion alongside mature-market replacement demand.
Blood Transfusion Device Market Challenges
Operational constraints remain a key barrier in transfusion workflows because blood collection and processing require trained staff, strict procedures, and reliable cold-chain handling. Shortages of skilled personnel can limit throughput and reduce the effective utilization of advanced processing systems, especially in smaller facilities. Budget constraints also slow replacement cycles when institutions prioritize immediate clinical needs over infrastructure modernization. Inconsistent donor supply patterns and collection logistics can further disrupt utilization planning and inventory stability.
Regulatory and quality compliance requirements create complexity for manufacturers and providers due to validation needs, documentation expectations, and traceability discipline across the transfusion chain. Hospitals and blood centers must maintain consistent quality controls, which can increase procurement scrutiny and lengthen product adoption timelines. Product standardization can also create switching friction because facilities prefer compatibility with established installed bases. Supply chain variability for specialized consumables can introduce procurement risk and encourage multi-sourcing strategies.
- For instance, Cerus’ INTERCEPT Blood System for Platelets has demonstrated more than 5.7 log10 reduction of viable T-cells, more than 6.3 log10 reduction for dengue virus in platelets suspended in plasma/additive solution, and more than 7.2 log10 reduction for Escherichia coli, while supporting platelet storage for up to 7 days at 20-24°C with continuous agitation.
Blood Transfusion Device Market Trends and Opportunities
Automation adoption continues to expand as blood centers and large hospitals pursue productivity gains and more consistent component preparation outputs. Facilities increasingly evaluate solutions that reduce manual handling, improve process standardization, and support repeatable quality performance at scale. This trend creates opportunities for integrated platforms that combine processing steps and strengthen workflow efficiency. Vendors that align offerings with operational metrics, training support, and service reliability can improve adoption in high-throughput settings.
- For instance, Terumo Blood and Cell Technologies states that its Reveos Automated Blood Processing System is the first whole-blood automation device commercially available in the U.S. to process whole blood into platelets and other components in a single centrifugation cycle, and the platform can process up to four whole-blood units in a single run; the company has also reported deployment of the system in 52 countries over the past decade, underscoring its relevance for high-throughput component labs.
Improved traceability and inventory management practices are gaining attention as providers seek to reduce component wastage and improve availability across transfusion services. Opportunities are emerging for solutions that support better tracking, standardized documentation, and smoother coordination across collection, processing, storage, and administration. Markets with expanding healthcare capacity also present growth pathways for scalable and standardized transfusion-support kits and accessories. Product designs that simplify clinician workflows and improve ease-of-use can strengthen differentiation in competitive tenders.
Regional Insights
North America
North America held 39.3% share in 2025, supported by mature blood center networks, high surgical volumes, and structured transfusion services in hospitals. Procurement in the region emphasizes safety, standardization, and compatibility with established processing and administration workflows. Replacement cycles are supported by continuous quality expectations and demand for operational efficiency in component preparation. Strong service infrastructure and consistent supply requirements favor vendors with reliable installed-base support and consumable availability.
Europe
Europe accounted for 28.1% share in 2025, supported by established healthcare systems and stringent blood safety and quality expectations. Facilities typically prioritize standardized component preparation, controlled handling, and reliable storage practices that support consistent quality outcomes. Replacement demand remains steady as institutions modernize transfusion services and improve workflow efficiency. Regional procurement often favors proven products and supplier credibility in quality assurance and long-term service support.
Asia Pacific
Asia Pacific captured 24.8% share in 2025, supported by expanding hospital capacity and growing adoption of standardized transfusion practices. Rising procedure volumes and strengthening blood bank infrastructure increase demand for collection, processing, and storage solutions. Investment in healthcare modernization supports uptake of more efficient systems in higher-volume centers, even as many facilities continue to scale from basic capabilities. Vendors that offer scalable product portfolios and training support are positioned to benefit from capacity-driven growth.
Latin America
Latin America represented 5.2% share in 2025, with demand shaped by gradual improvements in hospital infrastructure and transfusion service capabilities. Procurement often focuses on dependable consumables and essential equipment that supports consistent collection and administration. Market growth is influenced by capacity expansion, upgrades in blood bank practices, and wider adoption of standardized protocols. Supply reliability and cost effectiveness remain important selection factors for many buyers.
Middle East & Africa
Middle East & Africa held 2.6% share in 2025, reflecting uneven infrastructure maturity and varied blood banking capacity across countries. Demand is supported by selected investments in hospital expansion and improvements in transfusion readiness in tertiary care settings. Procurement typically concentrates on core collection, storage, and administration needs, with gradual movement toward standardized workflows where capacity allows. Long-term growth depends on broader infrastructure development, workforce capability, and consistent supply availability.
Competitive Landscape
Competition in the Blood Transfusion Device Market is driven by breadth of portfolio coverage across collection, processing, storage, and administration workflows, along with the ability to support reliability and standardization in high-throughput settings. Suppliers differentiate through integrated system offerings, consumable pull-through ecosystems, service and training support, and compatibility with established clinical protocols. Product design improvements that reduce handling steps, support traceability discipline, and improve ease-of-use help strengthen positioning in institutional procurement. Scale, quality assurance credibility, and supply continuity remain decisive factors in competitive tenders.
Fresenius Kabi / Fresenius SE & Co. KGaA is positioned as a broad healthcare supplier with strengths in transfusion-adjacent products and hospital-facing procurement channels, enabling cross-sell across related clinical workflows. The company’s approach typically emphasizes standardized, quality-aligned solutions that fit established hospital processes and support reliable clinical execution. Scale in manufacturing and distribution supports continuity for high-frequency consumables and accessories. This positioning aligns with buyer priorities for dependable supply, consistent product performance, and reduced operational disruption in transfusion services.
The industry research and growth report includes detailed analyses of the competitive landscape of the market and information about key companies, including:
- Fresenius Kabi / Fresenius SE & Co. KGaA
- Grifols, S.A.
- Terumo Corporation
- Immucor, Inc.
- B. Braun Melsungen AG
- BD (Becton, Dickinson and Company)
- Haemonetics Corporation
- Teleflex Incorporated
- Medtronic
- LivaNova PLC
- Redax
- Baxter International Inc.
- Kawasumi Laboratories, Inc.
- Kaneka Corporation
- Macopharma SA
- 3M Company
- Tenko International Group Corp
Qualitative and quantitative analysis of companies has been conducted to help clients understand the wider business environment as well as the strengths and weaknesses of key industry players. Data is qualitatively analyzed to categorize companies as pure play, category-focused, industry-focused, and diversified; it is quantitatively analyzed to categorize companies as dominant, leading, strong, tentative, and weak.
Recent Developments
- In March 2025, Grifols signed a strategic agreement with Inpeco to provide transfusion medicine laboratories with integrated instrumentation, robotics, and software to modernize workflows and improve efficiency.
- In June 2024, Innobiochips introduced Omnys, an advanced blood transfusion device designed to improve laboratory productivity and accuracy through multiplex analysis, including ABO/D typing and extended phenotyping. The company said the system helps streamline testing, reduce the number of wells required, and minimize waste in transfusion laboratories
Report Scope
| Report Attribute | Details |
| Market size value in 2025 | USD 5283.74 million |
| Revenue forecast in 2032 | USD 7757.84 million |
| Growth rate (CAGR) | 5.64% (2025–2032) |
| Base year | 2025 |
| Forecast period | 2026-2032 |
| Quantitative units | USD million |
| Segments covered | By Product Type; By Application; By End User |
| Regional scope | North America, Europe, Asia Pacific, Latin America, Middle East & Africa |
| Key companies profiled | 17 companies |
| No.of Pages | 326 |
Segmentation
By Product Type
- Pathogen reduction systems
- Apheresis devices
- Blood component separators
- Blood bags and accessories
- Venous access devices
- Autotransfusion systems, consumables, and accessories
By Application
- Blood Collection
- Blood Processing
- Blood Storage
- Blood Transfusion
By End User
- Hospitals
- Blood banks / blood centers
- Ambulatory surgical centers / specialty clinics
By Region
- North America
- U.S.
- Canada
- Mexico
- Europe
- Germany
- France
- U.K.
- Italy
- Spain
- Rest of Europe
- Asia Pacific
- China
- Japan
- India
- South Korea
- South-east Asia
- Rest of Asia Pacific
- Latin America
- Brazil
- Argentina
- Rest of Latin America
- Middle East & Africa
- GCC Countries
- South Africa
- Rest of the Middle East and Africa
Request a Free Sample
Fill in your details and we'll send you a free sample report.
- Sample data tables & charts
- Research methodology
Need a Custom Version of This Report?
Tailor the scope, geography, or segments to your exact requirements.
- Custom geography or segment scope
- Direct access to our analyst team
Frequently Asked Questions
What is the market size of the Blood Transfusion Device Market in 2025 and the forecast for 2032?
What is the CAGR of the Blood Transfusion Device Market during 2025–2032?
What is the largest product segment in 2025?
What factors are driving growth in the Blood Transfusion Device Market?
Who are the leading companies in the Blood Transfusion Device Market?
Which region leads the Blood Transfusion Device Market in 2025?
Table of Content
Chapter 1. Report Introduction
- 1.1 Report Description & Purpose
- 1.1.1 Report Title & Market Definition
- 1.1.2 Unique Selling Propositions (USP) & Key Differentiators
- 1.1.3 Value Proposition for Stakeholders
- 1.2 Research Objectives
- 1.2.1 Market Sizing Objectives (Volume & Revenue)
- 1.2.2 Segmentation Objectives
- 1.2.3 Competitive Intelligence Objectives
- 1.2.4 Forecast & Scenario Objectives
- 1.3 Report Scope
- 1.3.1 Blood Transfusion Device Scope – Types & Subtypes Covered
- 1.3.2 Geographic Scope – Regions & Countries Covered
- 1.3.3 Historical Period, Base Year & Forecast Period (2025; forecast to 2032)
- 1.3.4 Inclusions & Exclusions
- 1.4 HS Code & Classification Framework
- 1.5 Currency, Units & Pricing Basis
- 1.6 Target Stakeholders
- 1.7 Limitations & Assumptions
Chapter 2. Executive Summary
- 2.1 Global Blood Transfusion Device Market Snapshot
- 2.1.1 Market Size – Historical (2025) & Forecast (2025-2032) (2025: USD 5,283.74 million → 2032: USD 7,757.84 million)
- 2.1.2 Volume & Revenue – Global Totals
- 2.1.3 Key Market Highlights – Top Five Facts
- 2.2 Blood Transfusion Device Market Segmentation Snapshot
- 2.2.1 Market Split by Region – 2025 vs. 2032
- 2.3 Competitive Snapshot
- 2.3.1 Top 10 Players by Revenue Share – 2025
- 2.3.2 Top 10 Players by Volume Share – 2025
- 2.3.3 Recent Strategic Developments (18-Month Summary)
- 2.4 Key Investment Highlights & Strategic Conclusions
Chapter 3. Blood Transfusion Device Market Dynamics & Industry Analysis
- 3.1 Market Overview & Context
- 3.1.1 Blood Transfusion Device Market Position in the Broader Automotive Value Chain
- 3.1.2 OEM vs. Replacement Market Dynamics
- 3.1.3 Market Maturity & Development Stage by Region
- 3.2 Blood Transfusion Device Market Drivers
- 3.3 Blood Transfusion Device Market Restraints & Challenges
- 3.4 Blood Transfusion Device Market Opportunities
- 3.5 Porter's Five Forces Analysis
- 3.5.1 Threat of New Entrants
- 3.5.2 Bargaining Power of Suppliers
- 3.5.3 Bargaining Power of Buyers
- 3.5.4 Threat of Substitutes
- 3.5.5 Competitive Rivalry – Intensity Assessment
- 3.6 Blood Transfusion Device Value Chain Analysis
- 3.6.1 Upstream – Raw Material/Input Suppliers
- 3.6.1.1 Raw Material/Input 1
- 3.6.1.2 Raw Material/Input 2
- 3.6.1.3 Raw Material/Input 3
- 3.6.2 Midstream – Production/Manufacturing/Service Delivery
- 3.6.2.1 Production/Process Overview
- 3.6.2.2 Key Facility Locations & Capacity by Manufacturer
- 3.6.3 Downstream – Distribution & End Consumer
- 3.6.3.1 Primary Channel – B2B/OEM
- 3.6.3.2 Secondary Channels – Dealer, Retail, Online, Direct
- 3.6.4 Value Chain Profitability Analysis
- 3.6.1 Upstream – Raw Material/Input Suppliers
- 3.7 PESTEL Analysis
- 3.7.1 Political Factors
- 3.7.2 Economic Factors
- 3.7.3 Social Factors
- 3.7.4 Technological Factors
- 3.7.5 Environmental Factors
- 3.7.6 Legal Factors
- 3.8 Blood Transfusion Device Supply Chain Analysis
- 3.8.1 Raw Material/Input Supply Risk Assessment
- 3.8.2 Manufacturing Concentration Risk (Geographic Exposure)
- 3.8.3 Trade Disruption Impact Analysis
- 3.9 Regulatory & Policy Landscape
Note: The regulatory and policy landscape section covers regulations based on their applicability to the market, Blood Transfusion Device category, geography, and scope of the study. Only regulatory frameworks with a material impact on operations, compliance, trade, sustainability, or market access are analyzed in detail.
Chapter 4. Key Investment Pockets & Opportunity Analysis
- 4.1 Blood Transfusion Device Market Attractiveness Analysis
- 4.1.1 By Region – Investment Attractiveness Matrix (Volume × CAGR)
- 4.2 Absolute Revenue Growth Opportunity
- 4.2.1 By Region – Absolute USD Growth Through 2032
- 4.3 Incremental Volume Opportunity
- 4.3.1 By Region – Incremental Volume Through 2032
- 4.3.2 Segment – Incremental Volume
- 4.4 Emerging Submarket Opportunity Deep Dive (Subject to Applicability)
- 4.5 Emerging Market Opportunity Scorecards
- 4.5.1 United States
- 4.5.2 Europe
- 4.5.3 Asia
- 4.5.4 Middle East & Africa
Note: Emerging Market Opportunity Scorecards will be included based on relevance and strategic importance. Regions listed are indicative and may vary depending on data availability and market dynamics.
Chapter 5. Blood Transfusion Device Import-Export Analysis & Trade Flows
- 5.1 Global Trade Overview
- 5.1.1 Global Export Value by Country (2025)
- 5.1.2 Global Export Volume by Country (2025)
- 5.1.3 Global Import Value by Country (2025)
- 5.1.4 Global Import Volume by Country (2025)
- 5.1.5 Net Trade Balance by Country (2025)
- 5.2 Export Analysis – Segment
- 5.2.1 Type 1 (HS Code)
- 5.2.2 Type 2 (HS Code)
- 5.2.3 Type 3 (HS Code)
- 5.2.4 Type 4 (HS Code)
- 5.2.5 Type 5 (HS Code)
- 5.3 Import Analysis – Segment
- 5.3.1 Type 1 (HS Code)
- 5.3.2 Type 2 (HS Code)
- 5.3.3 Type 3 (HS Code)
- 5.3.4 Type 4 (HS Code)
- 5.3.5 Type 5 (HS Code)
- 5.4 Average Unit Trade Prices
- 5.4.1 Average Export Price – Segment & Country
- 5.4.2 Average Import Price – Segment & Source Country
- 5.4.3 Price Trends (2025)
- 5.5 Key Trade Route Analysis
- 5.5.1 Trade Route 1
- 5.5.2 Trade Route 2
- 5.5.3 Trade Route 3
- 5.5.4 Trade Route 4
- 5.5.5 Trade Route 5
- 5.6 Trade Policy Impact Assessment
- 5.6.1 US Anti-Dumping & Section 301 Tariffs
- 5.6.2 EU Customs Union Impact
- 5.6.3 Major Free Trade Agreements
- 5.6.4 USMCA Rules of Origin
Note: Trade policy analysis will be included only where relevant to the Blood Transfusion Device market.
Chapter 6. Competitive Landscape & Company Benchmarking
- 6.1 Blood Transfusion Device Market Concentration & Structure
- 6.1.1 Herfindahl-Hirschman Index (HHI) – vs. 2025
- 6.1.2 Tier 1, Tier 2 & Tier 3 Market Structure
- 6.1.3 Global, Regional & Local Player Dynamics
- 6.2 Blood Transfusion Device Market Share Analysis – 2025
- 6.2.1 Global Revenue Share by Company
- 6.2.2 Global Volume Share by Company
- 6.2.3 Regional Revenue Share
- 6.2.4 Market Share Evolution ( vs. 2025)
- 6.2.5 OEM Segment Share by Company
- 6.2.6 Replacement Segment Share by Company
- 6.3 Production/Delivery Capacity & Facility Analysis
- 6.3.1 Global Installed Capacity
- 6.3.2 Capacity Utilization Rates
- 6.3.3 Production/Output Volume
- 6.3.4 Facility Locations & Capacity Map
- 6.3.5 Planned Capacity Additions
- 6.4 Blood Transfusion Device Competitive Benchmarking Matrix
- 6.4.1 Revenue, Volume, CAGR & Profitability Comparison
- 6.4.2 Channel Revenue Mix
- 6.4.3 Geographic Revenue Exposure
- 6.4.4 R&D Intensity
- 6.4.5 Sustainability Maturity
- 6.5 Strategic Developments in Blood Transfusion Device (Last 24 Months)
- 6.5.1 Mergers, Acquisitions & Divestments
- 6.5.2 New Blood Transfusion Device Launches
- 6.5.3 Facility Expansions
- 6.5.4 Strategic Alliances, Joint Ventures & Partnerships
- 6.5.5 Distribution Expansion & Market Entry
- 6.5.6 Sustainability & ESG Initiatives
- 6.6 Competitive Strategy Mapping
- 6.6.1 Leader, Challenger, Follower & Niche Classification
- 6.6.2 Pricing Strategy Comparison
- 6.6.3 Channel Strategy Matrix
Note: Strategic developments are included based on their materiality and the availability of reliable information.
Chapter 7. Global Blood Transfusion Device Market – By Distribution Channel
- 7.1 Segment Overview
- 7.1.1 Volume & Revenue Split by Channel (2025 & 2032)
- 7.1.2 Channel Mix Evolution (2025-2032)
Chapter 8. Regional Market Analysis – Global Overview
- 8.1 Global Regional Overview
- 8.1.1 Regional Volume Share
- 8.1.2 Regional Revenue Share
- 8.1.3 Regional Volume by Region
- 8.1.4 Regional Revenue by Region
- 8.1.5 Regional Forecast Through 2032
- 8.2 Cross-Regional Segment Analysis
- 8.2.1 By Distribution Channel
- 8.2.2 By Brand/Price Tier
Chapter 9. North America Blood Transfusion Device Market
- 9.1 United States
- 9.2 Canada
- 9.3 Mexico
Chapter 10. Europe Blood Transfusion Device Market
- 10.1 Germany
- 10.2 France
- 10.3 Italy
- 10.4 United Kingdom
- 10.5 Spain
- 10.6 Poland
- 10.7 Russia
- 10.8 Netherlands
- 10.9 Belgium
- 10.10 Sweden
- 10.11 Denmark
- 10.12 Norway
- 10.13 Rest of Europe
Chapter 11. Asia Pacific Blood Transfusion Device Market
- 11.1 China
- 11.2 India
- 11.3 Japan
- 11.4 South Korea
- 11.5 Thailand
- 11.6 Indonesia
- 11.7 Vietnam
- 11.8 Malaysia
- 11.9 Australia
- 11.10 Rest of Asia Pacific
Chapter 12. Latin America Blood Transfusion Device Market
- 12.1 Brazil
- 12.2 Argentina
- 12.3 Colombia
- 12.4 Chile
- 12.5 Rest of Latin America
Chapter 13. Middle East Blood Transfusion Device Market
- 13.1 Saudi Arabia
- 13.2 United Arab Emirates
- 13.3 Turkey
- 13.4 Israel
- 13.5 Iran
- 13.6 Rest of the Middle East
Chapter 14. Africa Blood Transfusion Device Market
- 14.1 South Africa
- 14.2 Egypt
- 14.3 Nigeria
- 14.4 Morocco
- 14.5 Rest of Africa
Chapter 15. Blood Transfusion Device Company Profiles
- 15.1 [Company 01]
- 15.1.1 Company Overview
- 15.1.2 Key Management Personnel
- 15.1.3 Products & Services Portfolio
- 15.1.4 Financial Performance
- 15.1.5 Key Market Focus & Geographic Presence
- 15.1.6 Recent Developments & Strategic Initiatives
Note: The company profile list is preliminary and may change based on research findings, market developments, data availability, and client requirements.
Chapter 16. Appendices
- Appendix A – List of Abbreviations & Acronyms
- Appendix B – Industry Classification Code Reference – Full Series
- Appendix C – Production & Capacity Data Tables
- Appendix D – End-Use & Demand Base Tables
- Appendix E – Consumption & Replacement Rate Assumptions
- Appendix F – ASP Reference Tables
- Appendix G – Manufacturing & Facility Database
- Appendix H – Import-Export Data Tables
- Appendix I – Regulatory Summary Tables
- Appendix J – Primary Research Participant List (Anonymized)
- Appendix K – Primary Research Questionnaire Framework
- Appendix L – Data Sources & Bibliography
- Appendix M – Market Size Divergence & Source Comparison
Chapter 17. Research Methodology
- 17.1 Research Framework & Philosophy
- 17.2 Secondary Research – Sources, Hierarchy & Data Extraction
- 17.3 Data Modeling – Bottom-Up & Top-Down Market Sizing
- 17.4 Primary Research – Stakeholder Framework, LOI & Sample Sizes
- 17.5 Forecast Methodology – Regression, Scenario & Sensitivity Analysis
- 17.6 Quality Control – Four-Layer Validation Framework
- 17.7 Limitations & Standard Assumptions
- 17.8 Disclaimer
