
Brain Mapping Instruments Market
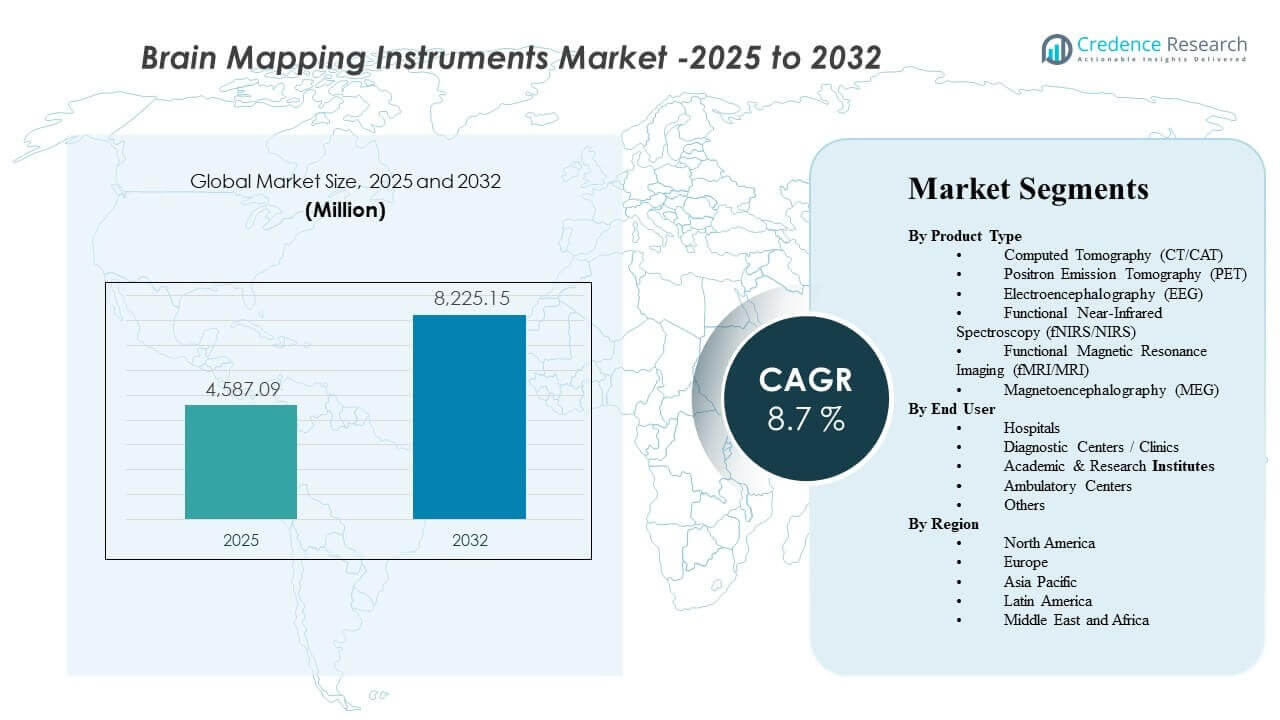
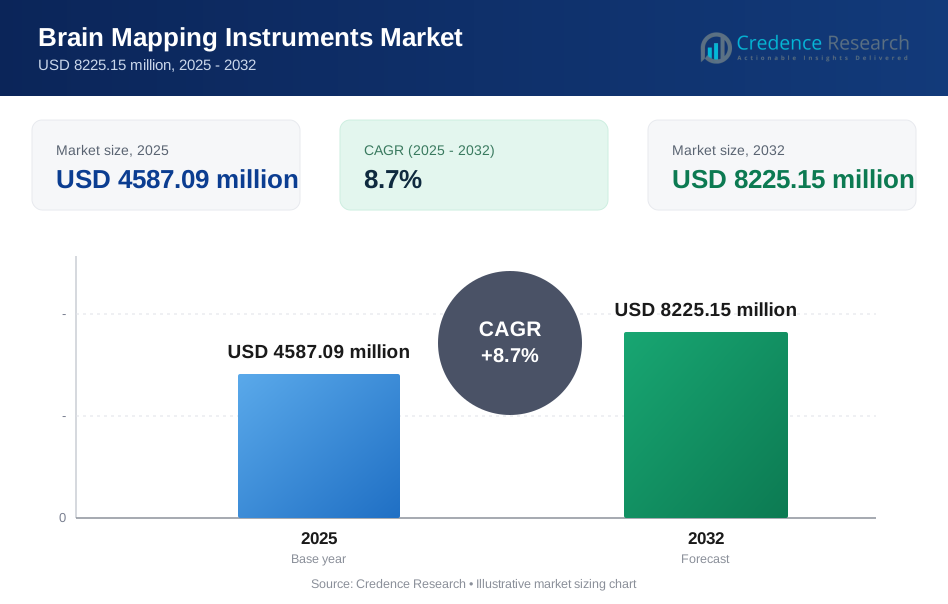
The global Brain Mapping Instruments Market size was estimated at USD 4587.09 million in 2025 and is expected to reach USD 8225.15 million by 2032, growing at a CAGR of 8.7% from 2025 to 2032. Growth is primarily driven by the rising clinical and research need to detect, localize, and monitor neurological disorders using non-invasive and high-resolution imaging and neurodiagnostic modalities. Increasing adoption of advanced neuroimaging workflows across hospitals and diagnostic networks further supports steady demand across major regions.
| REPORT ATTRIBUTE | DETAILS |
|---|---|
| Historical Period | 2020-2024 |
| Base Year | 2025 |
| Forecast Period | 2026-2032 |
| Brain Mapping Instruments Market Size 2025 | USD 4587.09 million |
| Brain Mapping Instruments Market, CAGR | 8.7% |
| Brain Mapping Instruments Market Size 2032 | USD 8225.15 million |
Key Market Trends & Insights
- Computed Tomography (CT/CAT) accounted for the largest product share of 21.5% in 2025.
- North America held the largest regional share of 30.2% in 2025.
- Europe represented 26.6% share in 2025, supported by mature imaging infrastructure and neurodiagnostics access.
- Asia Pacific accounted for 25.9% share in 2025, reflecting expanding diagnosis capacity and growing neurology workloads.
- The market is projected to expand at a CAGR of 8.7% during 2025–2032, indicating sustained multi-year adoption momentum.
Segment Analysis
Brain mapping instrument demand is shaped by the need to convert neurological symptoms into actionable diagnostic and monitoring pathways across clinical care and neuroscience research. Modalities that offer fast workflows and broad availability continue to anchor routine neurological assessment, while higher-complexity systems gain relevance in specialized centers where deeper functional and physiological mapping is required. Purchasing decisions typically weigh clinical utility, scan or test throughput, integration with hospital IT, and the availability of trained operators across settings.
Product demand is also supported by expanding neurodiagnostics use beyond tertiary hospitals into distributed diagnostic networks. As outpatient imaging volumes increase, diagnostic centers and clinics contribute to a growing installed base, especially for modalities with predictable utilization patterns. In parallel, academic and research institutes support advanced applications such as cognitive studies and brain-function mapping where analytical software and data quality are critical to outcomes.
By Product Type Insights
Computed Tomography (CT/CAT) accounted for the largest share of 21.5% in 2025. CT/CAT leads due to its widespread installed base, rapid workflow suitability, and strong fit for structural assessment in routine neurological pathways. The modality’s operational efficiency supports consistent utilization in high-throughput settings. Broad availability across hospital tiers also sustains recurring upgrades and replacement cycles.
By End User Insights
Hospitals represent a central demand base for brain mapping instruments due to their role in comprehensive neurology pathways and access to multi-modality imaging infrastructure. Diagnostic centers and clinics expand adoption where outpatient imaging volumes and referral networks support stable utilization. Academic and research institutes contribute demand for advanced neuroscience applications, where analytical capability and data integrity are key buying criteria. Ambulatory centers and other settings increasingly adopt targeted neurodiagnostic tools as care delivery becomes more distributed.
Brain Mapping Instruments Market Drivers
Rising neurological disease diagnosis and monitoring needs
Neurological disorders require accurate localization, monitoring, and treatment planning, which supports sustained demand for brain mapping modalities. Providers increasingly prioritize diagnostic certainty and measurable outcomes in neurology pathways. This expands routine use cases for imaging and neurodiagnostic systems across acute and non-acute settings. Demand also rises as patient pathways become more protocol-driven and imaging-supported. In addition, earlier screening and longitudinal follow-up programs increase repeat testing volumes, supporting steady utilization over time.
- For instance, Hyperfine reported that its next-generation Swoop portable MRI identified ischemic lesions as small as 2.8 mm (0.15 mL), achieved 100% sensitivity and 100% specificity for lesions larger than 1.0 mL, and reduced scan times by approximately 30%, highlighting how improved neuroimaging performance can strengthen early diagnosis and follow-up monitoring pathways.
Technology upgrades improving usability and throughput
Instrument vendors continue to enhance workflow efficiency through software improvements, better data handling, and operator support features. These upgrades improve throughput and reduce repeat procedures in high-volume environments. Facilities are more likely to invest when improved performance translates to operational efficiency. Technology refresh cycles therefore contribute to ongoing replacement demand. AI-assisted reconstruction, automation, and smarter interfaces also reduce operator burden and help standardize output quality across sites.
- For instance, GE HealthCare states that AIR Recon DL can reduce MRI scan times by up to 50%, and its published case data show a shoulder exam declining from 12:49 to 6:38 and a lumbar spine exam from 11:04 to 6:44, demonstrating how AI-based reconstruction can deliver measurable throughput gains.
Expansion of diagnostic networks beyond tertiary hospitals
Neurodiagnostic services are increasingly distributed across diagnostic centers, clinics, and networked care models. This expands installed base requirements across multiple sites rather than concentrating demand in a few large hospitals. Growth in outpatient imaging and referral networks supports higher equipment counts. Service and maintenance ecosystems also expand with this footprint. As networks scale, procurement increasingly favors platform standardization to simplify training, service coverage, and data interoperability.
Growth in research activity and neuroscience applications
Academic and research institutes continue to rely on brain mapping tools for neuroscience studies, cognitive research, and translational work. Research needs emphasize data quality, reproducibility, and analytical capability. This strengthens demand for specialized systems and associated analysis software. Collaborative research models also support broader deployment across institutions. Rising clinical trial activity in neurology further supports demand for repeatable imaging and signal-based endpoints in study protocols.
Brain Mapping Instruments Market Challenges
High-capex modalities require significant upfront investment, which can slow adoption among smaller facilities and in cost-constrained healthcare systems. Budget cycles and procurement scrutiny are often intensified when utilization forecasts are uncertain. Facilities also evaluate total cost of ownership, including service contracts and downtime risks, which can delay purchase decisions. As a result, upgrades may be prioritized over net-new installations in some settings. In many cases, reimbursement variability and payor documentation requirements also influence purchasing decisions and timing.
Operational complexity and workforce constraints can also limit effective utilization. Advanced brain mapping modalities may require specialized training, standardized protocols, and consistent quality control. Variability in operator expertise can influence performance outcomes and throughput. These constraints can reduce realized ROI and slow adoption outside leading centers. Shortages of technologists, neurophysiology staff, and imaging specialists can also increase scheduling backlogs and reduce system utilization rates.
- For instance, Philips reports that its SmartSpeed MRI technology can enable up to 3x faster scanning, up to 65% higher resolution, and applicability across 97% of clinical protocols, highlighting how vendors are using AI-enabled performance gains to help address throughput pressure and staffing limitations in neuroimaging workflows.
Brain Mapping Instruments Market Trends and Opportunities
Growing preference for non-invasive and patient-friendly diagnostic approaches supports broader adoption of brain mapping tools across care settings. Providers increasingly favor modalities and workflows that reduce procedure burden while maintaining diagnostic confidence. This trend strengthens demand for systems that enable efficient assessment and follow-up monitoring. It also supports expansion into outpatient and distributed service models. Portable and lower-footprint solutions are also gaining attention where they can extend access without major infrastructure expansion.
Opportunities also exist in improving the end-to-end neurodiagnostic workflow through better integration of acquisition, analysis, and reporting. Facilities seek streamlined data management and consistent reporting to reduce interpretation variability. Vendors that support interoperability and clinical usability can expand share within procurement decisions. This is particularly relevant for networks operating across multiple sites. Integrated platforms that connect imaging, EEG/MEG data, and decision support can further differentiate vendors by improving clinical turnaround time and consistency.
- For instance, Compumedics Neuroscan’s FDA-cleared and CE-marked CURRY platform integrates EEG and MEG with MRI, CT, PET, SPECT, fMRI, and DTI, and its configurations scale from 48 EEG channels at 4 kHz to 512 EEG channels at 20 kHz, supporting standardized multi-modality review and reporting across complex neurodiagnostic workflows.
Regional Insights
North America
North America held 30.2% share in 2025, supported by strong diagnostic intensity and broad availability of advanced imaging infrastructure. The region’s established neurology pathways sustain consistent utilization across major modalities. Provider focus on measurable outcomes and standardized care pathways supports routine adoption. Replacement cycles and upgrades also remain an important demand contributor.
Europe
Europe accounted for 26.6% share in 2025, reflecting mature imaging ecosystems and broad access across public and private healthcare settings. The region benefits from established clinical protocols and continued modernization of diagnostic capabilities. Demand is reinforced by hospital-based utilization and networked diagnostic services. Procurement decisions often emphasize operational efficiency and lifecycle value.
Asia Pacific
Asia Pacific represented 25.9% share in 2025, driven by expanding diagnostic capacity and rising neurology workloads. Growing healthcare access and improving clinical infrastructure support broader adoption across large population centers. The region also benefits from increasing utilization of diagnostic networks beyond major hospitals. Demand expansion is supported by both clinical and research use cases.
Latin America
Latin America held 10.4% share in 2025, supported by gradual improvements in diagnostic access and selective investments in imaging infrastructure. Urban centers and private diagnostic providers typically lead adoption. Growth is reinforced as referral networks expand and outpatient diagnostics gain traction. Adoption remains sensitive to budget cycles and facility-level ROI constraints.
Middle East & Africa
Middle East & Africa accounted for 6.9% share in 2025, supported by tertiary hospital expansion and targeted modernization of diagnostic services in higher-investment markets. Demand is typically concentrated in large hospitals and specialized centers. Growth is supported by capacity additions and gradual upgrades in neurodiagnostic capability. Market expansion remains uneven due to infrastructure and workforce variability across countries.
Competitive Landscape
Competition in the Brain Mapping Instruments Market is shaped by portfolio breadth, clinical workflow integration, service coverage, and the ability to support multi-modality demand across hospitals, diagnostic centers, and research institutions. Companies differentiate through modality performance, analytical software capability, installed base strength, and integration with clinical reporting workflows. Strategic priorities often include expanding neuro-focused product offerings, improving usability for distributed care models, and strengthening post-sale support to protect lifecycle value.
GE HealthCare maintains a strong position through broad imaging portfolio coverage and continued emphasis on improving clinical workflows and usability for neuroimaging environments. The company’s approach typically focuses on supporting scalable deployment across large provider networks and enhancing diagnostic decision support. Continued product enhancement and integration-friendly solutions strengthen competitiveness in high-throughput settings. Service reach and lifecycle support remain important factors in sustaining customer retention.
The industry research and growth report includes detailed analyses of the competitive landscape of the market and information about key companies, including:
- GE HealthCare
- Koninklijke Philips N.V.
- Siemens Healthineers
- Natus Medical Incorporated
- Nihon Kohden Corporation
- Compumedics Limited
- Canon Medical Systems Corporation
- Advanced Brain Monitoring, Inc.
- Brain Products GmbH
- NIRx Medical Technologies, LLC
- BrainScope Company, Inc.
Qualitative and quantitative analysis of companies has been conducted to help clients understand the wider business environment as well as the strengths and weaknesses of key industry players. Data is qualitatively analyzed to categorize companies as pure play, category-focused, industry-focused, and diversified; it is quantitatively analyzed to categorize companies as dominant, leading, strong, tentative, and weak.
Recent Developments
- In January 2026, Medtronic and Precision Neuroscience announced a strategic partnership to integrate Precision’s Layer 7 cortical interface with Medtronic’s StealthStation surgical navigation system for real-time functional brain mapping in neurosurgery. The collaboration is intended to combine functional and structural brain data in the operating room and improve intraoperative decision-making for surgeons.
- In February 2025, MEGIN and MYndspan announced a partnership to make high-precision MEG brain scans more widely available, beginning with consumer-accessible scanning services in London. MEGIN said the collaboration expands the reach of its functional brain mapping technology beyond traditional research and hospital settings into broader brain health applications.
- In June 2025, BrainScope announced the launch of its next-generation deep learning platform to strengthen its AI-enabled EEG capabilities for concussion, stroke, and early Alzheimer’s assessment. The company said the new platform enhances automated EEG analysis and could broaden use across clinical care, research, and biopharma.
- In May 2025, Compumedics announced a major product milestone for its Orion LifeSpan MEG system after achieving the first high-quality adult and child optimized recordings from a single MEG platform at Tianjin Normal University in China. Compumedics said the Orion LifeSpan system combines dual-helmet brain scanning capability with its CURRY brain analytics software, reinforcing its position in advanced functional neuroimaging and brain mapping.
Report Scope
| Report Attribute | Details |
| Market size value in 2025 | USD 4587.09 million |
| Revenue forecast in 2032 | USD 8225.15 million |
| Growth rate (CAGR) | 8.7% (2025–2032) |
| Base year | 2025 |
| Forecast period | 2026-2032 |
| Quantitative units | USD million |
| Segments covered | By Product Type, By End User |
| Regional scope | North America, Europe, Asia Pacific, Latin America, Middle East & Africa |
| Key companies profiled | GE HealthCare, Koninklijke Philips N.V., Siemens Healthineers, Natus Medical Incorporated, Nihon Kohden Corporation, Compumedics Limited, Canon Medical Systems Corporation, Advanced Brain Monitoring, Inc., Brain Products GmbH, NIRx Medical Technologies, LLC, BrainScope Company, Inc. |
| No.of Pages | 325 |
Segmentation
By Product Type
- Computed Tomography (CT/CAT)
- Positron Emission Tomography (PET)
- Electroencephalography (EEG)
- Functional Near-Infrared Spectroscopy (fNIRS/NIRS)
- Functional Magnetic Resonance Imaging (fMRI/MRI)
- Magnetoencephalography (MEG)
By End User
- Hospitals
- Diagnostic Centers / Clinics
- Academic & Research Institutes
- Ambulatory Centers
- Others
By Region
- North America
- U.S.
- Canada
- Mexico
- Europe
- Germany
- France
- U.K.
- Italy
- Spain
- Rest of Europe
- Asia Pacific
- China
- Japan
- India
- South Korea
- South-east Asia
- Rest of Asia Pacific
- Latin America
- Brazil
- Argentina
- Rest of Latin America
- Middle East & Africa
- GCC Countries
- South Africa
- Rest of the Middle East and Africa
Request a Free Sample
Fill in your details and we'll send you a free sample report.
- Sample data tables & charts
- Research methodology
Need a Custom Version of This Report?
Tailor the scope, geography, or segments to your exact requirements.
- Custom geography or segment scope
- Direct access to our analyst team
Frequently Asked Questions
What is the market size and forecast for the Brain Mapping Instruments Market?
What is the CAGR for the Brain Mapping Instruments Market?
What is the largest product segment in 2025?
What are the key factors driving market growth?
Who are the leading companies in the market?
Which region leads the market in 2025?
Table of Content
Chapter 1. Report Introduction
- 1.1 Report Description & Purpose
- 1.1.1 Report Title & Market Definition
- 1.1.2 Unique Selling Propositions (USP) & Key Differentiators
- 1.1.3 Value Proposition for Stakeholders
- 1.2 Research Objectives
- 1.2.1 Market Sizing Objectives (Volume & Revenue)
- 1.2.2 Segmentation Objectives
- 1.2.3 Competitive Intelligence Objectives
- 1.2.4 Forecast & Scenario Objectives
- 1.3 Report Scope
- 1.3.1 Brain Mapping Instruments Scope – Types & Subtypes Covered
- 1.3.2 Geographic Scope – Regions & Countries Covered
- 1.3.3 Historical Period, Base Year & Forecast Period (2025; forecast to 2032)
- 1.3.4 Inclusions & Exclusions
- 1.4 HS Code & Classification Framework
- 1.5 Currency, Units & Pricing Basis
- 1.6 Target Stakeholders
- 1.7 Limitations & Assumptions
Chapter 2. Executive Summary
- 2.1 Global Brain Mapping Instruments Market Snapshot
- 2.1.1 Market Size – Historical (2025) & Forecast (2025-2032) (2025: USD 4587.09 million → 2032: USD 8225.15 million)
- 2.1.2 Volume & Revenue – Global Totals
- 2.1.3 Key Market Highlights – Top Five Facts
- 2.2 Brain Mapping Instruments Market Segmentation Snapshot
- 2.2.1 Market Split by Region – 2025 vs. 2032
- 2.3 Competitive Snapshot
- 2.3.1 Top 10 Players by Revenue Share – 2025
- 2.3.2 Top 10 Players by Volume Share – 2025
- 2.3.3 Recent Strategic Developments (18-Month Summary)
- 2.4 Key Investment Highlights & Strategic Conclusions
Chapter 3. Brain Mapping Instruments Market Dynamics & Industry Analysis
- 3.1 Market Overview & Context
- 3.1.1 Brain Mapping Instruments Market Position in the Broader Automotive Value Chain
- 3.1.2 OEM vs. Replacement Market Dynamics
- 3.1.3 Market Maturity & Development Stage by Region
- 3.2 Brain Mapping Instruments Market Drivers
- 3.3 Brain Mapping Instruments Market Restraints & Challenges
- 3.4 Brain Mapping Instruments Market Opportunities
- 3.5 Porter's Five Forces Analysis
- 3.5.1 Threat of New Entrants
- 3.5.2 Bargaining Power of Suppliers
- 3.5.3 Bargaining Power of Buyers
- 3.5.4 Threat of Substitutes
- 3.5.5 Competitive Rivalry – Intensity Assessment
- 3.6 Brain Mapping Instruments Value Chain Analysis
- 3.6.1 Upstream – Raw Material/Input Suppliers
- 3.6.1.1 Raw Material/Input 1
- 3.6.1.2 Raw Material/Input 2
- 3.6.1.3 Raw Material/Input 3
- 3.6.2 Midstream – Production/Manufacturing/Service Delivery
- 3.6.2.1 Production/Process Overview
- 3.6.2.2 Key Facility Locations & Capacity by Manufacturer
- 3.6.3 Downstream – Distribution & End Consumer
- 3.6.3.1 Primary Channel – B2B/OEM
- 3.6.3.2 Secondary Channels – Dealer, Retail, Online, Direct
- 3.6.4 Value Chain Profitability Analysis
- 3.6.1 Upstream – Raw Material/Input Suppliers
- 3.7 PESTEL Analysis
- 3.7.1 Political Factors
- 3.7.2 Economic Factors
- 3.7.3 Social Factors
- 3.7.4 Technological Factors
- 3.7.5 Environmental Factors
- 3.7.6 Legal Factors
- 3.8 Brain Mapping Instruments Supply Chain Analysis
- 3.8.1 Raw Material/Input Supply Risk Assessment
- 3.8.2 Manufacturing Concentration Risk (Geographic Exposure)
- 3.8.3 Trade Disruption Impact Analysis
- 3.9 Regulatory & Policy Landscape
Note: The regulatory and policy landscape section covers regulations based on their applicability to the market, Brain Mapping Instruments category, geography, and scope of the study. Only regulatory frameworks with a material impact on operations, compliance, trade, sustainability, or market access are analyzed in detail.
Chapter 4. Key Investment Pockets & Opportunity Analysis
- 4.1 Brain Mapping Instruments Market Attractiveness Analysis
- 4.1.1 By Region – Investment Attractiveness Matrix (Volume × CAGR)
- 4.2 Absolute Revenue Growth Opportunity
- 4.2.1 By Region – Absolute USD Growth Through 2032
- 4.3 Incremental Volume Opportunity
- 4.3.1 By Region – Incremental Volume Through 2032
- 4.3.2 Segment – Incremental Volume
- 4.4 Emerging Submarket Opportunity Deep Dive (Subject to Applicability)
- 4.5 Emerging Market Opportunity Scorecards
- 4.5.1 United States
- 4.5.2 Europe
- 4.5.3 Asia
- 4.5.4 Middle East & Africa
Note: Emerging Market Opportunity Scorecards will be included based on relevance and strategic importance. Regions listed are indicative and may vary depending on data availability and market dynamics.
Chapter 5. Brain Mapping Instruments Import-Export Analysis & Trade Flows
- 5.1 Global Trade Overview
- 5.1.1 Global Export Value by Country (2025)
- 5.1.2 Global Export Volume by Country (2025)
- 5.1.3 Global Import Value by Country (2025)
- 5.1.4 Global Import Volume by Country (2025)
- 5.1.5 Net Trade Balance by Country (2025)
- 5.2 Export Analysis – Segment
- 5.2.1 Type 1 (HS Code)
- 5.2.2 Type 2 (HS Code)
- 5.2.3 Type 3 (HS Code)
- 5.2.4 Type 4 (HS Code)
- 5.2.5 Type 5 (HS Code)
- 5.3 Import Analysis – Segment
- 5.3.1 Type 1 (HS Code)
- 5.3.2 Type 2 (HS Code)
- 5.3.3 Type 3 (HS Code)
- 5.3.4 Type 4 (HS Code)
- 5.3.5 Type 5 (HS Code)
- 5.4 Average Unit Trade Prices
- 5.4.1 Average Export Price – Segment & Country
- 5.4.2 Average Import Price – Segment & Source Country
- 5.4.3 Price Trends (2025)
- 5.5 Key Trade Route Analysis
- 5.5.1 Trade Route 1
- 5.5.2 Trade Route 2
- 5.5.3 Trade Route 3
- 5.5.4 Trade Route 4
- 5.5.5 Trade Route 5
- 5.6 Trade Policy Impact Assessment
- 5.6.1 US Anti-Dumping & Section 301 Tariffs
- 5.6.2 EU Customs Union Impact
- 5.6.3 Major Free Trade Agreements
- 5.6.4 USMCA Rules of Origin
Note: Trade policy analysis will be included only where relevant to the Brain Mapping Instruments market.
Chapter 6. Competitive Landscape & Company Benchmarking
- 6.1 Brain Mapping Instruments Market Concentration & Structure
- 6.1.1 Herfindahl-Hirschman Index (HHI) – vs. 2025
- 6.1.2 Tier 1, Tier 2 & Tier 3 Market Structure
- 6.1.3 Global, Regional & Local Player Dynamics
- 6.2 Brain Mapping Instruments Market Share Analysis – 2025
- 6.2.1 Global Revenue Share by Company
- 6.2.2 Global Volume Share by Company
- 6.2.3 Regional Revenue Share
- 6.2.4 Market Share Evolution ( vs. 2025)
- 6.2.5 OEM Segment Share by Company
- 6.2.6 Replacement Segment Share by Company
- 6.3 Production/Delivery Capacity & Facility Analysis
- 6.3.1 Global Installed Capacity
- 6.3.2 Capacity Utilization Rates
- 6.3.3 Production/Output Volume
- 6.3.4 Facility Locations & Capacity Map
- 6.3.5 Planned Capacity Additions
- 6.4 Brain Mapping Instruments Competitive Benchmarking Matrix
- 6.4.1 Revenue, Volume, CAGR & Profitability Comparison
- 6.4.2 Channel Revenue Mix
- 6.4.3 Geographic Revenue Exposure
- 6.4.4 R&D Intensity
- 6.4.5 Sustainability Maturity
- 6.5 Strategic Developments in Brain Mapping Instruments (Last 24 Months)
- 6.5.1 Mergers, Acquisitions & Divestments
- 6.5.2 New Brain Mapping Instruments Launches
- 6.5.3 Facility Expansions
- 6.5.4 Strategic Alliances, Joint Ventures & Partnerships
- 6.5.5 Distribution Expansion & Market Entry
- 6.5.6 Sustainability & ESG Initiatives
- 6.6 Competitive Strategy Mapping
- 6.6.1 Leader, Challenger, Follower & Niche Classification
- 6.6.2 Pricing Strategy Comparison
- 6.6.3 Channel Strategy Matrix
Note: Strategic developments are included based on their materiality and the availability of reliable information.
Chapter 7. Global Brain Mapping Instruments Market – By Distribution Channel
- 7.1 Segment Overview
- 7.1.1 Volume & Revenue Split by Channel (2025 & 2032)
- 7.1.2 Channel Mix Evolution (2025-2032)
Chapter 8. Regional Market Analysis – Global Overview
- 8.1 Global Regional Overview
- 8.1.1 Regional Volume Share
- 8.1.2 Regional Revenue Share
- 8.1.3 Regional Volume by Region
- 8.1.4 Regional Revenue by Region
- 8.1.5 Regional Forecast Through 2032
- 8.2 Cross-Regional Segment Analysis
- 8.2.1 By Distribution Channel
- 8.2.2 By Brand/Price Tier
Chapter 9. North America Brain Mapping Instruments Market
- 9.1 United States
- 9.2 Canada
- 9.3 Mexico
Chapter 10. Europe Brain Mapping Instruments Market
- 10.1 Germany
- 10.2 France
- 10.3 Italy
- 10.4 United Kingdom
- 10.5 Spain
- 10.6 Poland
- 10.7 Russia
- 10.8 Netherlands
- 10.9 Belgium
- 10.10 Sweden
- 10.11 Denmark
- 10.12 Norway
- 10.13 Rest of Europe
Chapter 11. Asia Pacific Brain Mapping Instruments Market
- 11.1 China
- 11.2 India
- 11.3 Japan
- 11.4 South Korea
- 11.5 Thailand
- 11.6 Indonesia
- 11.7 Vietnam
- 11.8 Malaysia
- 11.9 Australia
- 11.10 Rest of Asia Pacific
Chapter 12. Latin America Brain Mapping Instruments Market
- 12.1 Brazil
- 12.2 Argentina
- 12.3 Colombia
- 12.4 Chile
- 12.5 Rest of Latin America
Chapter 13. Middle East Brain Mapping Instruments Market
- 13.1 Saudi Arabia
- 13.2 United Arab Emirates
- 13.3 Turkey
- 13.4 Israel
- 13.5 Iran
- 13.6 Rest of the Middle East
Chapter 14. Africa Brain Mapping Instruments Market
- 14.1 South Africa
- 14.2 Egypt
- 14.3 Nigeria
- 14.4 Morocco
- 14.5 Rest of Africa
Chapter 15. Brain Mapping Instruments Company Profiles
- 15.1 [Company 01]
- 15.1.1 Company Overview
- 15.1.2 Key Management Personnel
- 15.1.3 Products & Services Portfolio
- 15.1.4 Financial Performance
- 15.1.5 Key Market Focus & Geographic Presence
- 15.1.6 Recent Developments & Strategic Initiatives
Note: The company profile list is preliminary and may change based on research findings, market developments, data availability, and client requirements.
Chapter 16. Appendices
- Appendix A – List of Abbreviations & Acronyms
- Appendix B – Industry Classification Code Reference – Full Series
- Appendix C – Production & Capacity Data Tables
- Appendix D – End-Use & Demand Base Tables
- Appendix E – Consumption & Replacement Rate Assumptions
- Appendix F – ASP Reference Tables
- Appendix G – Manufacturing & Facility Database
- Appendix H – Import-Export Data Tables
- Appendix I – Regulatory Summary Tables
- Appendix J – Primary Research Participant List (Anonymized)
- Appendix K – Primary Research Questionnaire Framework
- Appendix L – Data Sources & Bibliography
- Appendix M – Market Size Divergence & Source Comparison
Chapter 17. Research Methodology
- 17.1 Research Framework & Philosophy
- 17.2 Secondary Research – Sources, Hierarchy & Data Extraction
- 17.3 Data Modeling – Bottom-Up & Top-Down Market Sizing
- 17.4 Primary Research – Stakeholder Framework, LOI & Sample Sizes
- 17.5 Forecast Methodology – Regression, Scenario & Sensitivity Analysis
- 17.6 Quality Control – Four-Layer Validation Framework
- 17.7 Limitations & Standard Assumptions
- 17.8 Disclaimer
