
Brain Monitoring Market Overview:
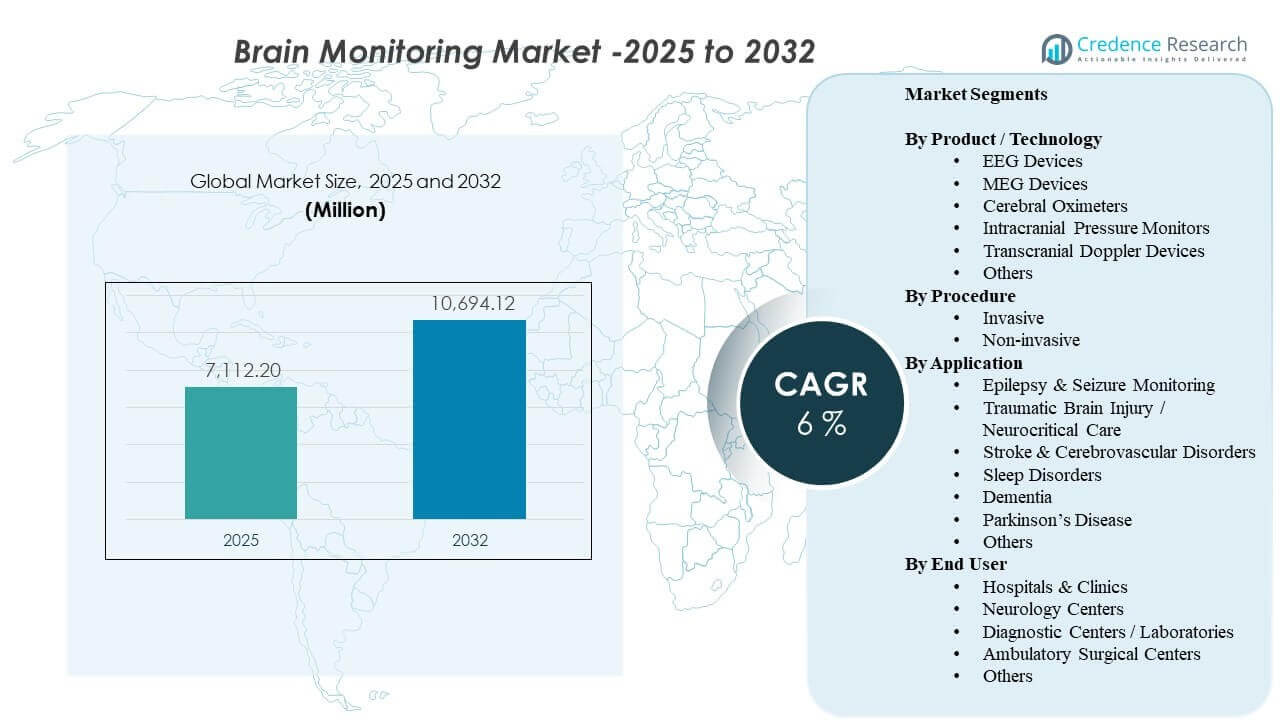
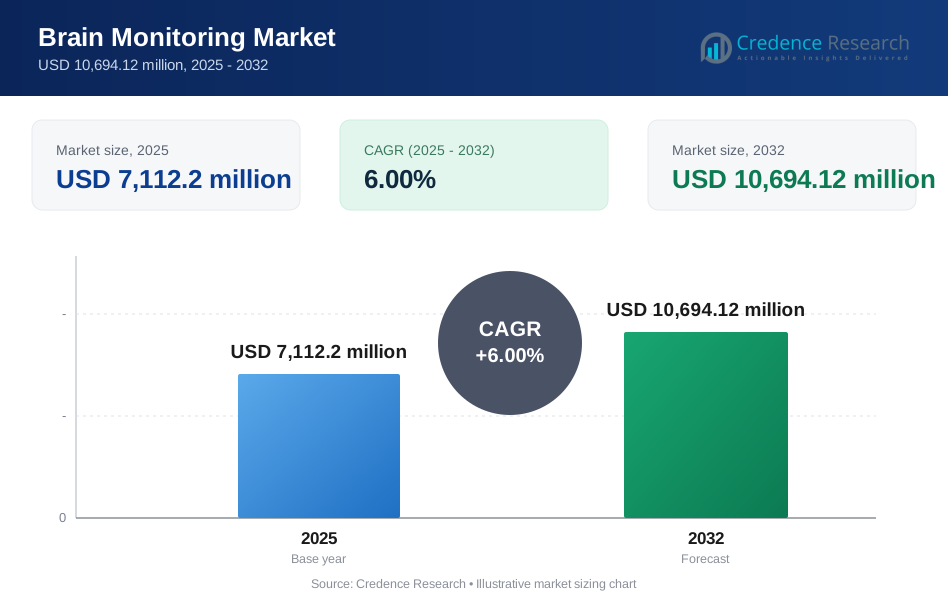
The global Brain Monitoring Market size was estimated at USD 7,112.2 million in 2025 and is expected to reach USD 10,694.12 million by 2032, growing at a CAGR of 6% from 2025 to 2032. Demand is being shaped by higher utilization of neurodiagnostics and continuous monitoring in acute care settings, where faster clinical decisions and risk management are central to patient outcomes. Adoption is also supported by expanding access to neurology services and broader use of monitoring across stroke pathways, seizure evaluation, and neurocritical care. Over the forecast period, technology upgrades and workflow integration across hospitals and specialized neurology centers are expected to keep replacement cycles and service demand active.
| REPORT ATTRIBUTE | DETAILS |
|---|---|
| Historical Period | 2020-2024 |
| Base Year | 2025 |
| Forecast Period | 2026-2032 |
| Brain Monitoring Market Size 2025 | USD 7,112.2 million |
| Brain Monitoring Market, CAGR | 6% |
| Brain Monitoring Market Size 2032 | USD 10,694.12 million |
Key Market Trends & Insights
- The market is projected to expand from USD 7,112.2 million (2025) to USD 10,694.12 million (2032), registering a 6% CAGR (2025–2032).
- Non-invasive procedures represented 72.4% share in 2025, reflecting preference for lower-risk, repeatable monitoring across care settings.
- Hospitals & Clinics accounted for 65.3% share in 2025, supported by ICU demand and centralized purchasing for neuro-monitoring infrastructure.
- EEG Devices held 29.6% share in 2025, driven by broad clinical utility in seizure evaluation and neurocritical monitoring.
- Traumatic Brain Injury / Neurocritical Care captured 27.6% share in 2025, reflecting sustained monitoring needs in high-acuity patient management.
Segment Analysis
The market shows a clear tilt toward scalable monitoring workflows that can support frequent assessments without adding procedural burden. Non-invasive modalities remain central because they align with repeat testing, faster setup, and broader use in both inpatient and outpatient pathways. Hospitals continue to be the primary demand hub due to neuro-ICU requirements, multi-department utilization, and tighter integration with enterprise monitoring and clinical decision workflows.
Across products, EEG maintains a leading role because it is embedded in routine neurodiagnostic practice and increasingly supported by workflow optimization, portability, and digital interpretation tools. Application demand is reinforced by neurocritical care, where continuous observation, early deterioration detection, and protocolized monitoring are common. As providers seek higher throughput and consistent quality, device selection increasingly favors reliability, interoperability, and service support.
By Product / Technology Insights
EEG Devices accounted for the largest share of 29.6% in 2025. EEG remains widely adopted due to its versatility across seizure workups, altered mental status evaluation, and continuous monitoring in critical care. The modality benefits from established clinical protocols, broad clinician familiarity, and relatively scalable deployment compared with more infrastructure-intensive systems. Ongoing upgrades in portability, data management, and interpretation workflows continue to support sustained demand across hospitals and neurology centers.
By Procedure Insights
Non-invasive procedures accounted for the largest share of 72.4% in 2025. Providers favor non-invasive methods because they reduce procedural risk, support repeat monitoring, and fit more easily into routine care pathways. These approaches also align with outpatient and step-down settings where rapid setup and lower staffing burden are important. As monitoring expands beyond tertiary ICUs, non-invasive options tend to scale faster due to simpler implementation and broader clinical acceptance.
By Application Insights
Traumatic Brain Injury / Neurocritical Care accounted for the largest share of 27.6% in 2025. High-acuity neuro patients often require continuous observation to detect secondary injury risks and guide timely interventions. Monitoring intensity is higher in neurocritical settings due to protocol-driven care, complex comorbidities, and the need for real-time trending. This concentration of usage and repeat monitoring supports strong demand for dependable systems, accessories, and service support in critical care environments.
By End User Insights
Hospitals & Clinics accounted for the largest share of 65.3% in 2025. Hospitals concentrate demand because neuro monitoring is used across emergency, ICU, operating room, and inpatient neurology workflows. Procurement is often centralized, enabling bundled purchasing and long-term service agreements that support ongoing upgrades. Higher patient volumes, specialist availability, and enterprise IT integration also drive stronger utilization and replacement cycles in hospital systems compared with smaller facilities.
Brain Monitoring Market Drivers
Expansion of neurocritical care and protocolized monitoring
Neurocritical care pathways increasingly rely on continuous or frequent brain monitoring to guide interventions and reduce secondary complications. Hospitals are standardizing monitoring protocols across ICUs and stroke units to support faster escalation decisions and consistent care quality. This raises utilization intensity, not only device placements, especially for patients requiring trend monitoring over extended stays. As capacity expands in tertiary hospitals, demand rises for systems that can operate reliably with high uptime, streamlined setup, and service support.
- For instance, Natus Medical's BrainWatch EEG system deploys in under 5 minutes with FDA-cleared seizure detection for ER/ICU use. This raises utilization intensity, not only device placements, especially for patients requiring trend monitoring over extended stays.
Growing clinical demand for non-invasive diagnostics at scale
Non-invasive monitoring enables repeat assessments with lower procedural burden, which supports wider adoption across inpatient wards and outpatient environments. As providers aim to increase throughput and reduce complications, they favor modalities that can be deployed quickly and safely across varied patient profiles. This supports procurement for broader departments beyond neurology, including emergency and post-acute monitoring. The result is higher baseline device utilization and stronger replacement demand as hospitals expand monitoring coverage.
- For instance, Masimo's SedLine brain function monitoring reduced sevoflurane exposure by 1.4 MAC hours and pediatric anesthesia emergence delirium incidence by 14% in a study.
Technology upgrades and workflow integration with enterprise monitoring
Brain monitoring increasingly competes on interoperability, data usability, and integration into broader clinical decision workflows. Providers value systems that can feed interpretable outputs into electronic environments and bedside monitoring stacks with minimal friction. Upgrades in software, connectivity, and data management support adoption by reducing workflow disruption and improving clinician confidence. This dynamic also increases demand for services, training, and maintenance as hospitals optimize multi-vendor ecosystems.
Rising burden of neurological disorders and aging populations
Aging demographics and higher incidence of neurological conditions increase diagnostic and monitoring volumes across health systems. Broader screening and earlier referral patterns contribute to more frequent use of EEG and related modalities for evaluation and follow-up. Demand is reinforced by clinical needs across seizures, cognitive disorders, and movement disorders where monitoring can support differential diagnosis or treatment adjustments. As patient volumes rise, providers focus on scaling capacity, improving turnaround times, and maintaining consistent quality.
Brain Monitoring Market Challenges
Adoption can be constrained by high upfront equipment costs, the need for trained neurophysiology staff, and workflow disruption during implementation. Hospitals may face competing capital priorities, particularly when upgrades require integration with IT systems and data governance processes. Variability in reimbursement and clinical practice patterns can also limit standardization, affecting utilization intensity across sites. In resource-constrained settings, monitoring is often concentrated in tertiary centers, slowing broader penetration.
- For instance, a UK implementation study of oesophageal Doppler monitoring found that over 70% of anaesthetists cited unfamiliarity and additional training time as key barriers, requiring a structured training program and clinician “champions” before routine use increased across three hospitals.
Operational complexity remains a key barrier, especially for continuous monitoring use cases that require consistent electrode placement, artifact management, and rapid interpretation. Staffing shortages can reduce monitoring coverage and extend turnaround times, lowering perceived value and delaying expansion programs. Interoperability challenges across multi-vendor environments can add integration cost and prolong deployment timelines. These constraints can shift purchasing toward incremental upgrades rather than large-scale platform replacement.
Brain Monitoring Market Trends and Opportunities
Care pathways are moving toward more continuous and data-driven neuro monitoring in high-acuity settings, creating opportunities for systems that improve signal quality and reduce clinician workload. Hospitals increasingly value solutions that simplify setup and standardize workflows across departments, which supports demand for portable systems and scalable deployment models. As monitoring volumes grow, service support, training, and lifecycle management become stronger differentiators. This trend favors vendors with strong installation, support coverage, and workflow optimization capabilities.
- For instance, Nihon Kohden says its Neurofax EEG-1200 supports 38 to 256 channels, can pull in 8 channels from bedside monitors, allows clinicians to open up to 4 EEGs at the same time, and can save up to 1,000 waveform sections plus 100 copied waveforms for comparison.
Providers are also emphasizing connectivity and data usability, creating opportunities for integrated platforms that align brain monitoring outputs with broader patient monitoring environments. Solutions that support faster interpretation, better trend visualization, and streamlined reporting can improve adoption in busy clinical settings. Expansion of neurology centers and diagnostic networks can also increase demand for standardized equipment fleets and consistent service models. Over time, these shifts support both device sales and recurring revenue from software and services.
Regional Insights
North America (36.90% share in 2025)
North America remains a key revenue center due to high neuro-ICU capacity, stronger access to specialized diagnostics, and faster refresh cycles for monitoring equipment. Large hospital systems increasingly prioritize standardization and interoperability, which supports multi-site deployments and ongoing upgrades. Demand is reinforced by higher diagnosis intensity and established care pathways for stroke, seizures, and neurocritical patients. Competitive activity typically focuses on enterprise integration, service reliability, and workflow efficiency.
Europe (26.40% share in 2025)
Europe’s market is supported by structured healthcare delivery, strong hospital coverage, and established neurodiagnostic practice across major countries. Procurement often emphasizes clinical standardization, evidence-based protocols, and cost-effectiveness across public systems. Adoption remains robust in tertiary hospitals and specialized centers, with steady replacement demand as systems modernize. Vendors that can align with tender requirements, interoperability needs, and service coverage tend to perform well.
Asia Pacific (24.10% share in 2025)
Asia Pacific shows strong momentum supported by expanding tertiary hospitals, improving diagnostic access, and rising demand in stroke and neurocritical pathways. Investments in hospital infrastructure and specialist capacity in large urban centers are increasing utilization of brain monitoring systems. However, adoption can vary widely by country based on reimbursement, budget capacity, and staffing availability. Vendors benefit from scalable offerings, localization, and strong training and service networks.
Latin America (7.60% share in 2025)
Latin America demand is concentrated in major urban hospitals where neurocritical care and diagnostic capacity are strongest. Purchasing is often shaped by budget cycles, import dynamics, and the prioritization of high-acuity departments. Growth opportunities are linked to expansion of trauma and stroke pathways, along with gradual modernization of diagnostic fleets. Vendors that offer dependable service support and flexible deployment options can improve penetration.
Middle East & Africa (5.00% share in 2025)
Middle East & Africa adoption is typically centered in flagship hospitals and expanding private healthcare networks, with gradual diffusion into broader systems over time. Capital investment supports modernization in select markets, while other areas face constraints related to budgets and specialist availability. Demand is anchored in critical care and tertiary neurology services where monitoring impact is highest. Long-term opportunity is tied to capacity expansion, training, and improved access pathways.
Competitive Landscape
Competition is shaped by breadth of neuro-monitoring portfolios, clinical workflow fit, and the ability to integrate signals and reports into hospital monitoring environments. Vendors differentiate through reliability, portability, service coverage, and the strength of training programs that support consistent utilization. Partnerships and ecosystem strategies are increasingly important as buyers prefer solutions that reduce integration friction across multi-department deployments. Long-term positioning favors companies that combine robust hardware with strong service and data workflows.
Medtronic Plc continues to emphasize integrated clinical solutions and partnerships that strengthen deployment scale and hospital interoperability. Its approach aligns with health systems prioritizing standardization, lifecycle support, and compatibility within broader patient monitoring environments. The company’s strategy benefits from established hospital relationships and an ability to support multi-site rollouts through service infrastructure. Continued collaboration efforts can improve access and accelerate adoption where integrated monitoring ecosystems are a purchasing priority.
The industry research and growth report includes detailed analyses of the competitive landscape of the market and information about key companies, including:
- Medtronic Plc
- Koninklijke Philips NV
- Nihon Kohden Corporation
- Natus Medical Incorporated
- Masimo Corporation
- GE HealthCare Technologies Inc.
- Nonin Medical Inc.
- Elekta AB
- Cadwell Laboratories
- Compumedics Limited
Qualitative and quantitative analysis of companies has been conducted to help clients understand the wider business environment as well as the strengths and weaknesses of key industry players. Data is qualitatively analyzed to categorize companies as pure play, category-focused, industry-focused, and diversified; it is quantitatively analyzed to categorize companies as dominant, leading, strong, tentative, and weak.
Recent Developments
- In September 2025, Natus acquired Holberg EEG, adding an AI platform for automatic and comprehensive EEG interpretation to its neurodiagnostics portfolio and strengthening its position in advanced brain monitoring solutions.
- In May 2025, Natus Medical Incorporated launched BrainWatch, a point-of-care EEG solution for critical-care settings designed to work with the NeuroWorks platform and help clinicians deploy brain monitoring quickly in emergency and ICU environments.
- In January 2024, Aditxt acquired a portfolio of EEG brain monitoring technologies and devices formerly owned by Brain Scientific, including the NeuroCap and NeuroEEG assets, to expand its presence in neurology monitoring and diagnostic solutions.
Report Scope
| Report Attribute | Details |
| Market size value in 2025 | USD 7112.2 million |
| Revenue forecast in 2032 | USD 10694.12 million |
| Growth rate (CAGR) | 6% (2025–2032) |
| Base year | 2025 |
| Forecast period | 2026-2032 |
| Quantitative units | USD million |
| Segments covered | By Product / Technology; By Procedure; By Application; By End User |
| Regional scope | North America; Europe; Asia Pacific; Latin America; Middle East & Africa |
| Key companies profiled | Medtronic Plc; Koninklijke Philips NV; Nihon Kohden Corporation; Natus Medical Incorporated; Masimo Corporation; GE HealthCare Technologies Inc.; Nonin Medical Inc.; Elekta AB; Cadwell Laboratories; Compumedics Limited |
| No. of Pages | 320 |
Segmentation
By Product / Technology
- EEG Devices
- MEG Devices
- Cerebral Oximeters
- Intracranial Pressure Monitors
- Transcranial Doppler Devices
- Others
By Procedure
- Invasive
- Non-invasive
By Application
- Epilepsy & Seizure Monitoring
- Traumatic Brain Injury / Neurocritical Care
- Stroke & Cerebrovascular Disorders
- Sleep Disorders
- Dementia
- Parkinson’s Disease
- Others
By End User
- Hospitals & Clinics
- Neurology Centers
- Diagnostic Centers / Laboratories
- Ambulatory Surgical Centers
- Others
By Region
- North America
- U.S.
- Canada
- Mexico
- Europe
- Germany
- France
- U.K.
- Italy
- Spain
- Rest of Europe
- Asia Pacific
- China
- Japan
- India
- South Korea
- South-east Asia
- Rest of Asia Pacific
- Latin America
- Brazil
- Argentina
- Rest of Latin America
- Middle East & Africa
- GCC Countries
- South Africa
- Rest of the Middle East and Africa
Request a Free Sample
Fill in your details and we'll send you a free sample report.
- Sample data tables & charts
- Research methodology
Need a Custom Version of This Report?
Tailor the scope, geography, or segments to your exact requirements.
- Custom geography or segment scope
- Direct access to our analyst team
Frequently Asked Questions
What is the current size and growth outlook of the Brain Monitoring Market?
Which product/technology segment leads the market in 2025?
Why does the non-invasive procedure segment dominate the market?
Which application segment holds the largest share in 2025?
Which end-user segment accounts for the largest demand, and why?
Which region leads the Brain Monitoring Market in 2025, and what are the 2025 regional shares?
Table of Content
Chapter 1. Report Introduction
- 1.1 Report Description & Purpose
- 1.1.1 Report Title & Market Definition
- 1.1.2 Unique Selling Propositions (USP) & Key Differentiators
- 1.1.3 Value Proposition for Stakeholders
- 1.2 Research Objectives
- 1.2.1 Market Sizing Objectives (Volume & Revenue)
- 1.2.2 Segmentation Objectives
- 1.2.3 Competitive Intelligence Objectives
- 1.2.4 Forecast & Scenario Objectives
- 1.3 Report Scope
- 1.3.1 Brain Monitoring Scope – Types & Subtypes Covered
- 1.3.2 Geographic Scope – Regions & Countries Covered
- 1.3.3 Historical Period, Base Year & Forecast Period (2025; forecast to 2032)
- 1.3.4 Inclusions & Exclusions
- 1.4 HS Code & Classification Framework
- 1.5 Currency, Units & Pricing Basis
- 1.6 Target Stakeholders
- 1.7 Limitations & Assumptions
Chapter 2. Executive Summary
- 2.1 Global Brain Monitoring Market Snapshot
- 2.1.1 Market Size – Historical (2025) & Forecast (2025-2032) (2025: USD 7,112.2 million → 2032: USD 10,694.12 million)
- 2.1.2 Volume & Revenue – Global Totals
- 2.1.3 Key Market Highlights – Top Five Facts
- 2.2 Brain Monitoring Market Segmentation Snapshot
- 2.2.1 Market Split by Region – 2025 vs. 2032
- 2.3 Competitive Snapshot
- 2.3.1 Top 10 Players by Revenue Share – 2025
- 2.3.2 Top 10 Players by Volume Share – 2025
- 2.3.3 Recent Strategic Developments (18-Month Summary)
- 2.4 Key Investment Highlights & Strategic Conclusions
Chapter 3. Brain Monitoring Market Dynamics & Industry Analysis
- 3.1 Market Overview & Context
- 3.1.1 Brain Monitoring Market Position in the Broader Automotive Value Chain
- 3.1.2 OEM vs. Replacement Market Dynamics
- 3.1.3 Market Maturity & Development Stage by Region
- 3.2 Brain Monitoring Market Drivers
- 3.3 Brain Monitoring Market Restraints & Challenges
- 3.4 Brain Monitoring Market Opportunities
- 3.5 Porter's Five Forces Analysis
- 3.5.1 Threat of New Entrants
- 3.5.2 Bargaining Power of Suppliers
- 3.5.3 Bargaining Power of Buyers
- 3.5.4 Threat of Substitutes
- 3.5.5 Competitive Rivalry – Intensity Assessment
- 3.6 Brain Monitoring Value Chain Analysis
- 3.6.1 Upstream – Raw Material/Input Suppliers
- 3.6.1.1 Raw Material/Input 1
- 3.6.1.2 Raw Material/Input 2
- 3.6.1.3 Raw Material/Input 3
- 3.6.2 Midstream – Production/Manufacturing/Service Delivery
- 3.6.2.1 Production/Process Overview
- 3.6.2.2 Key Facility Locations & Capacity by Manufacturer
- 3.6.3 Downstream – Distribution & End Consumer
- 3.6.3.1 Primary Channel – B2B/OEM
- 3.6.3.2 Secondary Channels – Dealer, Retail, Online, Direct
- 3.6.4 Value Chain Profitability Analysis
- 3.6.1 Upstream – Raw Material/Input Suppliers
- 3.7 PESTEL Analysis
- 3.7.1 Political Factors
- 3.7.2 Economic Factors
- 3.7.3 Social Factors
- 3.7.4 Technological Factors
- 3.7.5 Environmental Factors
- 3.7.6 Legal Factors
- 3.8 Brain Monitoring Supply Chain Analysis
- 3.8.1 Raw Material/Input Supply Risk Assessment
- 3.8.2 Manufacturing Concentration Risk (Geographic Exposure)
- 3.8.3 Trade Disruption Impact Analysis
- 3.9 Regulatory & Policy Landscape
Note: The regulatory and policy landscape section covers regulations based on their applicability to the market, Brain Monitoring category, geography, and scope of the study. Only regulatory frameworks with a material impact on operations, compliance, trade, sustainability, or market access are analyzed in detail.
Chapter 4. Key Investment Pockets & Opportunity Analysis
- 4.1 Brain Monitoring Market Attractiveness Analysis
- 4.1.1 By Region – Investment Attractiveness Matrix (Volume × CAGR)
- 4.2 Absolute Revenue Growth Opportunity
- 4.2.1 By Region – Absolute USD Growth Through 2032
- 4.3 Incremental Volume Opportunity
- 4.3.1 By Region – Incremental Volume Through 2032
- 4.3.2 Segment – Incremental Volume
- 4.4 Emerging Submarket Opportunity Deep Dive (Subject to Applicability)
- 4.5 Emerging Market Opportunity Scorecards
- 4.5.1 United States
- 4.5.2 Europe
- 4.5.3 Asia
- 4.5.4 Middle East & Africa
Note: Emerging Market Opportunity Scorecards will be included based on relevance and strategic importance. Regions listed are indicative and may vary depending on data availability and market dynamics.
Chapter 5. Brain Monitoring Import-Export Analysis & Trade Flows
- 5.1 Global Trade Overview
- 5.1.1 Global Export Value by Country (2025)
- 5.1.2 Global Export Volume by Country (2025)
- 5.1.3 Global Import Value by Country (2025)
- 5.1.4 Global Import Volume by Country (2025)
- 5.1.5 Net Trade Balance by Country (2025)
- 5.2 Export Analysis – Segment
- 5.2.1 Type 1 (HS Code)
- 5.2.2 Type 2 (HS Code)
- 5.2.3 Type 3 (HS Code)
- 5.2.4 Type 4 (HS Code)
- 5.2.5 Type 5 (HS Code)
- 5.3 Import Analysis – Segment
- 5.3.1 Type 1 (HS Code)
- 5.3.2 Type 2 (HS Code)
- 5.3.3 Type 3 (HS Code)
- 5.3.4 Type 4 (HS Code)
- 5.3.5 Type 5 (HS Code)
- 5.4 Average Unit Trade Prices
- 5.4.1 Average Export Price – Segment & Country
- 5.4.2 Average Import Price – Segment & Source Country
- 5.4.3 Price Trends (2025)
- 5.5 Key Trade Route Analysis
- 5.5.1 Trade Route 1
- 5.5.2 Trade Route 2
- 5.5.3 Trade Route 3
- 5.5.4 Trade Route 4
- 5.5.5 Trade Route 5
- 5.6 Trade Policy Impact Assessment
- 5.6.1 US Anti-Dumping & Section 301 Tariffs
- 5.6.2 EU Customs Union Impact
- 5.6.3 Major Free Trade Agreements
- 5.6.4 USMCA Rules of Origin
Note: Trade policy analysis will be included only where relevant to the Brain Monitoring market.
Chapter 6. Competitive Landscape & Company Benchmarking
- 6.1 Brain Monitoring Market Concentration & Structure
- 6.1.1 Herfindahl-Hirschman Index (HHI) – vs. 2025
- 6.1.2 Tier 1, Tier 2 & Tier 3 Market Structure
- 6.1.3 Global, Regional & Local Player Dynamics
- 6.2 Brain Monitoring Market Share Analysis – 2025
- 6.2.1 Global Revenue Share by Company
- 6.2.2 Global Volume Share by Company
- 6.2.3 Regional Revenue Share
- 6.2.4 Market Share Evolution ( vs. 2025)
- 6.2.5 OEM Segment Share by Company
- 6.2.6 Replacement Segment Share by Company
- 6.3 Production/Delivery Capacity & Facility Analysis
- 6.3.1 Global Installed Capacity
- 6.3.2 Capacity Utilization Rates
- 6.3.3 Production/Output Volume
- 6.3.4 Facility Locations & Capacity Map
- 6.3.5 Planned Capacity Additions
- 6.4 Brain Monitoring Competitive Benchmarking Matrix
- 6.4.1 Revenue, Volume, CAGR & Profitability Comparison
- 6.4.2 Channel Revenue Mix
- 6.4.3 Geographic Revenue Exposure
- 6.4.4 R&D Intensity
- 6.4.5 Sustainability Maturity
- 6.5 Strategic Developments in Brain Monitoring (Last 24 Months)
- 6.5.1 Mergers, Acquisitions & Divestments
- 6.5.2 New Brain Monitoring Launches
- 6.5.3 Facility Expansions
- 6.5.4 Strategic Alliances, Joint Ventures & Partnerships
- 6.5.5 Distribution Expansion & Market Entry
- 6.5.6 Sustainability & ESG Initiatives
- 6.6 Competitive Strategy Mapping
- 6.6.1 Leader, Challenger, Follower & Niche Classification
- 6.6.2 Pricing Strategy Comparison
- 6.6.3 Channel Strategy Matrix
Note: Strategic developments are included based on their materiality and the availability of reliable information.
Chapter 7. Global Brain Monitoring Market – By Distribution Channel
- 7.1 Segment Overview
- 7.1.1 Volume & Revenue Split by Channel (2025 & 2032)
- 7.1.2 Channel Mix Evolution (2025-2032)
Chapter 8. Regional Market Analysis – Global Overview
- 8.1 Global Regional Overview
- 8.1.1 Regional Volume Share
- 8.1.2 Regional Revenue Share
- 8.1.3 Regional Volume by Region
- 8.1.4 Regional Revenue by Region
- 8.1.5 Regional Forecast Through 2032
- 8.2 Cross-Regional Segment Analysis
- 8.2.1 By Distribution Channel
- 8.2.2 By Brand/Price Tier
Chapter 9. North America Brain Monitoring Market
- 9.1 United States
- 9.2 Canada
- 9.3 Mexico
Chapter 10. Europe Brain Monitoring Market
- 10.1 Germany
- 10.2 France
- 10.3 Italy
- 10.4 United Kingdom
- 10.5 Spain
- 10.6 Poland
- 10.7 Russia
- 10.8 Netherlands
- 10.9 Belgium
- 10.10 Sweden
- 10.11 Denmark
- 10.12 Norway
- 10.13 Rest of Europe
Chapter 11. Asia Pacific Brain Monitoring Market
- 11.1 China
- 11.2 India
- 11.3 Japan
- 11.4 South Korea
- 11.5 Thailand
- 11.6 Indonesia
- 11.7 Vietnam
- 11.8 Malaysia
- 11.9 Australia
- 11.10 Rest of Asia Pacific
Chapter 12. Latin America Brain Monitoring Market
- 12.1 Brazil
- 12.2 Argentina
- 12.3 Colombia
- 12.4 Chile
- 12.5 Rest of Latin America
Chapter 13. Middle East Brain Monitoring Market
- 13.1 Saudi Arabia
- 13.2 United Arab Emirates
- 13.3 Turkey
- 13.4 Israel
- 13.5 Iran
- 13.6 Rest of the Middle East
Chapter 14. Africa Brain Monitoring Market
- 14.1 South Africa
- 14.2 Egypt
- 14.3 Nigeria
- 14.4 Morocco
- 14.5 Rest of Africa
Chapter 15. Brain Monitoring Company Profiles
- 15.1 [Company 01]
- 15.1.1 Company Overview
- 15.1.2 Key Management Personnel
- 15.1.3 Products & Services Portfolio
- 15.1.4 Financial Performance
- 15.1.5 Key Market Focus & Geographic Presence
- 15.1.6 Recent Developments & Strategic Initiatives
Note: The company profile list is preliminary and may change based on research findings, market developments, data availability, and client requirements.
Chapter 16. Appendices
- Appendix A – List of Abbreviations & Acronyms
- Appendix B – Industry Classification Code Reference – Full Series
- Appendix C – Production & Capacity Data Tables
- Appendix D – End-Use & Demand Base Tables
- Appendix E – Consumption & Replacement Rate Assumptions
- Appendix F – ASP Reference Tables
- Appendix G – Manufacturing & Facility Database
- Appendix H – Import-Export Data Tables
- Appendix I – Regulatory Summary Tables
- Appendix J – Primary Research Participant List (Anonymized)
- Appendix K – Primary Research Questionnaire Framework
- Appendix L – Data Sources & Bibliography
- Appendix M – Market Size Divergence & Source Comparison
Chapter 17. Research Methodology
- 17.1 Research Framework & Philosophy
- 17.2 Secondary Research – Sources, Hierarchy & Data Extraction
- 17.3 Data Modeling – Bottom-Up & Top-Down Market Sizing
- 17.4 Primary Research – Stakeholder Framework, LOI & Sample Sizes
- 17.5 Forecast Methodology – Regression, Scenario & Sensitivity Analysis
- 17.6 Quality Control – Four-Layer Validation Framework
- 17.7 Limitations & Standard Assumptions
- 17.8 Disclaimer
