
Brain Tumor Therapeutics Market Overview:
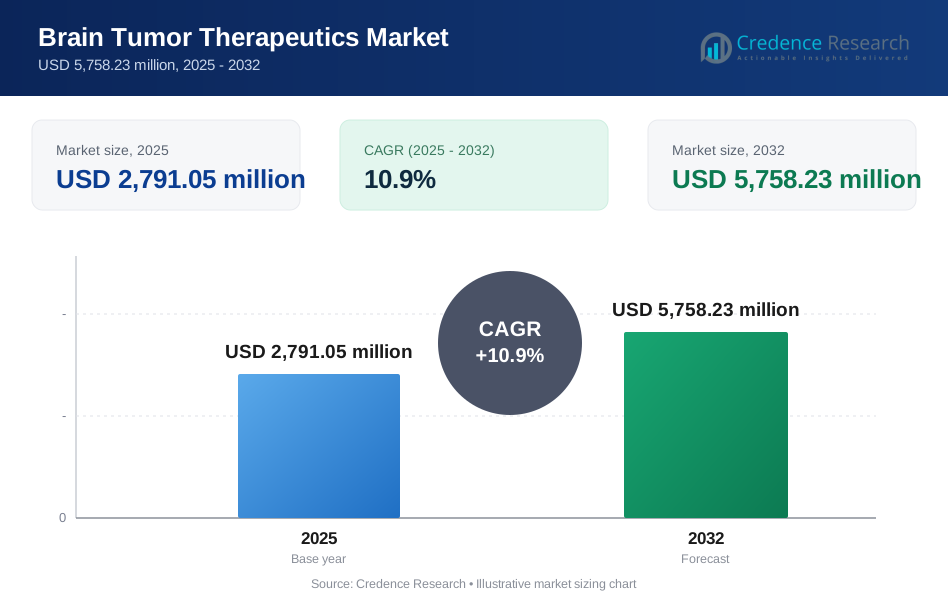
The global Brain Tumor Therapeutics Market size was estimated at USD 2,791.05 million in 2025 and is expected to reach USD 5,758.23 million by 2032, growing at a CAGR of 10.9% from 2025 to 2032. Expansion is primarily driven by the rising clinical and commercial focus on hard-to-treat, high-grade tumors where relapse is common and treatment often spans multiple lines of therapy, increasing cumulative drug utilization per patient. Demand is further reinforced by improving molecular profiling and treatment planning pathways that support more tailored regimen selection, alongside broader adoption of combination protocols in specialized neuro-oncology care settings.
| REPORT ATTRIBUTE | DETAILS |
|---|---|
| Historical Period | 2020-2024 |
| Base Year | 2025 |
| Forecast Period | 2026-2032 |
| Brain Tumor Therapeutics Market Size 2025 | USD 2,791.05 million |
| Brain Tumor Therapeutics Market, CAGR | 10.9% |
| Brain Tumor Therapeutics Market Size 2032 | USD 5,758.23 million |
Key Market Trends & Insights
- North America accounted for 38.90% revenue share in 2025, reflecting higher therapy intensity and faster adoption of advanced treatment options.
- Europe represented 25.80% share in 2025, supported by strong oncology infrastructure and structured access pathways across major markets.
- Asia Pacific held 23.70% share in 2025, driven by expanding specialty care capacity and improving diagnostic penetration in large patient pools.
- Glioblastoma accounted for ~51% of revenue share in 2025, remaining the largest tumor-type segment due to high recurrence and aggressive disease course.
- Intravenous (IV) administration held ~56% share in 2025, reflecting protocol-driven infusion use and monitoring requirements in neuro-oncology care.

Segment Analysis
Therapeutic demand remains concentrated in high-grade tumors where progression risk and relapse drive multi-step care pathways that combine local interventions with systemic treatment. As neuro-oncology workflows mature, therapy selection increasingly aligns with tumor biology, prior treatment history, and tolerance constraints, supporting broader use of combination regimens and sequential lines of care. Care delivery continues to be shaped by the availability of specialized centers that can coordinate neurosurgery, radiation planning, imaging follow-up, and systemic therapy administration with supportive care.
Administration patterns and modality mix reflect real-world delivery constraints in oncology. Intravenous regimens remain central where dosing precision, adverse-event monitoring, and supportive medications are required, particularly during intensive phases of treatment. At the same time, the market continues to evolve toward more tailored approaches, with therapy choice increasingly influenced by tumor classification, patient status, and center-level capability to execute complex protocols consistently.
By Tumor Type Insights
Glioblastoma accounted for the largest share of ~51% in 2025. This leadership is sustained by the tumor’s aggressive biology and high recurrence rates, which increase therapy intensity and the likelihood of multiple treatment lines. Standard care pathways typically involve combined surgery and radiotherapy followed by systemic therapy, which expands cumulative drug exposure. Referral patterns to specialized neuro-oncology centers further concentrate advanced regimens in glioblastoma populations, reinforcing its revenue dominance.
By Therapy / Treatment Modality Insights
Immunotherapy accounted for the largest share of ~32% in 2025. Its position reflects continued integration of immune-based approaches into broader oncology protocols and expanding evaluation in high-grade tumors through combination strategies. Utilization tends to be strongest in higher-resource settings where centers can manage toxicity monitoring and supportive care requirements. Immunotherapy’s role within multimodal pathways supports sustained adoption alongside established backbones rather than single-modality substitution.
By Route of Administration Insights
Intravenous (IV) accounted for the largest share of ~56% in 2025. IV delivery remains preferred for many oncology regimens due to controlled dosing, infusion monitoring, and the need for coordinated supportive therapy. Hospital-based infusion also aligns with neuro-oncology workflows that require frequent imaging, lab assessment, and symptom management during treatment cycles. While oral regimens are used where appropriate, IV administration continues to anchor the highest-intensity phases of care.
By End User Insights
Hospitals remain the primary end-user setting because complex brain tumor care requires multidisciplinary coordination across neurosurgery, radiation oncology, medical oncology, and critical care support. Inpatient and advanced outpatient hospital settings also offer the monitoring infrastructure needed for intensive systemic therapy and toxicity management. Specialty clinics and neuro-oncology centers contribute materially where they have integrated pathways for molecular testing and longitudinal follow-up. Ambulatory surgical centers participate more selectively, typically supporting procedure-focused activity rather than full-cycle tumor management.
Brain Tumor Therapeutics Market Drivers
Rising clinical intensity in high-grade and recurrent tumors
High-grade tumors frequently require multimodal therapy and repeat interventions over time, increasing cumulative treatment exposure per patient. Recurrence-driven care pathways often extend beyond first-line management into additional systemic options, sustaining demand across therapy classes. Treatment sequencing and supportive-care needs elevate utilization in specialized centers, reinforcing market expansion. As care pathways become more standardized, therapy uptake becomes more consistent across eligible patient cohorts.
- For instance, Genentech’s Avastin in recurrent glioblastoma showed a 25.9% objective response rate in the BRAIN study, while Avastin plus lomustine delivered median progression-free survival of 4.2 months versus 1.5 months with lomustine alone in the Phase III EORTC 26101 trial, underscoring how recurrent disease management can extend treatment use across successive lines of care.
Expanding use of biomarker-informed treatment planning
Greater adoption of molecular profiling is improving tumor classification and enabling more tailored therapy selection within neuro-oncology protocols. Biomarker-informed stratification supports more targeted regimen matching and may improve patient selection for specific treatment strategies. This trend also strengthens clinical trial enrollment and accelerates evidence generation for newer approaches. Over time, diagnostic-driven pathways increase the share of patients managed under more structured, protocol-based therapy decisions.
- For instance, Servier’s Phase III INDIGO trial showed that vorasidenib in patients with residual or recurrent grade 2 glioma carrying an IDH1/2 mutation achieved median progression-free survival of 27.7 months versus 11.1 months for placebo, demonstrating how molecularly defined treatment pathways can materially sharpen therapy selection.
Growth of specialized neuro-oncology infrastructure and referral networks
Specialty centers concentrate expertise, advanced imaging, surgical capability, and coordinated oncology services, improving access to complex treatment protocols. Referral networks increase the likelihood that eligible patients receive guideline-aligned care across surgery, radiation, and systemic therapy. Multidisciplinary tumor boards and integrated follow-up workflows support adherence and regimen continuity. These operational improvements raise therapy utilization intensity and broaden uptake of advanced modalities.
Continued innovation in systemic therapies and combination regimens
Ongoing development of newer therapeutic approaches supports expanding optionality in settings where durable outcomes remain limited. Combination strategies and evolving protocols can increase treatment duration and intensity, particularly for aggressive tumor types. As clinical evidence accumulates, adoption becomes more routine in high-capability centers that can manage toxicity and monitoring requirements. Innovation also supports differentiated positioning among leading companies active in neuro-oncology pipelines.
Brain Tumor Therapeutics Market Challenges
Cost sensitivity and access variability remain meaningful constraints, particularly where reimbursement pathways are complex or coverage decisions lag emerging evidence. High-cost therapies and extended treatment durations can stress hospital budgets and payer frameworks, influencing real-world adoption. In some settings, limited availability of specialized services restricts patient access to full multimodal care, reducing therapy utilization intensity. These constraints can lead to uneven uptake across countries and between urban and non-urban care settings.
- For instance, Novartis reported that Pluvicto reduced the risk of death by 38% and the risk of radiographic progression or death by 60% in the Phase III VISION trial, while the company’s U.S. treatment-center locator shows the therapy is administered through a network of over 600 specialized treatment centers, underscoring how advanced radioligand therapies still depend on infrastructure concentration for broad access.
Clinical complexity also creates operational barriers because safe therapy delivery often requires intensive monitoring, coordinated supportive care, and multidisciplinary oversight. Variability in diagnostic readiness and molecular testing access can delay therapy selection and reduce the feasibility of more tailored regimens. Treatment toxicity and patient performance status can limit eligibility for certain therapies, narrowing addressable populations in practice. Supply and procurement consistency for supportive medications and infusion resources can further influence regimen stability across treatment centers.
Market Trends and Opportunities
More structured, pathway-driven care is strengthening protocol adherence across neuro-oncology, improving consistency in how patients are diagnosed, staged, treated, and monitored. As multidisciplinary coordination improves, therapy sequencing becomes more standardized, which supports repeatable adoption of complex regimens. Improved integration of molecular profiling into clinical workflows is also expanding opportunities for more tailored therapy selection. These shifts collectively reinforce the role of specialized centers in driving market demand.
- For instance, Tempus’ FDA-approved xT CDx is a 648-gene next-generation sequencing assay for solid tumors that uses matched normal blood or saliva alongside tumor tissue, and the company stated that tumor-plus-normal orders could move into the xT CDx pathway with no changes to the existing ordering workflow.
Treatment delivery models are also evolving toward balancing clinical control with patient convenience, creating opportunities for regimens that reduce administration burden without compromising outcomes. While IV remains dominant, care settings continue to optimize infusion utilization and outpatient management where feasible. Broader adoption of integrated follow-up and monitoring workflows supports therapy continuity and can improve adherence across longer treatment courses. This trend benefits providers and vendors that support streamlined delivery, monitoring, and protocol standardization.
Regional Insights
North America
North America held 38.90% share in 2025, reflecting high therapy intensity and strong access to advanced neuro-oncology care. The region benefits from dense networks of tertiary hospitals and specialized centers capable of delivering complex multimodal protocols. Clinical trial activity and structured care pathways support earlier incorporation of newer approaches into real-world practice. Strong diagnostic capability and routine follow-up infrastructure reinforce sustained therapy utilization across treatment phases. These factors collectively keep North America as the primary revenue contributor.
Europe
Europe accounted for 25.80% share in 2025, supported by established oncology systems and broad access to surgery and radiotherapy services across major markets. Adoption is shaped by national reimbursement decisions and structured assessment pathways that influence the pace of uptake for newer therapies. Specialized centers and multidisciplinary workflows are common in leading markets, supporting guideline-aligned care. However, therapy utilization intensity can vary across countries based on access conditions and resource allocation. Overall, Europe maintains a large, infrastructure-supported treatment base.
Asia Pacific
Asia Pacific represented 23.70% share in 2025, driven by large patient volumes and expanding specialty care capabilities across key economies. Improving diagnostic penetration and rising specialist capacity support stronger identification and treatment of complex cases. Adoption of advanced protocols is increasing, particularly in major urban centers with tertiary hospitals and integrated oncology services. Variability in access and coverage still influences treatment intensity across countries and care settings. Continued improvements in infrastructure and pathways are expected to reinforce regional contribution.
Latin America
Latin America held 7.20% share in 2025, with demand concentrated in major urban tertiary hospitals and leading oncology centers. Access constraints and uneven reimbursement can limit uptake of higher-cost therapies, influencing regimen selection and treatment continuity. Provider capacity is strongest in large cities, resulting in a more centralized treatment landscape. Where specialized services are available, multimodal protocols support meaningful therapy utilization for eligible patients. Overall share remains constrained by system-level capacity and access variability.
Middle East & Africa
Middle East & Africa accounted for 4.40% share in 2025, with demand concentrated in select high-capability hubs. Advanced neuro-oncology care is most accessible in specialized centers that can coordinate surgery, radiation, and systemic therapy delivery. Broader regional constraints related to specialist availability and infrastructure can limit therapy intensity and protocol adoption. Import dependence and procurement complexity may also influence access consistency across countries. As a result, regional contribution remains comparatively small and center-driven.
Competitive Landscape
Competition is shaped by efforts to strengthen positions in high-grade tumors through differentiated clinical evidence, improved delivery strategies, and integration into multimodal care pathways. Companies focus on portfolio approaches that align with protocol-driven treatment sequencing, including combinations and supportive lifecycle strategies. Differentiation also depends on how effectively therapies can be integrated into specialist workflows that require monitoring, coordination, and sustained follow-up. As evidence evolves, competitive advantage increasingly reflects clinical positioning, access execution, and alignment with neuro-oncology practice patterns.
Bayer AG remains a key participant through its oncology footprint and focus on advancing therapeutics aligned to complex tumor management needs. The company’s approach typically emphasizes evidence generation and alignment with clinical pathways that can support adoption in tertiary care settings. Commercial execution in neuro-oncology depends on integration into multidisciplinary workflows where treatment selection is influenced by institutional protocols and specialist consensus. Continued progress is tied to building differentiated positioning within crowded oncology portfolios and ensuring fit within real-world treatment sequencing.
The industry research and growth report includes detailed analyses of the competitive landscape of the market and information about key companies, including:
- Bayer AG
- F. Hoffmann-La Roche Ltd. / Roche
- Eisai Inc. / Eisai Co., Ltd.
- Novartis AG
- Merck & Co., Inc.
- Bristol Myers Squibb
- Pfizer Inc.
- Amgen Inc.
- Genentech USA
- AstraZeneca plc
- Emcure Pharmaceuticals Ltd.
- Antisense Pharma
Qualitative and quantitative analysis of companies has been conducted to help clients understand the wider business environment as well as the strengths and weaknesses of key industry players. Data is qualitatively analyzed to categorize companies as pure play, category-focused, industry-focused, and diversified; it is quantitatively analyzed to categorize companies as dominant, leading, strong, tentative, and weak.
Recent Developments
- In March 2026, French drugmaker Servier announced a $2.5 billion acquisition of U.S.-based Day One Biopharmaceuticals, marking one of the most significant recent deals in the brain tumor space. The acquisition gives Servier access to Ojemda (tovorafenib), the only FDA-approved monotherapy for pediatric low-grade glioma — the most common form of brain tumor in children
- In December 2025, Moleculin Biotech, Inc. (Nasdaq: MBRX) entered into a research and material transfer agreement with CIC biomaGUNE, a non-profit research organization in Spain, to conduct investigator-initiated preclinical studies evaluating Annamycin for glioblastoma multiforme (GBM).
- In September 2025, Purdue Pharma's investigational drug tinostamustine was selected for inclusion in the GBM AGILE adaptive clinical trial, a landmark platform trial for glioblastoma run by the Global Coalition for Adaptive Research (GCAR).
- In July 2025, Myosin Therapeutics, a biotechnology company founded by scientists at The Wertheim UF Scripps Institute, received FDA clearance to proceed to first-in-human clinical trials with its novel compound MT-125 for glioblastoma. MT-125 targets cellular motor proteins and demonstrated the ability to wipe out aggressive GBM tumors in preclinical mouse studies.
Report Scope
| Report Attribute | Details |
| Market size value in 2025 | USD 2,791.05 million |
| Revenue forecast in 2032 | USD 5,758.23 million |
| Growth rate (CAGR) | 10.9% (2025–2032) |
| Base year | 2025 |
| Forecast period | 2026–2032 |
| Quantitative units | USD million |
| Segments covered | By Tumor Type Outlook: Glioblastoma, Astrocytoma, Meningioma, Oligodendroglioma, Other Primary Brain Tumors, Metastatic (Secondary) Brain Tumors; By Therapy / Treatment Modality Outlook: Chemotherapy, Targeted Therapy, Immunotherapy, Radiotherapy, Surgery, Tumor Treating Fields (TTF); By Route of Administration Outlook: Intravenous (IV), Oral, Intrathecal / Intratumoral; By End User Outlook: Hospitals, Ambulatory Surgical Centers, Specialty Clinics / Neuro-oncology Centers |
| Regional scope | North America, Europe, Asia Pacific, Latin America, Middle East & Africa |
| Key companies profiled | Bayer AG; F. Hoffmann-La Roche Ltd. / Roche; Eisai Inc. / Eisai Co., Ltd.; Novartis AG; Merck & Co., Inc.; Bristol Myers Squibb; Pfizer Inc.; Amgen Inc.; Genentech USA; AstraZeneca plc; Emcure Pharmaceuticals Ltd.; Antisense Pharma |
| No. of Pages | 326 |
Segmentation
By Tumor Type
- Glioblastoma
- Astrocytoma
- Meningioma
- Oligodendroglioma
- Other Primary Brain Tumors
- Metastatic (Secondary) Brain Tumors
By Therapy / Treatment Modality
- Chemotherapy
- Targeted Therapy
- Immunotherapy
- Radiotherapy
- Surgery
- Tumor Treating Fields (TTF)
By Route of Administration
- Intravenous (IV)
- Oral
- Intrathecal / Intratumoral
By End User
- Hospitals
- Ambulatory Surgical Centers
- Specialty Clinics / Neuro-oncology Centers
By Region
- North America
- U.S.
- Canada
- Mexico
- Europe
- Germany
- France
- U.K.
- Italy
- Spain
- Rest of Europe
- Asia Pacific
- China
- Japan
- India
- South Korea
- South-east Asia
- Rest of Asia Pacific
- Latin America
- Brazil
- Argentina
- Rest of Latin America
- Middle East & Africa
- GCC Countries
- South Africa
- Rest of the Middle East and Africa
Request a Free Sample
Fill in your details and we'll send you a free sample report.
- Sample data tables & charts
- Research methodology
Need a Custom Version of This Report?
Tailor the scope, geography, or segments to your exact requirements.
- Custom geography or segment scope
- Direct access to our analyst team
Frequently Asked Questions
What is the Brain Tumor Therapeutics Market size in 2025?
What is the expected market size by 2032?
What is the market CAGR for 2025–2032?
Which tumor type leads the market in 2025?
Which therapy modality leads the market in 2025?
Which region leads the market in 2025?
Table of Content
Chapter 1. Report Introduction
- 1.1 Report Description & Purpose
- 1.1.1 Report Title & Market Definition
- 1.1.2 Unique Selling Propositions (USP) & Key Differentiators
- 1.1.3 Value Proposition for Stakeholders
- 1.2 Research Objectives
- 1.2.1 Market Sizing Objectives (Volume & Revenue)
- 1.2.2 Segmentation Objectives
- 1.2.3 Competitive Intelligence Objectives
- 1.2.4 Forecast & Scenario Objectives
- 1.3 Report Scope
- 1.3.1 Brain Tumor Therapeutics Scope – Types & Subtypes Covered
- 1.3.2 Geographic Scope – Regions & Countries Covered
- 1.3.3 Historical Period, Base Year & Forecast Period (2025; forecast to 2032)
- 1.3.4 Inclusions & Exclusions
- 1.4 HS Code & Classification Framework
- 1.5 Currency, Units & Pricing Basis
- 1.6 Target Stakeholders
- 1.7 Limitations & Assumptions
Chapter 2. Executive Summary
- 2.1 Global Brain Tumor Therapeutics Market Snapshot
- 2.1.1 Market Size – Historical (2025) & Forecast (2025-2032) (2025: USD 2,791.05 million → 2032: USD 5,758.23 million)
- 2.1.2 Volume & Revenue – Global Totals
- 2.1.3 Key Market Highlights – Top Five Facts
- 2.2 Brain Tumor Therapeutics Market Segmentation Snapshot
- 2.2.1 Market Split by Region – 2025 vs. 2032
- 2.3 Competitive Snapshot
- 2.3.1 Top 10 Players by Revenue Share – 2025
- 2.3.2 Top 10 Players by Volume Share – 2025
- 2.3.3 Recent Strategic Developments (18-Month Summary)
- 2.4 Key Investment Highlights & Strategic Conclusions
Chapter 3. Brain Tumor Therapeutics Market Dynamics & Industry Analysis
- 3.1 Market Overview & Context
- 3.1.1 Brain Tumor Therapeutics Market Position in the Broader Automotive Value Chain
- 3.1.2 OEM vs. Replacement Market Dynamics
- 3.1.3 Market Maturity & Development Stage by Region
- 3.2 Brain Tumor Therapeutics Market Drivers
- 3.3 Brain Tumor Therapeutics Market Restraints & Challenges
- 3.4 Brain Tumor Therapeutics Market Opportunities
- 3.5 Porter's Five Forces Analysis
- 3.5.1 Threat of New Entrants
- 3.5.2 Bargaining Power of Suppliers
- 3.5.3 Bargaining Power of Buyers
- 3.5.4 Threat of Substitutes
- 3.5.5 Competitive Rivalry – Intensity Assessment
- 3.6 Brain Tumor Therapeutics Value Chain Analysis
- 3.6.1 Upstream – Raw Material/Input Suppliers
- 3.6.1.1 Raw Material/Input 1
- 3.6.1.2 Raw Material/Input 2
- 3.6.1.3 Raw Material/Input 3
- 3.6.2 Midstream – Production/Manufacturing/Service Delivery
- 3.6.2.1 Production/Process Overview
- 3.6.2.2 Key Facility Locations & Capacity by Manufacturer
- 3.6.3 Downstream – Distribution & End Consumer
- 3.6.3.1 Primary Channel – B2B/OEM
- 3.6.3.2 Secondary Channels – Dealer, Retail, Online, Direct
- 3.6.4 Value Chain Profitability Analysis
- 3.6.1 Upstream – Raw Material/Input Suppliers
- 3.7 PESTEL Analysis
- 3.7.1 Political Factors
- 3.7.2 Economic Factors
- 3.7.3 Social Factors
- 3.7.4 Technological Factors
- 3.7.5 Environmental Factors
- 3.7.6 Legal Factors
- 3.8 Brain Tumor Therapeutics Supply Chain Analysis
- 3.8.1 Raw Material/Input Supply Risk Assessment
- 3.8.2 Manufacturing Concentration Risk (Geographic Exposure)
- 3.8.3 Trade Disruption Impact Analysis
- 3.9 Regulatory & Policy Landscape
Note: The regulatory and policy landscape section covers regulations based on their applicability to the market, Brain Tumor Therapeutics category, geography, and scope of the study. Only regulatory frameworks with a material impact on operations, compliance, trade, sustainability, or market access are analyzed in detail.
Chapter 4. Key Investment Pockets & Opportunity Analysis
- 4.1 Brain Tumor Therapeutics Market Attractiveness Analysis
- 4.1.1 By Region – Investment Attractiveness Matrix (Volume × CAGR)
- 4.2 Absolute Revenue Growth Opportunity
- 4.2.1 By Region – Absolute USD Growth Through 2032
- 4.3 Incremental Volume Opportunity
- 4.3.1 By Region – Incremental Volume Through 2032
- 4.3.2 Segment – Incremental Volume
- 4.4 Emerging Submarket Opportunity Deep Dive (Subject to Applicability)
- 4.5 Emerging Market Opportunity Scorecards
- 4.5.1 United States
- 4.5.2 Europe
- 4.5.3 Asia
- 4.5.4 Middle East & Africa
Note: Emerging Market Opportunity Scorecards will be included based on relevance and strategic importance. Regions listed are indicative and may vary depending on data availability and market dynamics.
Chapter 5. Brain Tumor Therapeutics Import-Export Analysis & Trade Flows
- 5.1 Global Trade Overview
- 5.1.1 Global Export Value by Country (2025)
- 5.1.2 Global Export Volume by Country (2025)
- 5.1.3 Global Import Value by Country (2025)
- 5.1.4 Global Import Volume by Country (2025)
- 5.1.5 Net Trade Balance by Country (2025)
- 5.2 Export Analysis – Segment
- 5.2.1 Type 1 (HS Code)
- 5.2.2 Type 2 (HS Code)
- 5.2.3 Type 3 (HS Code)
- 5.2.4 Type 4 (HS Code)
- 5.2.5 Type 5 (HS Code)
- 5.3 Import Analysis – Segment
- 5.3.1 Type 1 (HS Code)
- 5.3.2 Type 2 (HS Code)
- 5.3.3 Type 3 (HS Code)
- 5.3.4 Type 4 (HS Code)
- 5.3.5 Type 5 (HS Code)
- 5.4 Average Unit Trade Prices
- 5.4.1 Average Export Price – Segment & Country
- 5.4.2 Average Import Price – Segment & Source Country
- 5.4.3 Price Trends (2025)
- 5.5 Key Trade Route Analysis
- 5.5.1 Trade Route 1
- 5.5.2 Trade Route 2
- 5.5.3 Trade Route 3
- 5.5.4 Trade Route 4
- 5.5.5 Trade Route 5
- 5.6 Trade Policy Impact Assessment
- 5.6.1 US Anti-Dumping & Section 301 Tariffs
- 5.6.2 EU Customs Union Impact
- 5.6.3 Major Free Trade Agreements
- 5.6.4 USMCA Rules of Origin
Note: Trade policy analysis will be included only where relevant to the Brain Tumor Therapeutics market.
Chapter 6. Competitive Landscape & Company Benchmarking
- 6.1 Brain Tumor Therapeutics Market Concentration & Structure
- 6.1.1 Herfindahl-Hirschman Index (HHI) – vs. 2025
- 6.1.2 Tier 1, Tier 2 & Tier 3 Market Structure
- 6.1.3 Global, Regional & Local Player Dynamics
- 6.2 Brain Tumor Therapeutics Market Share Analysis – 2025
- 6.2.1 Global Revenue Share by Company
- 6.2.2 Global Volume Share by Company
- 6.2.3 Regional Revenue Share
- 6.2.4 Market Share Evolution ( vs. 2025)
- 6.2.5 OEM Segment Share by Company
- 6.2.6 Replacement Segment Share by Company
- 6.3 Production/Delivery Capacity & Facility Analysis
- 6.3.1 Global Installed Capacity
- 6.3.2 Capacity Utilization Rates
- 6.3.3 Production/Output Volume
- 6.3.4 Facility Locations & Capacity Map
- 6.3.5 Planned Capacity Additions
- 6.4 Brain Tumor Therapeutics Competitive Benchmarking Matrix
- 6.4.1 Revenue, Volume, CAGR & Profitability Comparison
- 6.4.2 Channel Revenue Mix
- 6.4.3 Geographic Revenue Exposure
- 6.4.4 R&D Intensity
- 6.4.5 Sustainability Maturity
- 6.5 Strategic Developments in Brain Tumor Therapeutics (Last 24 Months)
- 6.5.1 Mergers, Acquisitions & Divestments
- 6.5.2 New Brain Tumor Therapeutics Launches
- 6.5.3 Facility Expansions
- 6.5.4 Strategic Alliances, Joint Ventures & Partnerships
- 6.5.5 Distribution Expansion & Market Entry
- 6.5.6 Sustainability & ESG Initiatives
- 6.6 Competitive Strategy Mapping
- 6.6.1 Leader, Challenger, Follower & Niche Classification
- 6.6.2 Pricing Strategy Comparison
- 6.6.3 Channel Strategy Matrix
Note: Strategic developments are included based on their materiality and the availability of reliable information.
Chapter 7. Global Brain Tumor Therapeutics Market – By Distribution Channel
- 7.1 Segment Overview
- 7.1.1 Volume & Revenue Split by Channel (2025 & 2032)
- 7.1.2 Channel Mix Evolution (2025-2032)
Chapter 8. Regional Market Analysis – Global Overview
- 8.1 Global Regional Overview
- 8.1.1 Regional Volume Share
- 8.1.2 Regional Revenue Share
- 8.1.3 Regional Volume by Region
- 8.1.4 Regional Revenue by Region
- 8.1.5 Regional Forecast Through 2032
- 8.2 Cross-Regional Segment Analysis
- 8.2.1 By Distribution Channel
- 8.2.2 By Brand/Price Tier
Chapter 9. North America Brain Tumor Therapeutics Market
- 9.1 United States
- 9.2 Canada
- 9.3 Mexico
Chapter 10. Europe Brain Tumor Therapeutics Market
- 10.1 Germany
- 10.2 France
- 10.3 Italy
- 10.4 United Kingdom
- 10.5 Spain
- 10.6 Poland
- 10.7 Russia
- 10.8 Netherlands
- 10.9 Belgium
- 10.10 Sweden
- 10.11 Denmark
- 10.12 Norway
- 10.13 Rest of Europe
Chapter 11. Asia Pacific Brain Tumor Therapeutics Market
- 11.1 China
- 11.2 India
- 11.3 Japan
- 11.4 South Korea
- 11.5 Thailand
- 11.6 Indonesia
- 11.7 Vietnam
- 11.8 Malaysia
- 11.9 Australia
- 11.10 Rest of Asia Pacific
Chapter 12. Latin America Brain Tumor Therapeutics Market
- 12.1 Brazil
- 12.2 Argentina
- 12.3 Colombia
- 12.4 Chile
- 12.5 Rest of Latin America
Chapter 13. Middle East Brain Tumor Therapeutics Market
- 13.1 Saudi Arabia
- 13.2 United Arab Emirates
- 13.3 Turkey
- 13.4 Israel
- 13.5 Iran
- 13.6 Rest of the Middle East
Chapter 14. Africa Brain Tumor Therapeutics Market
- 14.1 South Africa
- 14.2 Egypt
- 14.3 Nigeria
- 14.4 Morocco
- 14.5 Rest of Africa
Chapter 15. Brain Tumor Therapeutics Company Profiles
- 15.1 [Company 01]
- 15.1.1 Company Overview
- 15.1.2 Key Management Personnel
- 15.1.3 Products & Services Portfolio
- 15.1.4 Financial Performance
- 15.1.5 Key Market Focus & Geographic Presence
- 15.1.6 Recent Developments & Strategic Initiatives
Note: The company profile list is preliminary and may change based on research findings, market developments, data availability, and client requirements.
Chapter 16. Appendices
- Appendix A – List of Abbreviations & Acronyms
- Appendix B – Industry Classification Code Reference – Full Series
- Appendix C – Production & Capacity Data Tables
- Appendix D – End-Use & Demand Base Tables
- Appendix E – Consumption & Replacement Rate Assumptions
- Appendix F – ASP Reference Tables
- Appendix G – Manufacturing & Facility Database
- Appendix H – Import-Export Data Tables
- Appendix I – Regulatory Summary Tables
- Appendix J – Primary Research Participant List (Anonymized)
- Appendix K – Primary Research Questionnaire Framework
- Appendix L – Data Sources & Bibliography
- Appendix M – Market Size Divergence & Source Comparison
Chapter 17. Research Methodology
- 17.1 Research Framework & Philosophy
- 17.2 Secondary Research – Sources, Hierarchy & Data Extraction
- 17.3 Data Modeling – Bottom-Up & Top-Down Market Sizing
- 17.4 Primary Research – Stakeholder Framework, LOI & Sample Sizes
- 17.5 Forecast Methodology – Regression, Scenario & Sensitivity Analysis
- 17.6 Quality Control – Four-Layer Validation Framework
- 17.7 Limitations & Standard Assumptions
- 17.8 Disclaimer
