
| REPORT ATTRIBUTE | DETAILS |
|---|---|
| Historical Period | 2019-2022 |
| Base Year | 2023 |
| Forecast Period | 2024-2032 |
| Cancer Therapeutics Market Size 2023 | USD 167,104.5 million |
| Cancer Therapeutics Market, CAGR | 10.30% |
| Cancer Therapeutics Market Size 2032 | USD 409,753.91 million |
Market Overview:
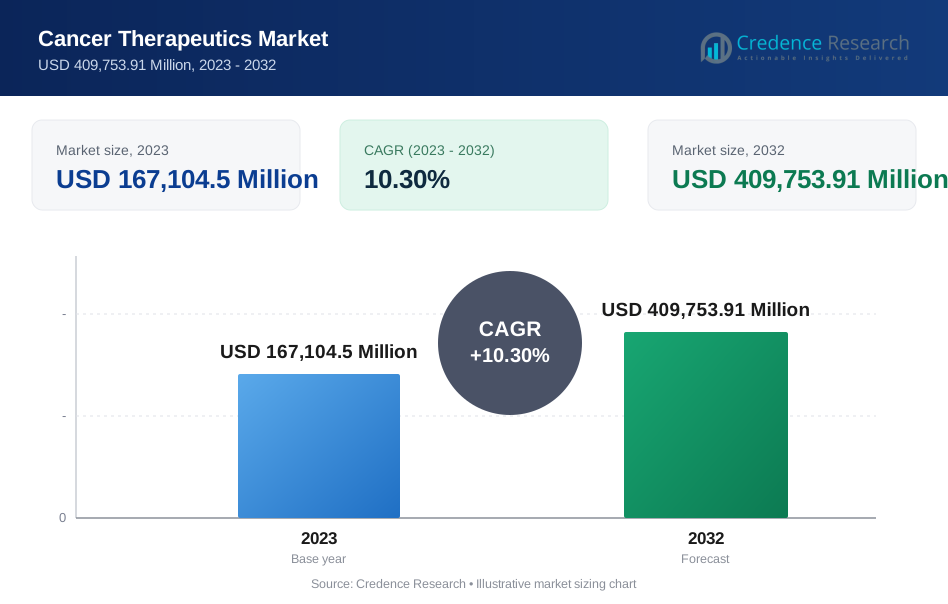
The global cancer therapeutics market is projected to witness significant growth, surging from USD 167,104.5 million in 2023 to USD 409,753.91 million by 2032, with a compound annual growth rate (CAGR) of 10.30%.
The landscape of cancer treatment is evolving rapidly, driven by several factors that collectively contribute to market growth and innovation. Rising cancer prevalence, fueled by aging populations and improved detection methods, underscores the pressing need for effective treatment options. Simultaneously, advancements in cancer research, particularly in personalized medicine and immunotherapy, are revolutionizing treatment approaches, offering patients access to more targeted and less invasive therapies. This growing demand for early detection and treatment, coupled with supportive government initiatives worldwide, further propels market expansion, fostering a climate of optimism and hope in the fight against cancer.
The market itself reflects a diverse mix of established pharmaceutical giants and innovative biotechnology companies competing for market share. Key players such as Roche, Pfizer, and Novartis, alongside emerging biotech firms, drive innovation and offer a wide range of treatment options. While North America currently dominates the market, driven by advanced medical infrastructure and robust healthcare spending, the Asia Pacific region is poised for significant growth. With a rapidly aging population and increasing investments in healthcare infrastructure, Asia Pacific presents lucrative opportunities for market expansion. As research continues and patient access to treatment improves globally, the outlook for cancer treatment appears promising, offering hope for a brighter future in the battle against this pervasive disease.
Market Drivers:
Rising Cancer Prevalence and Growing Awareness:
The escalating incidence of cancer cases globally is a significant concern. For instance, in 2020, there were approximately 18,094,716 million cases of cancer diagnosed worldwide. In the United States alone, the rate of new cases of cancer (cancer incidence) is 442.4 per 100,000 men and women per year. Moreover, the increasing awareness among the public about cancer risks and the availability of early detection methods contribute to higher diagnosis rates, subsequently amplifying the demand for treatment options.
Technological Advancements and Treatment Innovation:
The rapid evolution of medical technology, particularly in targeted therapies, immunotherapy, and gene therapy, stands as a pivotal driver in the market’s expansion. For example, researchers have developed a test that can identify 18 early-stage cancers by analyzing a patient’s blood protein. Additionally, precision oncology, which involves studying the genetic makeup and molecular characteristics of cancer tumors in individual patients, is being hailed as the “best new weapon to defeat cancer”.
Unmet Medical Needs and Focus on Improved Outcomes:
Despite strides in cancer treatment, substantial unmet medical needs persist, particularly in addressing advanced or aggressive cancers. For instance, treatment options for triple-negative breast cancer (TNBC), which is ER negative, PR negative, and HER-negative, are more limited because of the lack of therapeutic targets. This gap presents a ripe market opportunity for the development of novel therapies that promise improved efficacy and reduced side effects. Simultaneously, there’s a strong emphasis on enhancing patient outcomes, including prolonging life expectancy, enhancing quality of life during treatment, and achieving remission, further propelling market growth.
Government Initiatives and Reimbursement Policies:
Government backing for cancer research and the development of new drugs plays a pivotal role in market expansion. This support includes funding for clinical trials and streamlining regulatory processes. Additionally, favorable reimbursement policies from healthcare payers for effective cancer treatments ensure patient access to innovative therapies without imposing significant financial burdens, further driving market growth and adoption of novel treatment modalities.
Market Trends:
The Rise of Precision Medicine:
Precision medicine represents a significant advancement in cancer treatment, departing from the traditional “one-size-fits-all” approach. For instance, by leveraging genomic profiling and targeted therapies, this personalized approach tailors treatment strategies to the specific genetic makeup of a patient’s tumor. The benefits include increased treatment efficacy, reduced side effects, and the potential for early detection and intervention. Pharmaceutical and diagnostic companies are actively investing in research and development to support the adoption of precision medicine, driving growth in the cancer therapeutics market.
Immunotherapy and the Power of the Immune System:
Immunotherapy stands as a transformative approach in cancer therapeutics, harnessing the body’s immune system to combat cancer cells. Unlike traditional treatments, immunotherapy stimulates the immune system to recognize and destroy cancer cells more effectively. For instance, various types of immunotherapy drugs, including checkpoint inhibitors, CAR T-cell therapy, and cancer vaccines, offer promising avenues for long-term remission in different cancer types. While still evolving, the success stories of immunotherapy have spurred significant research efforts, indicating its potential to revolutionize cancer treatment across a broad spectrum of malignancies.
Market Challenges Analysis :
High Cost of Treatment:
Novel cancer therapies, particularly immunotherapies and targeted drugs, often come with significant financial burdens for patients. Factors contributing to these high costs include extensive research and development expenses, complex manufacturing processes, and ongoing production and distribution costs. This financial strain can lead to delayed diagnoses, treatment initiation, and potential financial hardship for patients and their families, particularly in regions with limited healthcare resources or inadequate insurance coverage. Addressing the affordability of cancer treatments is crucial to ensuring equitable access to care and improving patient outcomes.
Limited Treatment Efficacy and Drug Resistance:
Despite advancements in cancer therapeutics, some cancers remain unresponsive to current treatments, and patients may develop resistance to drugs over time. This highlights the need for ongoing research to identify new therapeutic targets, develop personalized treatment approaches, and overcome drug resistance through innovative strategies like combination therapies. Limited treatment efficacy and drug resistance can lead to patient frustration, poorer outcomes, and increased healthcare costs, underscoring the importance of continued innovation in cancer treatment.
Segmentation Analysis:
By Therapy Type:
Different types of therapies play crucial roles in cancer treatment, each with its own set of benefits and challenges. Chemotherapy, a traditional approach utilizing cytotoxic drugs, has long been a mainstay in cancer treatment despite its severe side effects. However, advancements in targeted therapy, which focuses on specific molecular pathways in cancer cells, offer a more precise and potentially less toxic alternative. Additionally, immunotherapy, a rapidly evolving field leveraging the body's immune system, shows promising results, particularly with drugs like checkpoint inhibitors. As research and development efforts continue, targeted therapy and immunotherapy are anticipated to drive significant growth in the cancer therapeutics market, gradually reducing the dominance of chemotherapy.
By Cancer Type :
The market for cancer therapeutics varies across different cancer types, each influenced by factors such as prevalence, awareness, and treatment innovation. Breast cancer, among the most prevalent cancers, is expected to witness significant growth due to rising awareness, early detection initiatives, and an expanding array of treatment options. Similarly, lung cancer, a leading cause of cancer deaths, is projected to experience substantial growth fueled by factors like increasing smoking rates and the adoption of targeted therapies. Blood cancers, including leukemia and lymphoma, are also poised for market growth with the growing use of targeted therapies and immunotherapies. Moreover, advancements in treatment options tailored to specific cancer types and genetic profiles are expected to benefit the market for other cancer types like colorectal cancer, prostate cancer, and pancreatic cancer.
Segments:
Based On Cancer Type
- Blood Cancer
- Lung Cancer
- Breast Cancer
- Gastrointestinal Cancer
- Colorectal Cancer
- Gynecologic Cancer
- Prostate Cancer
- Others
Based On Therapy
- Chemotherapy
- Targeted Therapy
- Immunotherapy
- Hormonal Therapy
- Others
Based On End Users
- Hospitals
- Speciality Clinics
- Cancer and Radiation Therapy Centres
Based On Region
- North America
- The U.S.
- Canada
- Mexico
- Europe
- Germany
- France
- The U.K.
- Italy
- Spain
- Rest of Europe
- Asia Pacific
- China
- Japan
- India
- South Korea
- South-east Asia
- Rest of Asia Pacific
- Latin America
- Brazil
- Argentina
- Rest of Latin America
- Middle East & Africa
- GCC Countries
- South Africa
- Rest of the Middle East and Africa
Regional Analysis:
North America:
North America holds the largest share of the global Cancer Therapeutics market, estimated to be around 45%. The United States represents the dominant market within this region, driven by several factors, including advanced healthcare infrastructure, high prevalence rates of various cancers, and the presence of major pharmaceutical and biotechnology companies.The North American market is characterized by a strong focus on research and development, leading to the introduction of innovative therapies and targeted treatments for different types of cancers. Additionally, well-established screening programs, favorable reimbursement policies, and increasing awareness about early detection have contributed to the market's growth in this region.
Europe:
Europe accounts for a significant share of approximately 30% in the global Cancer Therapeutics market. Countries like Germany, France, the United Kingdom, Italy, and Spain are major contributors to this region's market growth.The European market is driven by factors such as the high incidence rates of various cancers, particularly in Western European countries, and the adoption of advanced diagnostic and treatment methods. Moreover, the region's focus on personalized medicine and the development of targeted therapies have further boosted the Cancer Therapeutics market.
Key player:
- Hoffmann-La Roche AG
- Bristol-Myers Squibb Company
- AbbVie, Inc.
- Johnson & Johnson
- Celgene Corporation
- AstellasPharma, Inc.
- Pfizer, Inc.
- Novartis AG
- Merck KGaA
- Eli Lilly and Company
Competitive Analysis:
The Cancer Therapeutics market is a competitive landscape led by established pharmaceutical giants. Companies like F. Hoffmann-La Roche, Bristol-Myers Squibb, AbbVie, Merck & Co., and Pfizer hold a dominant share due to their robust pipelines and well-marketed drugs across various cancer types. However, the market is witnessing growth from emerging players focused on targeted therapies and immunotherapies. These companies, along with strategic acquisitions and collaborations among key players, are driving innovation and expanding treatment options for different cancers. This competitive environment is expected to benefit patients with a wider range of effective therapies becoming available.
Recent Developments:
In February 2024, Bristol-Myers Squibb attained FDA approval for OPDIVO (nivolumab) alongside Yervoy (ipilimumab) for the initial treatment of patients diagnosed with locally advanced or metastatic urothelial carcinoma (bladder cancer).
In February 2024, Merck & Co. revealed encouraging outcomes from a Phase 3 clinical trial of Keytruda (pembrolizumab) combined with chemotherapy as the primary therapy for advanced non-small cell lung cancer (NSCLC). The study exhibited a statistically significant enhancement in overall survival in comparison to chemotherapy alone.
In January 2024, Johnson & Johnson’s Janssen unit disclosed favorable findings from a Phase 3 trial of Darzalex (daratumumab) combined with bortezomib and lenalidomide for managing patients with newly diagnosed multiple myeloma. The study highlighted a statistically significant advancement in progression-free survival when contrasted with the administration of lenalidomide and bortezomib alone.
In May 2023, Genmab A/S received USFDA approval for its T-cell engaging bispecific antibody, EPKINLY (epcoritamab-bysp), which was intended for the treatment of relapsed or refractory (R/R) diffuse large B-cell lymphoma (DLBCL) in adult patients.
In April 2023, Genentech, a member of the Roche Group, received USFDA approval for its cancer therapy drug, Polivy (polatuzumab vedotin-piiq) in combination with Rituxan (rituximab), cyclophosphamide, doxorubicin and prednisone (R-CHP). The drug is intended for the treatment of previously untreated diffuse large B-cell lymphoma (DLBCL) in adult patients.
In April 2023, Gamida Cell Ltd received USFDA approval for its allogeneic cell therapy, Omnisurge (omidubicel-onlv), intended for adult and pediatric patients 12 years and older with hematologic malignancies.
Market Concentration & Characteristics:
The Cancer Therapeutics market displays a fairly fragmented competitive landscape. Major pharmaceutical companies hold a substantial share, but a multitude of biotechnology firms and academic institutions are actively involved in research and development. This dynamic environment fosters a steady pipeline of novel cancer treatment options, driving continuous innovation in the fight against this complex disease.
Report Coverage:
The research report offers an in-depth analysis based on Therapy Type, End User, Cancer Type, and Region. It details leading market players, providing an overview of their business, product offerings, investments, revenue streams, and key applications. Additionally, the report includes insights into the competitive environment, SWOT analysis, current market trends, as well as the primary drivers and constraints. Furthermore, it discusses various factors that have driven market expansion in recent years. The report also explores market dynamics, regulatory scenarios, and technological advancements that are shaping the industry. It assesses the impact of external factors and global economic changes on market growth. Lastly, it provides strategic recommendations for new entrants and established companies to navigate the complexities of the market.
Future Outlook:
- Treatment will become increasingly personalized, leveraging genetic profiling and molecular diagnostics to tailor therapies to individual patients' specific cancers.
- Continued innovation in CAR-T cell therapy, immune checkpoint inhibitors, and other immunotherapies will offer more effective and long-lasting treatment options with fewer side effects.
- Advancements in early detection tools and technologies will enable earlier intervention, potentially leading to improved treatment outcomes and patient survival rates.
- AI will play a greater role in drug discovery, clinical trial design, and treatment planning, accelerating research and development and improving treatment efficacy.
- Gene editing technologies like CRISPR-Cas9 hold immense potential for permanently correcting genetic mutations that cause cancer, paving the way for potential cures.
- The availability of biosimilar alternatives to expensive brand-name cancer drugs will increase access to treatment and potentially lower healthcare costs.
- The rise of telehealth and remote monitoring technologies will allow for more convenient and personalized care for cancer patients.
- Combining different types of cancer therapies, such as immunotherapy with chemotherapy or targeted therapies, may lead to more effective treatment strategies.
- Patient advocacy groups will play a crucial role in raising awareness, advocating for research funding, and ensuring patient access to new and effective treatments.
- Regulatory bodies will likely adopt more streamlined approval processes for promising cancer therapies, accelerating patient access to innovative treatments.
Request a Free Sample
Fill in your details and we'll send you a free sample report.
- Sample data tables & charts
- Research methodology
Need a Custom Version of This Report?
Tailor the scope, geography, or segments to your exact requirements.
- Custom geography or segment scope
- Direct access to our analyst team
Frequently Asked Questions
What is the current size of the Cancer Therapeutics Market?
What factors are driving the growth of the Cancer Therapeutics Market?
What are the key segments within the Cancer Therapeutics Market?
What are some challenges faced by the Cancer Therapeutics Market?
Who are the major players in the Cancer Therapeutics Market?
Which segment is leading the market share?
Table of Content
Chapter 1. Report Introduction
- 1.1 Report Description & Purpose
- 1.1.1 Report Title & Market Definition
- 1.1.2 Unique Selling Propositions (USP) & Key Differentiators
- 1.1.3 Value Proposition for Stakeholders
- 1.2 Research Objectives
- 1.2.1 Market Sizing Objectives (Volume & Revenue) (Volume Where Applicable)
- 1.2.2 Segmentation Objectives
- 1.2.3 Competitive Intelligence Objectives
- 1.2.4 Forecast & Scenario Objectives
- 1.3 Report Scope
- 1.3.1 Cancer Therapeutics Scope – Segments & Subsegments Covered
- 1.3.2 Geographic Scope – Regions & Countries Covered
- 1.3.3 Historical Period, Base Year & Forecast Period (2023; forecast to 2032)
- 1.3.4 Inclusions & Exclusions
- 1.4 Industry Classification & Applicable Codes
- 1.5 Currency, Measurement Units & Valuation Basis
- 1.6 Target Stakeholders
- 1.7 Limitations & Assumptions
Chapter 2. Executive Summary
- 2.1 Global Cancer Therapeutics Market Snapshot
- 2.1.1 Market Size – Historical (2023) & Forecast (2023-2032) (2023: USD 167,104.5 Million → 2032: USD 409,753.91 Million)
- 2.1.2 Volume & Revenue – Global Totals (Volume Where Applicable)
- 2.1.3 Key Market Highlights – Top Five Facts
- 2.2 Cancer Therapeutics Market Segmentation Snapshot
- 2.2.1 Market Split by Region – 2023 vs. 2032
- 2.3 Competitive Snapshot
- 2.3.1 Top 10 Players by Revenue Share – 2023
- 2.3.2 Top 10 Players by Volume Share – 2023 (Volume Where Applicable)
- 2.3.3 Recent Strategic Developments (18-Month Summary)
- 2.4 Key Investment Highlights & Strategic Conclusions
Chapter 3. Cancer Therapeutics Market Dynamics & Industry Analysis
- 3.1 Market Overview & Context
- 3.1.1 Cancer Therapeutics Market Position in the Broader Industry Value Chain
- 3.1.2 Demand Structure & Purchasing Dynamics
- 3.1.3 Market Maturity & Development Stage by Region
- 3.2 Cancer Therapeutics Market Drivers
- 3.3 Cancer Therapeutics Market Restraints & Challenges
- 3.4 Cancer Therapeutics Market Opportunities
- 3.5 Porter's Five Forces Analysis
- 3.5.1 Threat of New Entrants
- 3.5.2 Bargaining Power of Suppliers
- 3.5.3 Bargaining Power of Buyers
- 3.5.4 Threat of Substitutes
- 3.5.5 Competitive Rivalry – Intensity Assessment
- 3.6 Cancer Therapeutics Value Chain Analysis
- 3.6.1 Upstream – Key Inputs, Resources & Suppliers
- 3.6.1.1 Key Input/Resource 1
- 3.6.1.2 Key Input/Resource 2
- 3.6.1.3 Key Input/Resource 3
- 3.6.2 Midstream – Core Operations & Value Creation
- 3.6.2.1 Operating Model & Process Overview
- 3.6.2.2 Key Operating Locations & Capabilities by Company
- 3.6.3 Downstream – Market Channels & End Users
- 3.6.3.1 Direct Sales & Customer Engagement Channels
- 3.6.3.2 Indirect Sales, Intermediaries & Partner Channels
- 3.6.4 Value Chain Profitability Analysis
- 3.6.1 Upstream – Key Inputs, Resources & Suppliers
- 3.7 PESTEL Analysis
- 3.7.1 Political Factors
- 3.7.2 Economic Factors
- 3.7.3 Social Factors
- 3.7.4 Technological Factors
- 3.7.5 Environmental Factors
- 3.7.6 Legal Factors
- 3.8 Cancer Therapeutics Supply Chain Analysis
- 3.8.1 Critical Input & Resource Availability Risk Assessment
- 3.8.2 Supplier & Operational Concentration Risk (Geographic Exposure)
- 3.8.3 Supply & Service Disruption Impact Analysis
- 3.9 Regulatory & Policy Landscape
Note: The regulatory and policy landscape section covers regulations based on their applicability to the market, Cancer Therapeutics category, geography, and scope of the study. Only regulatory frameworks with a material impact on operations, compliance, trade, sustainability, or market access are analyzed in detail.
Chapter 4. Key Investment Pockets & Opportunity Analysis
- 4.1 Cancer Therapeutics Market Attractiveness Analysis
- 4.1.1 By Region – Investment Attractiveness Matrix (Market Size × CAGR)
- 4.2 Absolute Revenue Growth Opportunity
- 4.2.1 By Region – Absolute Revenue Growth Through 2032
- 4.3 Incremental Demand Opportunity
- 4.3.1 By Region – Incremental Demand Through 2032
- 4.3.2 Segment – Incremental Demand
- 4.4 Emerging Submarket Opportunity Deep Dive (Subject to Applicability)
- 4.5 Priority Market Opportunity Scorecards
- 4.5.1 United States
- 4.5.2 Europe
- 4.5.3 Asia
- 4.5.4 Middle East & Africa
Note: Priority market opportunity scorecards reflect the geographic scope and strategic relevance of the study. Listed markets are indicative and may be adapted to the industry.
Chapter 5. Cancer Therapeutics Cross-Border Trade & Market Access Analysis
- 5.1 International Trade & Cross-Border Activity Overview
- 5.1.1 Global Export Value by Country (2023)
- 5.1.2 Global Export Volume by Country (2023) (Volume Where Applicable)
- 5.1.3 Global Import Value by Country (2023)
- 5.1.4 Global Import Volume by Country (2023) (Volume Where Applicable)
- 5.1.5 Net Trade Balance by Country (2023)
- 5.2 Export Analysis – Segment
- 5.2.1 Category 1 (Applicable Classification Code)
- 5.2.2 Category 2 (Applicable Classification Code)
- 5.2.3 Category 3 (Applicable Classification Code)
- 5.2.4 Category 4 (Applicable Classification Code)
- 5.2.5 Category 5 (Applicable Classification Code)
- 5.3 Import Analysis – Segment
- 5.3.1 Category 1 (Applicable Classification Code)
- 5.3.2 Category 2 (Applicable Classification Code)
- 5.3.3 Category 3 (Applicable Classification Code)
- 5.3.4 Category 4 (Applicable Classification Code)
- 5.3.5 Category 5 (Applicable Classification Code)
- 5.4 Cross-Border Pricing & Transaction Benchmarks
- 5.4.1 Export Pricing – Segment & Country
- 5.4.2 Import Pricing – Segment & Source Country
- 5.4.3 Price Trends (2023)
- 5.5 Key Cross-Border Trade & Delivery Routes
- 5.5.1 Cross-Border Trade/Delivery Route 1
- 5.5.2 Cross-Border Trade/Delivery Route 2
- 5.5.3 Cross-Border Trade/Delivery Route 3
- 5.5.4 Cross-Border Trade/Delivery Route 4
- 5.5.5 Cross-Border Trade/Delivery Route 5
- 5.6 Trade Policy & Market Access Impact Assessment
- 5.6.1 Tariff & Non-Tariff Barriers
- 5.6.2 Regional Trade & Economic Integration Frameworks
- 5.6.3 Bilateral & Multilateral Trade Agreements
- 5.6.4 Cross-Border Operating, Licensing & Localization Requirements
Note: This chapter applies where cross-border trade or delivery is relevant to Cancer Therapeutics. Goods, services, and digital offerings are assessed using applicable classifications and transaction measures. Import-export volumes, trade balances, and route analyses are included only where meaningful to the market.
Chapter 6. Competitive Landscape & Company Benchmarking
- 6.1 Cancer Therapeutics Market Concentration & Structure
- 6.1.1 Herfindahl-Hirschman Index (HHI) – vs. 2023
- 6.1.2 Leading, Mid-Sized & Emerging Player Structure
- 6.1.3 Global, Regional & Local Player Dynamics
- 6.2 Cancer Therapeutics Market Share Analysis – 2023
- 6.2.1 Global Revenue Share by Company
- 6.2.2 Global Volume Share by Company (Volume Where Applicable)
- 6.2.3 Regional Revenue Share
- 6.2.4 Market Share Evolution ( vs. 2023)
- 6.2.5 Company Market Share by Key Segment
- 6.2.6 Company Market Share by Customer Group
- 6.3 Operating Scale, Capacity & Infrastructure Analysis
- 6.3.1 Global Operating Scale & Supply Capacity
- 6.3.2 Resource Utilization & Operating Efficiency
- 6.3.3 Output, Service Delivery & Activity Metrics
- 6.3.4 Operating Footprint & Infrastructure Map
- 6.3.5 Planned Operational & Capacity Expansion
- 6.4 Cancer Therapeutics Competitive Benchmarking Matrix
- 6.4.1 Revenue, Growth, Profitability & Operating Metric Comparison
- 6.4.2 Channel Revenue Mix
- 6.4.3 Geographic Revenue Exposure
- 6.4.4 R&D Intensity
- 6.4.5 Sustainability Maturity
- 6.5 Strategic Developments in Cancer Therapeutics (Last 24 Months)
- 6.5.1 Mergers, Acquisitions & Divestments
- 6.5.2 New Products, Services & Solutions in Cancer Therapeutics
- 6.5.3 Operational & Infrastructure Expansions
- 6.5.4 Strategic Alliances, Joint Ventures & Partnerships
- 6.5.5 Distribution Expansion & Market Entry
- 6.5.6 Sustainability & ESG Initiatives
- 6.6 Competitive Strategy Mapping
- 6.6.1 Leader, Challenger, Follower & Niche Classification
- 6.6.2 Pricing Strategy Comparison
- 6.6.3 Channel Strategy Matrix
Note: Strategic developments are included based on their materiality and the availability of reliable information.
Chapter 7. Global Cancer Therapeutics Market – By Sales & Delivery Channel
- 7.1 Segment Overview
- 7.1.1 Volume & Revenue Split by Channel (2023 & 2032) (Volume Where Applicable)
- 7.1.2 Channel Mix Evolution (2023-2032)
Chapter 8. Regional Market Analysis – Global Overview
- 8.1 Global Regional Overview
- 8.1.1 Regional Volume Share (Volume Where Applicable)
- 8.1.2 Regional Revenue Share
- 8.1.3 Regional Volume by Region (Volume Where Applicable)
- 8.1.4 Regional Revenue by Region
- 8.1.5 Regional Forecast Through 2032
- 8.2 Cross-Regional Segment Analysis
- 8.2.1 By Sales & Delivery Channel
- 8.2.2 By Competitive Positioning & Price Tier
Chapter 9. North America Cancer Therapeutics Market
- 9.1 United States
- 9.2 Canada
- 9.3 Mexico
Chapter 10. Europe Cancer Therapeutics Market
- 10.1 Germany
- 10.2 France
- 10.3 Italy
- 10.4 United Kingdom
- 10.5 Spain
- 10.6 Poland
- 10.7 Russia
- 10.8 Netherlands
- 10.9 Belgium
- 10.10 Sweden
- 10.11 Denmark
- 10.12 Norway
- 10.13 Rest of Europe
Chapter 11. Asia Pacific Cancer Therapeutics Market
- 11.1 China
- 11.2 India
- 11.3 Japan
- 11.4 South Korea
- 11.5 Thailand
- 11.6 Indonesia
- 11.7 Vietnam
- 11.8 Malaysia
- 11.9 Australia
- 11.10 Rest of Asia Pacific
Chapter 12. Latin America Cancer Therapeutics Market
- 12.1 Brazil
- 12.2 Argentina
- 12.3 Colombia
- 12.4 Chile
- 12.5 Rest of Latin America
Chapter 13. Middle East Cancer Therapeutics Market
- 13.1 Saudi Arabia
- 13.2 United Arab Emirates
- 13.3 Turkey
- 13.4 Israel
- 13.5 Iran
- 13.6 Rest of the Middle East
Chapter 14. Africa Cancer Therapeutics Market
- 14.1 South Africa
- 14.2 Egypt
- 14.3 Nigeria
- 14.4 Morocco
- 14.5 Rest of Africa
Chapter 15. Cancer Therapeutics Company Profiles
- 15.1 [Company 01]
- 15.1.1 Company Overview
- 15.1.2 Key Management Personnel
- 15.1.3 Products & Services Portfolio
- 15.1.4 Financial Performance
- 15.1.5 Key Market Focus & Geographic Presence
- 15.1.6 Recent Developments & Strategic Initiatives
Note: The company profile list is preliminary and may change based on research findings, market developments, data availability, and client requirements.
Chapter 16. Appendices
- Appendix A – List of Abbreviations & Acronyms
- Appendix B – Industry Classification Code Reference – Full Series
- Appendix C – Supply, Output & Operating Capacity Data Tables
- Appendix D – End-Use & Demand Base Tables
- Appendix E – Demand, Adoption & Usage Assumptions
- Appendix F – Pricing & Revenue Metric Reference Tables
- Appendix G – Company Operations & Infrastructure Database
- Appendix H – Cross-Border Trade & Activity Data Tables (Where Applicable)
- Appendix I – Regulatory Summary Tables
- Appendix J – Primary Research Participant List (Anonymized)
- Appendix K – Primary Research Questionnaire Framework
- Appendix L – Data Sources & Bibliography
- Appendix M – Market Size Divergence & Source Comparison
Chapter 17. Research Methodology
- 17.1 Research Framework & Philosophy
- 17.2 Secondary Research – Sources, Hierarchy & Data Extraction
- 17.3 Data Modeling – Bottom-Up & Top-Down Market Sizing
- 17.4 Primary Research – Stakeholder Framework, LOI & Sample Sizes
- 17.5 Forecast Methodology – Regression, Scenario & Sensitivity Analysis
- 17.6 Quality Control – Four-Layer Validation Framework
- 17.7 Limitations & Standard Assumptions
- 17.8 Disclaimer
