
Cancer Biomarkers Market Overview:
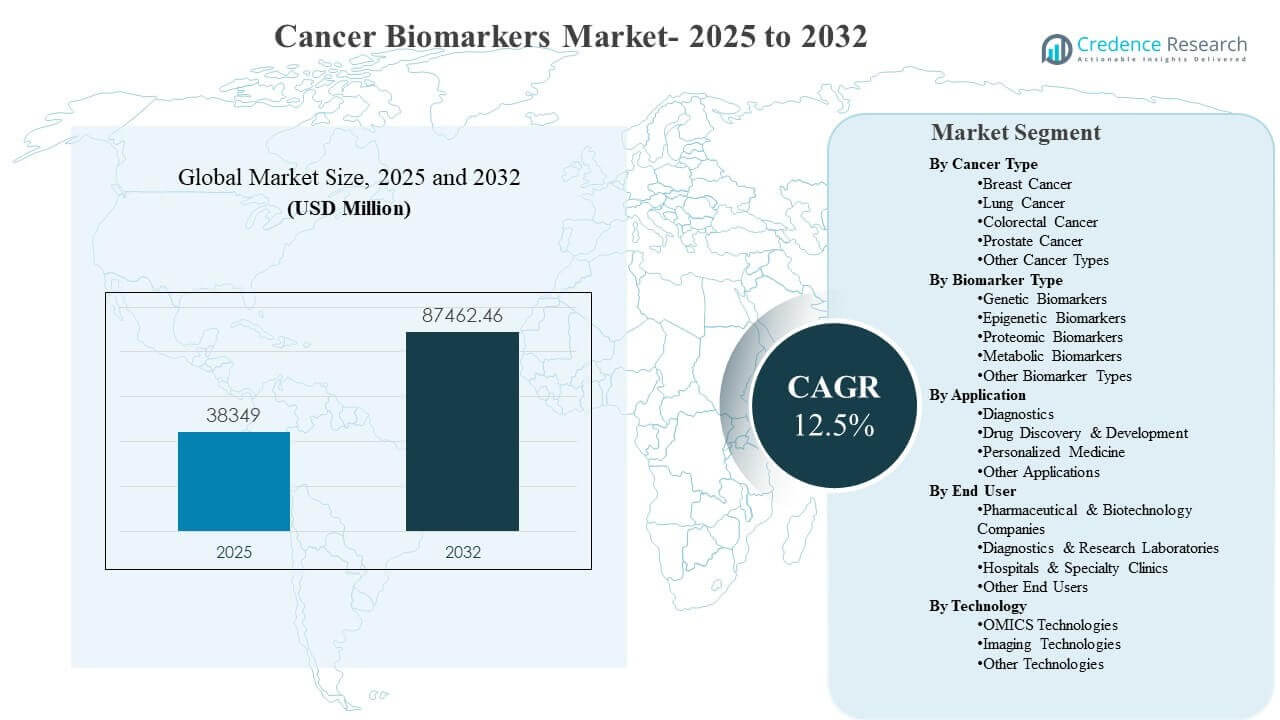
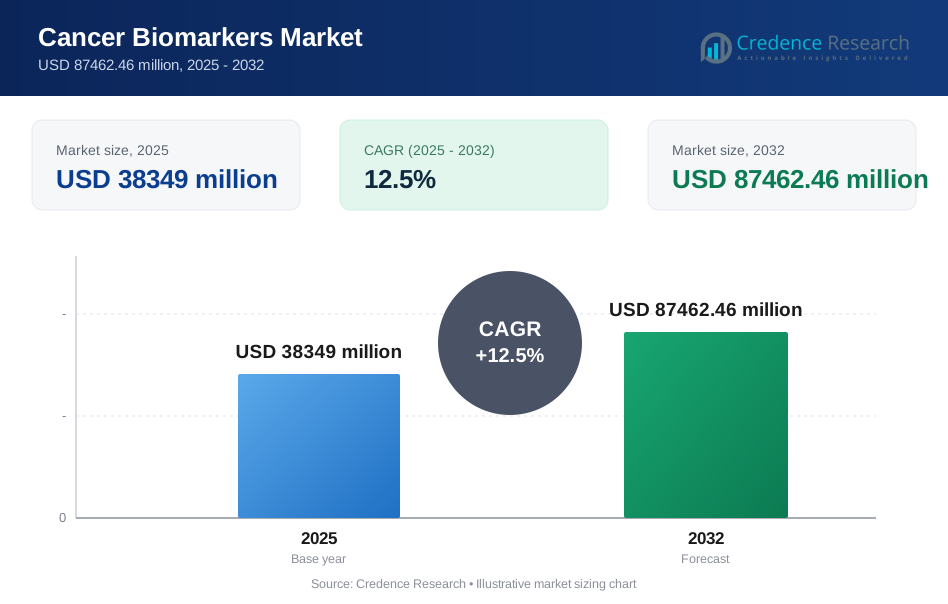
The global Cancer Biomarkers Market size was estimated at USD 38349 million in 2025 and is expected to reach USD 87462.46 million by 2032, growing at a CAGR of 12.5% from 2025 to 2032. Growth is primarily driven by the accelerating clinical shift toward biomarker-guided oncology, where test results directly inform screening decisions, therapy selection, and longitudinal monitoring across major tumor types. The expansion of multi-omics profiling, wider adoption of blood-based testing formats, and stronger integration of companion diagnostics into routine care pathways continue to broaden test menus and increase per-patient testing intensity across mature and emerging healthcare systems.
| REPORT ATTRIBUTE | DETAILS |
|---|---|
| Historical Period | 2020-2024 |
| Base Year | 2025 |
| Forecast Period | 2026-2032 |
| Cancer Biomarkers Market Size 2025 | USD 38349 million |
| Cancer Biomarkers Market, CAGR | 12.5% |
| Cancer Biomarkers Market Size 2032 | USD 87462.46 million |
Key Market Trends & Insights
- The Cancer Biomarkers Market is projected to expand at a CAGR of 5% (2025–2032), reflecting rapid scaling of precision oncology testing volumes.
- Breast Cancer accounted for the largest share of 34.4% in 2025, supported by high screening intensity and guideline-aligned biomarker utilization.
- Protein / Proteomic Biomarkers held 50.9% share in 2025, sustained by entrenched clinical workflows and broad assay availability.
- Hospitals & Specialty Clinics captured 40.3% share in 2025, driven by integrated diagnostic-to-treatment decision cycles and turnaround-time priorities.
- North America represented 39.8% share in 2025, supported by reimbursement depth, advanced laboratory infrastructure, and high adoption of molecular profiling.
Segment Analysis
Cancer biomarker adoption is advancing as oncology care moves toward earlier risk identification and more frequent monitoring across the treatment journey. Blood-based testing formats are improving ordering convenience and enabling broader screening and surveillance use cases, particularly when paired with scalable laboratory workflows. Multi-omics platforms are increasing discovery throughput and expanding clinically actionable panels beyond single-marker assays, strengthening demand for integrated testing menus.
Companion diagnostics and therapy-selection use cases remain central to clinical uptake as targeted regimens expand across breast, lung, colorectal, and prostate cancers. Bioinformatics and AI-driven interpretation are improving clinical actionability for complex profiles, supporting adoption of larger panels in routine practice. Outsourcing to high-throughput reference laboratories is expanding, but hospitals and specialty clinics continue to anchor decision-making where rapid turnaround and care integration are critical.
By Cancer Type Insights
Breast Cancer accounted for the largest share of 34.4% in 2025. High screening intensity, established care pathways, and frequent biomarker-driven treatment decisions support sustained testing volume in breast oncology. Strong linkage to companion diagnostics for targeted and endocrine therapies increases repeat testing and encourages broader panels. Longitudinal monitoring and recurrence risk stratification further raise testing frequency across clinical settings.
By Biomarker Type Insights
Protein / Proteomic Biomarkers accounted for the largest share of 50.9% in 2025. Protein-marker assays remain deeply embedded in routine oncology workflows and are widely accessible across hospital and reference laboratory platforms. Standardized test performance and mature clinical evidence support continued demand for protein-based markers in diagnosis, prognosis, and therapy monitoring. At the same time, expanding multi-analyte approaches increasingly complement protein markers with genomic and epigenomic signals.
By Application Insights
Diagnostics remains the primary commercialization route for cancer biomarkers, spanning screening support, diagnosis confirmation, prognosis, and treatment selection. Clinical demand is strengthened by guideline-driven testing and the need for rapid, actionable results at key decision points. Drug discovery and development continues to adopt biomarkers to stratify patients, enrich responder populations, and shorten development cycles. Personalized medicine use expands as profiling results increasingly direct targeted regimens and longitudinal monitoring strategies.
By End User Insights
Hospitals & Specialty Clinics accounted for the largest share of 40.3% in 2025. Hospital-led oncology pathways prioritize rapid turnaround for therapy selection, driving in-house testing growth and tight integration with clinical workflows. Specialty clinics contribute through structured treatment pathways that rely on biomarker results for regimen optimization and monitoring. Reference laboratories scale high-throughput sequencing and analytics, strengthening outsourced testing volumes, but hospital-centered decision cycles preserve strong demand within care delivery networks.
By Technology Insights
OMICS Technologies accounted for the largest share of 33.1% in 2025. Omics platforms benefit from high-throughput profiling capabilities and expanding use in both tumor tissue profiling and liquid biopsy workflows. Declining sequencing costs, improved automation, and standardized pipelines support broader adoption across clinical laboratories. Imaging-linked biomarker development is progressing through digital pathology and AI enablement, but omics remains central to comprehensive molecular characterization.
Cancer Biomarkers Market Drivers
Expansion of Precision Oncology and Companion Diagnostics
Precision oncology adoption is increasing the clinical reliance on validated biomarkers for therapy selection and monitoring. Oncology workflows increasingly require biomarker confirmation before initiating targeted regimens, raising testing volume per patient episode. Companion diagnostics integration also broadens the addressable testing menu across tumor types and treatment classes. Broader panel usage is encouraged by clinical guidelines and the need for comprehensive molecular characterization at diagnosis and progression.
- For instance, Foundation Medicine's FoundationOne CDx reached a cumulative milestone of 100 approved companion diagnostic indications across the United States and Japan by late 2025, comprising 57 U.S. FDA approvals and 43 approvals from Japan's Ministry of Health, Labour, and Welfare all delivered through a single NGS-based platform covering 324 cancer-associated genes across solid tumor types.
Growth in Liquid Biopsy and Blood-Based Testing Adoption
Liquid biopsy adoption is expanding due to convenience, repeatability, and the ability to support longitudinal monitoring. Blood-based formats reduce barriers compared with invasive tissue sampling and enable earlier detection and surveillance use cases. Expanded utilization increases test frequency across screening, treatment response tracking, and recurrence monitoring. Laboratory standardization and improved assay sensitivity continue to strengthen clinical confidence and support wider adoption across hospitals and reference laboratories.
- For instance, GRAIL's Galleri multi-cancer early detection (MCED) test was evaluated across a real-world cohort of 111,080 individuals, demonstrating an empirical positive predictive value of 49.4% and a cancer signal origin localization accuracy of 87% figures consistent with its controlled clinical validation performance.
Rising Oncology Burden and Screening Program Intensification
Growing cancer incidence and expanding screening programs increase demand for early detection and risk stratification tools. Biomarker testing supports earlier clinical action and improves treatment pathway selection, reinforcing use across major tumor types. Health systems increasingly prioritize diagnostic efficiency to reduce late-stage treatment intensity and improve outcomes. These factors support sustained demand growth across both established and emerging markets.
Advancements in Multi-Omics Platforms and Bioinformatics
High-throughput sequencing, proteomics, and integrated analytics are accelerating biomarker discovery and clinical translation. Bioinformatics improvements enhance interpretation of complex profiles, supporting clinical actionability and broader panel deployment. Workflow automation is improving scalability and repeatability, supporting higher testing throughput in routine practice. Continued platform innovation expands clinical utility across diagnostics, monitoring, and personalized medicine use cases.
Cancer Biomarkers Market Challenges
Cancer biomarker commercialization faces variability in clinical validation requirements, assay standardization, and real-world evidence expectations across jurisdictions. Laboratory-to-laboratory differences in sample handling, platform selection, and interpretation pipelines can reduce comparability and slow broader adoption. Reimbursement fragmentation and coverage uncertainty can limit uptake, particularly for newer multi-analyte tests and expanded screening applications. These factors can lengthen time-to-scale despite strong clinical interest.
Operational constraints remain significant as high-complexity testing requires skilled personnel, robust quality systems, and reliable supply chains for reagents and consumables. Data interpretation burdens increase with multi-omics profiling, raising dependence on specialized informatics and clinician education. Integration into clinical workflows can be uneven when ordering pathways, turnaround times, and reporting formats are not optimized. Cost sensitivity across emerging markets can further constrain broad access to advanced testing.
- For instance, Caris Life Sciences states that its MI Profile/MI Cancer Seek workflow combines whole exome and whole transcriptome sequencing across 23,000+ genes with protein analysis and AI-predictive algorithms, while the FDA-approved MI Cancer Seek reports SNVs and indels in 228 genes plus MSI, TMB, and one copy-number amplification marker, underscoring the informatics and operational depth required for routine deployment.
Cancer Biomarkers Market Trends and Opportunities
Multi-cancer early detection and broader blood-based screening strategies are creating new commercialization pathways beyond single-cancer assays. Expanded adoption is supported by improving test sensitivity, strong patient preference for minimally invasive options, and the ability to integrate ordering into routine care. As evidence accumulates, these modalities can expand addressable volume and support recurring testing models in screening and surveillance. The trend also creates opportunities for differentiated analytics and population-scale lab operations.
Technology convergence across omics platforms, digital pathology, and AI-enabled interpretation is strengthening clinical utility and improving workflow efficiency. Integrated reporting and decision-support tools can enhance clinician confidence and increase adoption within hospital systems. Partnerships between diagnostics firms, pharma, and health systems are expanding test availability and supporting companion diagnostic expansion. Growth opportunities also emerge from scaling reference laboratory networks and improving access in Asia Pacific and selected Middle East markets.
- For instance, Paige the first company to receive FDA authorization for an AI product in digital pathology demonstrated in its pivotal clinical study that pathologists using Paige Prostate Detect increased cancer detection sensitivity from 88.7% to 96.6%, achieved a 70% reduction in false-negative diagnoses, and a 24% reduction in false-positive diagnoses, with non-specialist pathologists reaching diagnostic accuracy on par with prostate specialists.
Regional Insights
North America (39.8%)
North America leads with a 39.8% share in 2025, supported by deep molecular diagnostics penetration, strong reimbursement coverage, and high routine adoption of precision oncology. Large reference labs and integrated health systems enable standardized workflows and high-throughput testing. Demand is reinforced by companion diagnostics and expanding blood-based formats for monitoring and screening-adjacent use cases, while continuous platform innovation and robust oncology pipelines sustain volumes.
Europe (24.9%)
Europe accounted for 24.9% share in 2025, backed by established oncology care pathways and increasing alignment of biomarker testing with clinical guidelines. Cross-border research networks and translational programs drive demand for validated, reproducible assays. Centralized testing hubs and expanding multi-omics capabilities in key markets support steady growth, with further upside tied to workflow standardization and broader access to advanced profiling.
Asia Pacific (23.6%)
Asia Pacific held 23.6% share in 2025, reflecting rapid expansion as oncology infrastructure and laboratory capacity scale across large populations. Adoption of sequencing and multi-omics workflows is rising due to precision medicine investments and growing cancer center networks. Outsourcing growth and larger diagnostic service providers improve access to advanced testing, while affordability gains and stronger clinical pathway integration support continued momentum.
Latin America (7.7%)
Latin America represented 7.7% share in 2025, with demand increasing as private lab networks and leading urban cancer centers expand molecular diagnostics capability. Access remains uneven due to reimbursement variability and concentration of advanced testing in higher-income segments. Growth opportunities include expanding regional reference labs, improving clinician education, and increasing availability of standardized panels through stronger hospital and oncology network partnerships.
Middle East & Africa (4.0%)
Middle East & Africa accounted for 4.0% share in 2025, growing from a smaller base with adoption concentrated in GCC markets, South Africa, and select hubs. Expanding oncology services and investment in diagnostics support gradual uptake of molecular profiling. Infrastructure gaps and variable reimbursement remain constraints, while centralized testing models and public–private partnerships can improve access to validated assays.
Competitive Landscape
The competitive landscape is shaped by breadth of biomarker testing menus, scalability of laboratory workflows, and the ability to deliver clinically actionable interpretation for complex profiles. Companies differentiate through validated assays, strong instrument and reagent ecosystems, and partnerships that embed tests into clinical pathways and drug development programs. Competitive intensity is rising in blood-based screening and multi-omics profiling, where performance, turnaround time, and evidence depth influence adoption across hospitals and reference laboratories.
- Hoffmann-La Roche Ltd. emphasizes companion diagnostics and integrated oncology workflows by aligning assay development with therapeutic decision-making needs and standardized pathology systems. The company’s approach centers on broad clinical adoption through validated assays, platform integration, and support for routine testing in oncology care settings. Continued expansion of diagnostic portfolios and workflow enablement strengthens positioning in biomarker-guided treatment selection.
The industry research and growth report includes detailed analyses of the competitive landscape of the market and information about key companies, including:
- F. Hoffmann-La Roche Ltd.
- Abbott
- Thermo Fisher Scientific Inc.
- QIAGEN N.V.
- Illumina, Inc.
- Agilent Technologies
- Bio-Rad Laboratories
- Hologic, Inc.
- Merck & Co.
- Becton, Dickinson and Company
- Exact Sciences
- Siemens Healthineers
- Guardant Health
- Foundation Medicine
Qualitative and quantitative analysis of companies has been conducted to help clients understand the wider business environment as well as the strengths and weaknesses of key industry players. Data is qualitatively analyzed to categorize companies as pure play, category-focused, industry-focused, and diversified; it is quantitatively analyzed to categorize companies as dominant, leading, strong, tentative, and weak.
Recent Developments
- In September 2025, Illumina announced strategic partnerships with multiple global pharmaceutical companies to develop companion diagnostics (CDx) enabled on its TruSight™ Oncology (TSO) Comprehensive genomic profiling test.
- In May 2025, Thermo Fisher Scientific showcased a decade of pharma partnership in next-generation sequencing (NGS) companion diagnostics development and commercialization at the ASCO 2025 Annual Meeting, highlighting how its integrated solutions span from biomarker discovery through clinical commercialization.
- In April 2025, Agilent Technologies showcased innovative products and strategic partnerships focused on transforming cancer research, diagnostics, and therapeutics at the AACR Annual Meeting. The company highlighted its commitment to delivering comprehensive multiomic insights and cutting-edge diagnostic tools that empower researchers and clinicians to make more informed treatment decisions.
- In April 2025, QIAGEN announced a series of new products and partnership updates designed to strengthen its cancer genomic profiling portfolio, showcased at the American Association for Cancer Research (AACR) Annual Meeting in Chicago. The company launched new QIAseq panels providing deeper and more accurate insights into cancer biology and biomarker discovery, integrated with QIAGEN Digital Insights for genomic data analysis and interpretation.
Report Scope
| Report Attribute | Details |
| Market size value in 2025 | USD 38349 million |
| Revenue forecast in 2032 | USD 87462.46 million |
| Growth rate (CAGR) | 12.5% (2025–2032) |
| Base year | 2025 |
| Forecast period | 2026-2032 |
| Quantitative units | USD million |
| Segments covered | By Cancer Type Outlook: Breast Cancer, Lung Cancer, Colorectal Cancer, Prostate Cancer, Other Cancer Types; By Biomarker Type Outlook: Genetic Biomarkers, Epigenetic Biomarkers, Proteomic Biomarkers, Metabolic Biomarkers, Other Biomarker Types; By Application Outlook: Diagnostics, Drug Discovery & Development, Personalized Medicine, Other Applications; By End User Outlook: Pharmaceutical & Biotechnology Companies, Diagnostics & Research Laboratories, Hospitals & Specialty Clinics, Other End Users; By Technology Outlook: OMICS Technologies, Imaging Technologies, Other Technologies |
| Regional scope | North America, Europe, Asia Pacific, Latin America, Middle East & Africa |
| Key companies profiled | F. Hoffmann-La Roche Ltd.; Abbott; Thermo Fisher Scientific Inc.; QIAGEN N.V.; Illumina, Inc.; Agilent Technologies; Bio-Rad Laboratories; Hologic, Inc.; Merck & Co.; Becton, Dickinson and Company; Exact Sciences; Siemens Healthineers; Guardant Health; Foundation Medicine |
| No.of Pages | 335 |
Segmentation
By Cancer Type
- Breast Cancer
- Lung Cancer
- Colorectal Cancer
- Prostate Cancer
- Other Cancer Types
By Biomarker Type
- Genetic Biomarkers
- Epigenetic Biomarkers
- Proteomic Biomarkers
- Metabolic Biomarkers
- Other Biomarker Types
By Application
- Diagnostics
- Drug Discovery & Development
- Personalized Medicine
- Other Applications
By End User
- Pharmaceutical & Biotechnology Companies
- Diagnostics & Research Laboratories
- Hospitals & Specialty Clinics
- Other End Users
By Technology
- OMICS Technologies
- Imaging Technologies
- Other Technologies
By Region
- North America
- U.S.
- Canada
- Mexico
- Europe
- Germany
- France
- U.K.
- Italy
- Spain
- Rest of Europe
- Asia Pacific
- China
- Japan
- India
- South Korea
- South-east Asia
- Rest of Asia Pacific
- Latin America
- Brazil
- Argentina
- Rest of Latin America
- Middle East & Africa
- GCC Countries
- South Africa
- Rest of the Middle East and Africa
Request a Free Sample
Fill in your details and we'll send you a free sample report.
- Sample data tables & charts
- Research methodology
Need a Custom Version of This Report?
Tailor the scope, geography, or segments to your exact requirements.
- Custom geography or segment scope
- Direct access to our analyst team
Frequently Asked Questions
What is the current and forecast market size of the Cancer Biomarkers Market?
What is the CAGR for the Cancer Biomarkers Market during 2025–2032?
What is the largest segment in the Cancer Biomarkers Market?
What factors are driving growth in the Cancer Biomarkers Market?
Which companies are leading in the Cancer Biomarkers Market?
Which region leads the Cancer Biomarkers Market?
Table of Content
Chapter 1. Report Introduction
- 1.1 Report Description & Purpose
- 1.1.1 Report Title & Market Definition
- 1.1.2 Unique Selling Propositions (USP) & Key Differentiators
- 1.1.3 Value Proposition for Stakeholders
- 1.2 Research Objectives
- 1.2.1 Market Sizing Objectives (Volume & Revenue)
- 1.2.2 Segmentation Objectives
- 1.2.3 Competitive Intelligence Objectives
- 1.2.4 Forecast & Scenario Objectives
- 1.3 Report Scope
- 1.3.1 Cancer Biomarkers Scope – Types & Subtypes Covered
- 1.3.2 Geographic Scope – Regions & Countries Covered
- 1.3.3 Historical Period, Base Year & Forecast Period (2025; forecast to 2032)
- 1.3.4 Inclusions & Exclusions
- 1.4 HS Code & Classification Framework
- 1.5 Currency, Units & Pricing Basis
- 1.6 Target Stakeholders
- 1.7 Limitations & Assumptions
Chapter 2. Executive Summary
- 2.1 Global Cancer Biomarkers Market Snapshot
- 2.1.1 Market Size – Historical (2025) & Forecast (2025-2032) (2025: USD 38349 million → 2032: USD 87462.46 million)
- 2.1.2 Volume & Revenue – Global Totals
- 2.1.3 Key Market Highlights – Top Five Facts
- 2.2 Cancer Biomarkers Market Segmentation Snapshot
- 2.2.1 Market Split by Region – 2025 vs. 2032
- 2.3 Competitive Snapshot
- 2.3.1 Top 10 Players by Revenue Share – 2025
- 2.3.2 Top 10 Players by Volume Share – 2025
- 2.3.3 Recent Strategic Developments (18-Month Summary)
- 2.4 Key Investment Highlights & Strategic Conclusions
Chapter 3. Cancer Biomarkers Market Dynamics & Industry Analysis
- 3.1 Market Overview & Context
- 3.1.1 Cancer Biomarkers Market Position in the Broader Automotive Value Chain
- 3.1.2 OEM vs. Replacement Market Dynamics
- 3.1.3 Market Maturity & Development Stage by Region
- 3.2 Cancer Biomarkers Market Drivers
- 3.3 Cancer Biomarkers Market Restraints & Challenges
- 3.4 Cancer Biomarkers Market Opportunities
- 3.5 Porter's Five Forces Analysis
- 3.5.1 Threat of New Entrants
- 3.5.2 Bargaining Power of Suppliers
- 3.5.3 Bargaining Power of Buyers
- 3.5.4 Threat of Substitutes
- 3.5.5 Competitive Rivalry – Intensity Assessment
- 3.6 Cancer Biomarkers Value Chain Analysis
- 3.6.1 Upstream – Raw Material/Input Suppliers
- 3.6.1.1 Raw Material/Input 1
- 3.6.1.2 Raw Material/Input 2
- 3.6.1.3 Raw Material/Input 3
- 3.6.2 Midstream – Production/Manufacturing/Service Delivery
- 3.6.2.1 Production/Process Overview
- 3.6.2.2 Key Facility Locations & Capacity by Manufacturer
- 3.6.3 Downstream – Distribution & End Consumer
- 3.6.3.1 Primary Channel – B2B/OEM
- 3.6.3.2 Secondary Channels – Dealer, Retail, Online, Direct
- 3.6.4 Value Chain Profitability Analysis
- 3.6.1 Upstream – Raw Material/Input Suppliers
- 3.7 PESTEL Analysis
- 3.7.1 Political Factors
- 3.7.2 Economic Factors
- 3.7.3 Social Factors
- 3.7.4 Technological Factors
- 3.7.5 Environmental Factors
- 3.7.6 Legal Factors
- 3.8 Cancer Biomarkers Supply Chain Analysis
- 3.8.1 Raw Material/Input Supply Risk Assessment
- 3.8.2 Manufacturing Concentration Risk (Geographic Exposure)
- 3.8.3 Trade Disruption Impact Analysis
- 3.9 Regulatory & Policy Landscape
Note: The regulatory and policy landscape section covers regulations based on their applicability to the market, Cancer Biomarkers category, geography, and scope of the study. Only regulatory frameworks with a material impact on operations, compliance, trade, sustainability, or market access are analyzed in detail.
Chapter 4. Key Investment Pockets & Opportunity Analysis
- 4.1 Cancer Biomarkers Market Attractiveness Analysis
- 4.1.1 By Region – Investment Attractiveness Matrix (Volume × CAGR)
- 4.2 Absolute Revenue Growth Opportunity
- 4.2.1 By Region – Absolute USD Growth Through 2032
- 4.3 Incremental Volume Opportunity
- 4.3.1 By Region – Incremental Volume Through 2032
- 4.3.2 Segment – Incremental Volume
- 4.4 Emerging Submarket Opportunity Deep Dive (Subject to Applicability)
- 4.5 Emerging Market Opportunity Scorecards
- 4.5.1 United States
- 4.5.2 Europe
- 4.5.3 Asia
- 4.5.4 Middle East & Africa
Note: Emerging Market Opportunity Scorecards will be included based on relevance and strategic importance. Regions listed are indicative and may vary depending on data availability and market dynamics.
Chapter 5. Cancer Biomarkers Import-Export Analysis & Trade Flows
- 5.1 Global Trade Overview
- 5.1.1 Global Export Value by Country (2025)
- 5.1.2 Global Export Volume by Country (2025)
- 5.1.3 Global Import Value by Country (2025)
- 5.1.4 Global Import Volume by Country (2025)
- 5.1.5 Net Trade Balance by Country (2025)
- 5.2 Export Analysis – Segment
- 5.2.1 Type 1 (HS Code)
- 5.2.2 Type 2 (HS Code)
- 5.2.3 Type 3 (HS Code)
- 5.2.4 Type 4 (HS Code)
- 5.2.5 Type 5 (HS Code)
- 5.3 Import Analysis – Segment
- 5.3.1 Type 1 (HS Code)
- 5.3.2 Type 2 (HS Code)
- 5.3.3 Type 3 (HS Code)
- 5.3.4 Type 4 (HS Code)
- 5.3.5 Type 5 (HS Code)
- 5.4 Average Unit Trade Prices
- 5.4.1 Average Export Price – Segment & Country
- 5.4.2 Average Import Price – Segment & Source Country
- 5.4.3 Price Trends (2025)
- 5.5 Key Trade Route Analysis
- 5.5.1 Trade Route 1
- 5.5.2 Trade Route 2
- 5.5.3 Trade Route 3
- 5.5.4 Trade Route 4
- 5.5.5 Trade Route 5
- 5.6 Trade Policy Impact Assessment
- 5.6.1 US Anti-Dumping & Section 301 Tariffs
- 5.6.2 EU Customs Union Impact
- 5.6.3 Major Free Trade Agreements
- 5.6.4 USMCA Rules of Origin
Note: Trade policy analysis will be included only where relevant to the Cancer Biomarkers market.
Chapter 6. Competitive Landscape & Company Benchmarking
- 6.1 Cancer Biomarkers Market Concentration & Structure
- 6.1.1 Herfindahl-Hirschman Index (HHI) – vs. 2025
- 6.1.2 Tier 1, Tier 2 & Tier 3 Market Structure
- 6.1.3 Global, Regional & Local Player Dynamics
- 6.2 Cancer Biomarkers Market Share Analysis – 2025
- 6.2.1 Global Revenue Share by Company
- 6.2.2 Global Volume Share by Company
- 6.2.3 Regional Revenue Share
- 6.2.4 Market Share Evolution ( vs. 2025)
- 6.2.5 OEM Segment Share by Company
- 6.2.6 Replacement Segment Share by Company
- 6.3 Production/Delivery Capacity & Facility Analysis
- 6.3.1 Global Installed Capacity
- 6.3.2 Capacity Utilization Rates
- 6.3.3 Production/Output Volume
- 6.3.4 Facility Locations & Capacity Map
- 6.3.5 Planned Capacity Additions
- 6.4 Cancer Biomarkers Competitive Benchmarking Matrix
- 6.4.1 Revenue, Volume, CAGR & Profitability Comparison
- 6.4.2 Channel Revenue Mix
- 6.4.3 Geographic Revenue Exposure
- 6.4.4 R&D Intensity
- 6.4.5 Sustainability Maturity
- 6.5 Strategic Developments in Cancer Biomarkers (Last 24 Months)
- 6.5.1 Mergers, Acquisitions & Divestments
- 6.5.2 New Cancer Biomarkers Launches
- 6.5.3 Facility Expansions
- 6.5.4 Strategic Alliances, Joint Ventures & Partnerships
- 6.5.5 Distribution Expansion & Market Entry
- 6.5.6 Sustainability & ESG Initiatives
- 6.6 Competitive Strategy Mapping
- 6.6.1 Leader, Challenger, Follower & Niche Classification
- 6.6.2 Pricing Strategy Comparison
- 6.6.3 Channel Strategy Matrix
Note: Strategic developments are included based on their materiality and the availability of reliable information.
Chapter 7. Global Cancer Biomarkers Market – By Distribution Channel
- 7.1 Segment Overview
- 7.1.1 Volume & Revenue Split by Channel (2025 & 2032)
- 7.1.2 Channel Mix Evolution (2025-2032)
Chapter 8. Regional Market Analysis – Global Overview
- 8.1 Global Regional Overview
- 8.1.1 Regional Volume Share
- 8.1.2 Regional Revenue Share
- 8.1.3 Regional Volume by Region
- 8.1.4 Regional Revenue by Region
- 8.1.5 Regional Forecast Through 2032
- 8.2 Cross-Regional Segment Analysis
- 8.2.1 By Distribution Channel
- 8.2.2 By Brand/Price Tier
Chapter 9. North America Cancer Biomarkers Market
- 9.1 United States
- 9.2 Canada
- 9.3 Mexico
Chapter 10. Europe Cancer Biomarkers Market
- 10.1 Germany
- 10.2 France
- 10.3 Italy
- 10.4 United Kingdom
- 10.5 Spain
- 10.6 Poland
- 10.7 Russia
- 10.8 Netherlands
- 10.9 Belgium
- 10.10 Sweden
- 10.11 Denmark
- 10.12 Norway
- 10.13 Rest of Europe
Chapter 11. Asia Pacific Cancer Biomarkers Market
- 11.1 China
- 11.2 India
- 11.3 Japan
- 11.4 South Korea
- 11.5 Thailand
- 11.6 Indonesia
- 11.7 Vietnam
- 11.8 Malaysia
- 11.9 Australia
- 11.10 Rest of Asia Pacific
Chapter 12. Latin America Cancer Biomarkers Market
- 12.1 Brazil
- 12.2 Argentina
- 12.3 Colombia
- 12.4 Chile
- 12.5 Rest of Latin America
Chapter 13. Middle East Cancer Biomarkers Market
- 13.1 Saudi Arabia
- 13.2 United Arab Emirates
- 13.3 Turkey
- 13.4 Israel
- 13.5 Iran
- 13.6 Rest of the Middle East
Chapter 14. Africa Cancer Biomarkers Market
- 14.1 South Africa
- 14.2 Egypt
- 14.3 Nigeria
- 14.4 Morocco
- 14.5 Rest of Africa
Chapter 15. Cancer Biomarkers Company Profiles
- 15.1 [Company 01]
- 15.1.1 Company Overview
- 15.1.2 Key Management Personnel
- 15.1.3 Products & Services Portfolio
- 15.1.4 Financial Performance
- 15.1.5 Key Market Focus & Geographic Presence
- 15.1.6 Recent Developments & Strategic Initiatives
Note: The company profile list is preliminary and may change based on research findings, market developments, data availability, and client requirements.
Chapter 16. Appendices
- Appendix A – List of Abbreviations & Acronyms
- Appendix B – Industry Classification Code Reference – Full Series
- Appendix C – Production & Capacity Data Tables
- Appendix D – End-Use & Demand Base Tables
- Appendix E – Consumption & Replacement Rate Assumptions
- Appendix F – ASP Reference Tables
- Appendix G – Manufacturing & Facility Database
- Appendix H – Import-Export Data Tables
- Appendix I – Regulatory Summary Tables
- Appendix J – Primary Research Participant List (Anonymized)
- Appendix K – Primary Research Questionnaire Framework
- Appendix L – Data Sources & Bibliography
- Appendix M – Market Size Divergence & Source Comparison
Chapter 17. Research Methodology
- 17.1 Research Framework & Philosophy
- 17.2 Secondary Research – Sources, Hierarchy & Data Extraction
- 17.3 Data Modeling – Bottom-Up & Top-Down Market Sizing
- 17.4 Primary Research – Stakeholder Framework, LOI & Sample Sizes
- 17.5 Forecast Methodology – Regression, Scenario & Sensitivity Analysis
- 17.6 Quality Control – Four-Layer Validation Framework
- 17.7 Limitations & Standard Assumptions
- 17.8 Disclaimer
