
Capecitabine Market Overview:
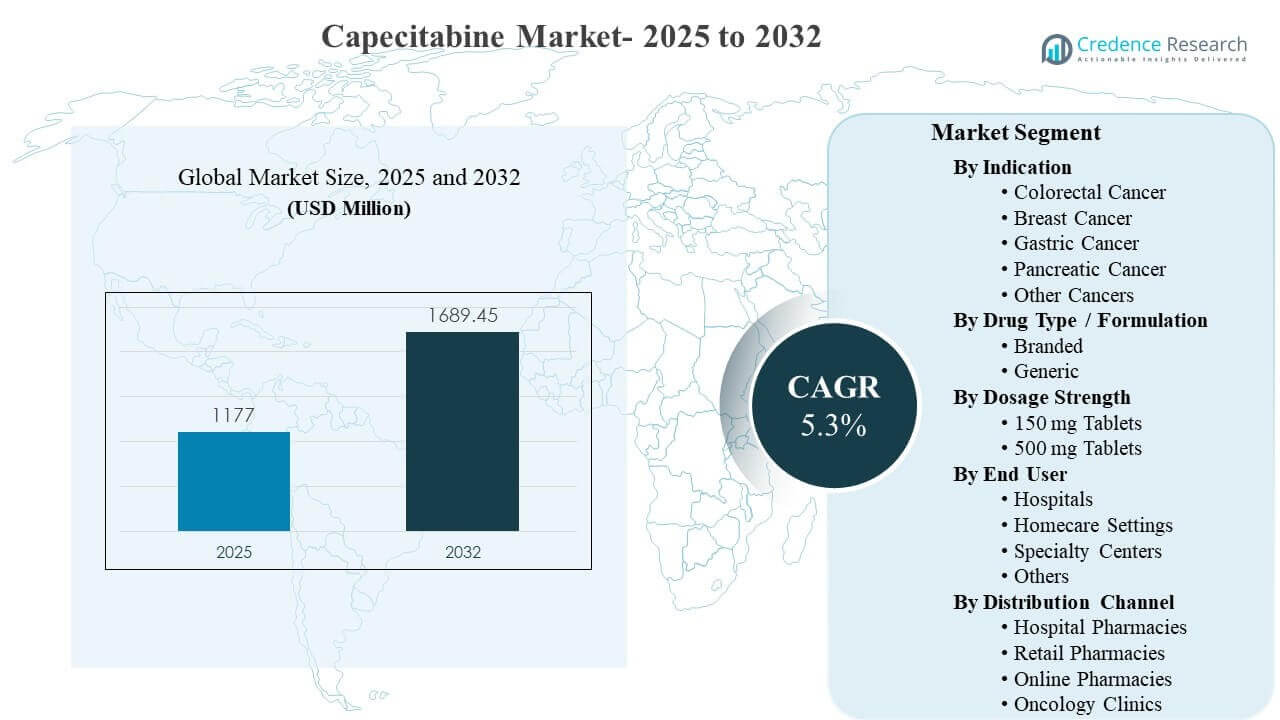
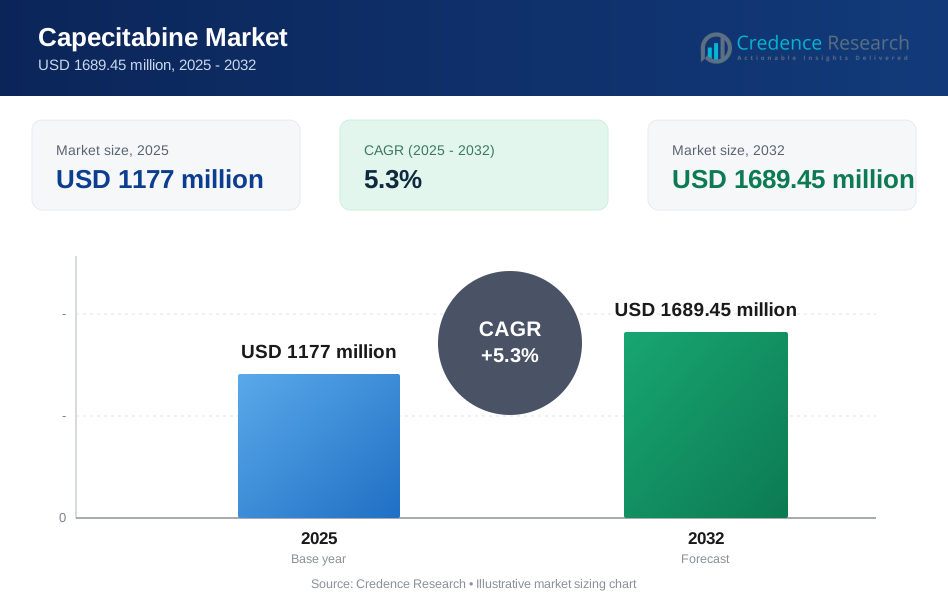
The global Capecitabine Market size was estimated at USD 1177 million in 2025 and is expected to reach USD 1689.45 million by 2032, growing at a CAGR of 5.3% from 2025 to 2032. Growth is primarily driven by sustained use of oral fluoropyrimidine therapy across high-incidence solid tumors where outpatient-friendly regimens support wider adoption across oncology care pathways. The Capecitabine Market continues to benefit from broad generic availability and expanding treatment access across developed and emerging healthcare systems.
| REPORT ATTRIBUTE | DETAILS |
|---|---|
| Historical Period | 2020-2024 |
| Base Year | 2025 |
| Forecast Period | 2026-2032 |
| Capecitabine Market Size 2025 | USD 1177 million |
| Capecitabine Market, CAGR | 5.3% |
| Capecitabine Market Size 2032 | USD 1689.45 million |
Key Market Trends & Insights
- North America accounted for 38.60% in 2025, supported by mature oncology infrastructure and high therapy adoption across major care networks.
- Asia Pacific reached 24.65% in 2025, reflecting improving diagnosis rates and expanding oncology capacity in high-population countries.
- Generic formulations led with 64.4% in 2025, reflecting formulary preference for cost-effective oral chemotherapy options.
- Colorectal cancer represented 40.7% in 2025, supported by large treated populations and continued regimen utilization.
- Hospitals held 47.1% in 2025, supported by centralized initiation, monitoring, and protocol-based chemotherapy management.
Segment Analysis
Capecitabine Market demand is shaped by the clinical preference for oral chemotherapy in settings where infusion capacity and repeated hospital visits create operational and adherence burdens. Oral administration supports outpatient-centric oncology care models, improving convenience for eligible patients and supporting consistent utilization across multi-cycle regimens. Treatment continuity is reinforced by standardized protocols that guide dosing schedules, monitoring, and dose adjustments in routine practice. Capecitabine Market activity is also influenced by payer and provider emphasis on cost-efficiency, which supports sustained uptake where clinical outcomes align with established therapy pathways.
Capecitabine Market segmentation reflects both clinical use cases and practical dispensing patterns across care settings. Indication-based demand is anchored in high-incidence cancers with established chemotherapy regimens, supporting predictable baseline volumes. Formulation dynamics increasingly favor broad-access options as competition intensifies and supply reliability improves across geographies. Dosage strength demand is shaped by dosing flexibility needs, regimen personalization, and tolerability management, supporting ongoing requirements across tablet strengths. Channel and end-user patterns reflect care coordination, reimbursement rules, and refill behaviors across institutional and community settings.
By Indication Insights
Colorectal Cancer accounted for the largest share of 40.7% in 2025. Colorectal Cancer remains the leading indication because treatment pathways commonly incorporate fluoropyrimidine-based regimens across adjuvant and metastatic settings. Oral therapy options support outpatient care and improve practicality for multi-cycle administration. Broad clinical familiarity and structured protocols also support consistent prescribing across major oncology centers.
By Drug Type / Formulation Insights
Generic accounted for the largest share of 64.4% in 2025. Generic dominance is reinforced by strong payer and formulary preference for cost-effective oncology medicines with comparable therapeutic positioning. Wider manufacturer participation improves availability across hospital-linked and retail networks. Competitive pricing and procurement standardization also support sustained adoption across both developed and emerging markets.
By Dosage Strength Insights
150 mg Tablets accounted for the largest share of 58.8% in 2025. Lower-strength tablets support finer dose titration and enable individualized dosing strategies across diverse patient profiles. Dose modifications to manage tolerability can increase the need for flexible tablet combinations in real-world settings. Hospital protocols and oncology pharmacy practices often rely on multiple strengths to match prescribed dosing precisely, supporting recurring demand for 150 mg tablets.
By End User Insights
Hospitals accounted for the largest share of 47.1% in 2025. Hospital oncology units remain central for treatment initiation, regimen selection, and early-cycle monitoring where adverse event management and clinical oversight are critical. Institutional pathways support standardized prescribing and coordinated dispensing, strengthening hospital volume share. Integration with specialty oncology services and multidisciplinary care teams also reinforces hospital-led chemotherapy management.
By Distribution Channel Insights
Distribution channel demand reflects the balance between institution-led dispensing and refill-driven access models for oral oncology medicines. Hospital pharmacies typically anchor first-cycle dispensing and coordinated clinical oversight, supporting adherence and safety monitoring. Retail and online pharmacies gain relevance where payer networks enable refills outside hospital settings and where patient convenience is prioritized. Oncology clinics contribute through integrated dispensing models tied to follow-up visits, monitoring programs, and treatment scheduling.
Capecitabine Market Drivers
Expansion of Outpatient-Oriented Oncology Care
Capecitabine Market growth is supported by the continued shift toward outpatient cancer management where oral regimens reduce dependence on infusion infrastructure. Oral therapy enables broader access across geographies that face capacity constraints for intravenous chemotherapy administration. Care teams value reduced chair-time requirements and improved scheduling flexibility, which can increase throughput in oncology clinics and hospitals. Patient convenience and reduced travel burden can support adherence across multi-cycle therapy plans, sustaining demand across core indications.
- For instance, Roche’s Xeloda, described in clinical literature as a rationally designed oral tumor-activated fluoropyrimidine, was assessed in an outpatient surveillance study involving 735 patients across 161 centers, where it achieved a 35.1% overall response rate, a 64.4% disease control rate, and median progression-free survival of 6.81 months.
Broad Generic Availability and Cost-Driven Procurement
Capecitabine Market momentum is reinforced by strong generic penetration that improves affordability and supports wider reimbursement coverage. Health systems and payers prioritize cost-effective chemotherapy options, especially for long treatment courses and repeat cycles. Multiple suppliers improve supply resilience and reduce disruption risk, supporting consistent utilization in institutional settings. Competitive pricing and procurement standardization also expand access in emerging markets where affordability and budget impact remain key decision variables.
- For instance, the U.S. FDA approved Accord Healthcare’s capecitabine tablets in 150 mg and 500 mg strengths as bioequivalent and therapeutically equivalent to Hoffmann-La Roche’s Xeloda, giving institutional buyers a verified generic substitute in the two standard tablet formats commonly used for dose customization.
High Incidence of Target Cancers and Sustained Treatment Volumes
Capecitabine Market demand is underpinned by continued treatment volumes in cancers where fluoropyrimidine therapy plays a long-standing role. Colorectal and breast cancer pathways frequently involve chemotherapy regimens that support predictable baseline utilization. Increasing screening and earlier diagnosis in several countries can expand treatable populations and extend therapy duration across disease stages. Treatment guidelines and protocol adoption across hospitals and specialty centers also reinforce steady prescribing behavior.
Institutional Protocolization and Care Pathway Standardization
Capecitabine Market utilization benefits from structured protocols that govern dosing, monitoring, and toxicity management, improving prescriber confidence and therapy continuity. Standardized oncology pathways enable coordinated dispensing and follow-up, supporting predictable refill patterns and adherence oversight. Hospital-led programs often integrate laboratory monitoring and supportive care measures, strengthening sustained course completion. The presence of experienced oncology pharmacy teams further supports optimized dosing and regimen execution across diverse patient needs.
Capecitabine Market Challenges
Capecitabine Market expansion is constrained by safety management requirements that demand ongoing monitoring for adverse effects and dose-limiting toxicities. Clinical teams must manage tolerability issues that can lead to dose reductions, interruptions, or regimen switching, affecting therapy continuity in routine practice. Variability in patient compliance across outpatient settings can weaken consistent utilization where follow-up programs are limited. Reimbursement restrictions and prior authorization steps in certain systems can slow initiation timelines and influence channel access decisions.
- For instance, Genentech’s capecitabine was the first drug to receive an FDA Project Renewal labeling update in December 2022, and the revised XELODA label specifies numeric dose-management thresholds: after a second Grade 2 toxicity, treatment resumes at 75% of the current dose; after a third Grade 2 event, at 50%; and patients with creatinine clearance of 30 to 50 mL/min require a 25% starting-dose reduction.
Capecitabine Market competition also intensifies pricing pressure as multiple manufacturers expand supply footprints and compete for formulary positioning. Price erosion can reduce revenue realization even when volume growth remains stable, creating margin challenges for suppliers and distributors. Supply chain disruptions, tender-driven procurement cycles, and country-level regulatory requirements can add volatility to availability across regions. Differences in access to oncology specialists and treatment centers can further limit adoption in under-resourced healthcare environments.
Capecitabine Market Trends and Opportunities
Capecitabine Market opportunities are strengthening through broader integration of oral chemotherapy management programs that improve adherence and monitoring across outpatient care. Digital follow-up models, pharmacy-led counseling, and structured toxicity reporting can improve treatment continuity and reduce discontinuation risk. Expanded specialty pharmacy networks and coordinated dispensing pathways can improve access for patients requiring long-term therapy cycles. These developments support better persistence and can strengthen demand stability across core cancer indications.
- For instance, Roche’s capecitabine (Xeloda) showed sustained adjuvant efficacy in the phase III X-ACT study, which enrolled 1,987 patients with stage III colon cancer and reported outcomes at a median follow-up of 6.9 years, supporting the practicality of long-duration oral chemotherapy use in routine care pathways.
Capecitabine Market trends also include improving access in emerging regions where oncology infrastructure investment increases diagnostic rates and treatment initiation. Expansion of hospital capacity and specialty cancer centers supports wider chemotherapy utilization, including oral regimens that reduce infusion dependency. Partnership models between healthcare providers and pharmacy networks can improve refill access and patient support services. Continued focus on cost-efficient therapies positions oral generics favorably where budget constraints shape procurement decisions.
Regional Insights
North America
Capecitabine Market performance in North America remains anchored by strong oncology infrastructure, high treatment adoption, and mature reimbursement pathways that support consistent utilization of oral chemotherapy regimens. North America accounted for 38.60% in 2025, supported by protocolized care delivery across large hospital networks and specialty oncology providers. High availability of generic options supports broad access and formulary inclusion. Strong monitoring capabilities and supportive care services reinforce adherence and persistence across multi-cycle treatment plans.
Europe
Capecitabine Market demand in Europe is driven by established oncology care systems and broad public reimbursement that support sustained use across major cancer indications. Europe accounted for 26.55% in 2025, supported by standardized treatment pathways and strong clinical adoption across hospital and specialty settings. Emphasis on cost containment supports preference for generic oral therapies where clinical guidelines align. Stable procurement mechanisms and integrated pharmacy services strengthen therapy continuity across outpatient care models.
Asia Pacific
Capecitabine Market expansion in Asia Pacific reflects increasing diagnosis rates, rising oncology capacity, and improving access to chemotherapy across urban and tier-two care centers. Asia Pacific accounted for 24.65% in 2025, supported by growing hospital networks and greater availability of cost-effective formulations. Demand benefits from large patient populations and expanding treatment coverage in several countries. Adoption remains uneven across geographies, but broader infrastructure investment supports continued growth in therapy utilization.
Latin America
Capecitabine Market scale in Latin America is shaped by affordability constraints and uneven access to specialist oncology services across countries. Latin America accounted for 6.05% in 2025, reflecting growth in treatment access within leading urban centers and expanding generic adoption. Reimbursement variability and supply dynamics can influence patient access and channel mix. Expansion of cancer care programs and improving diagnostic reach can support gradual improvement in therapy uptake across priority indications.
Middle East & Africa
Capecitabine Market demand in the Middle East & Africa is influenced by variability in oncology infrastructure, procurement capacity, and specialist availability across countries. Middle East & Africa accounted for 4.15% in 2025, with demand concentrated in higher-resource healthcare systems and urban referral centers. Growth potential is supported by expanding hospital capacity and improving access to essential oncology medicines. Procurement cycles and distribution reach remain key determinants of consistent therapy availability.
Competitive Landscape
Capecitabine Market competition is shaped by a mix of originator positioning and broad-based generic manufacturing where supply reliability, pricing, and distribution coverage influence share outcomes. Manufacturers compete through portfolio breadth in oncology, tender participation, and channel partnerships that improve access across hospital and retail networks. Differentiation also emerges through quality assurance, regulatory compliance capabilities, and ability to serve multi-country supply commitments. Competitive intensity remains high as multiple suppliers seek formulary placements and institutional contracts across regions.
Hoffmann-La Roche Ltd. maintains strong recognition through legacy brand positioning and long-standing clinical adoption, supporting sustained relevance in markets where branded therapy remains preferred in select settings. Roche’s approach is supported by deep oncology expertise and established relationships with hospital networks and oncology specialists. Portfolio strength across oncology categories can support bundling advantages in procurement discussions. Branded positioning remains influenced by reimbursement design, institutional preferences, and country-level procurement frameworks.
The industry research and growth report includes detailed analyses of the competitive landscape of the market and information about key companies, including:
- F. Hoffmann-La Roche Ltd.
- Teva Pharmaceutical Industries Ltd.
- Viatris Inc.
- Hikma Pharmaceuticals plc
- Dr. Reddy’s Laboratories Ltd.
- Sun Pharmaceutical Industries Ltd.
- Aurobindo Pharma Ltd.
- Lupin Limited
- Alkem Laboratories Ltd.
- CHEPLAPHARM Arzneimittel GmbH
Qualitative and quantitative analysis of companies has been conducted to help clients understand the wider business environment as well as the strengths and weaknesses of key industry players. Data is qualitatively analyzed to categorize companies as pure play, category-focused, industry-focused, and diversified; it is quantitatively analyzed to categorize companies as dominant, leading, strong, tentative, and weak.
Recent Developments
- In July 2025, CivicaScript announced the launch of its generic capecitabine in the U.S., expanding access to a lower-cost oral cancer treatment used for colorectal, breast, gastric, esophageal, gastroesophageal junction, and pancreatic cancers. The company said it would offer 500 mg film-coated tablets to pharmacies for $63 per bottle of 120 tablets and recommended a maximum retail price of $84, positioning the launch as an affordability-focused move in the capecitabine market.
- In August 2024, Camber Pharmaceuticals launched Capecitabine Tablets, USP in the U.S. as a generic version of Xeloda, adding the product to its oncology portfolio. This product launch strengthened Camber’s presence in the capecitabine segment by broadening its generic cancer-drug lineup for indications including colorectal cancer.
Report Scope
| Report Attribute | Details |
| Market size value in 2025 | USD 1177 million |
| Revenue forecast in 2032 | USD 1689.45 million |
| Growth rate (CAGR) | 5.3% (2025–2032) |
| Base year | 2025 |
| Forecast period | 2026-2032 |
| Quantitative units | USD million |
| Segments covered | By Indication Outlook: Colorectal Cancer, Breast Cancer, Gastric Cancer, Pancreatic Cancer, Other Cancers; By Drug Type / Formulation Outlook: Branded, Generic; By Dosage Strength Outlook: 150 mg Tablets, 500 mg Tablets; By End User Outlook: Hospitals, Homecare Settings, Specialty Centers, Others; By Distribution Channel Outlook: Hospital Pharmacies, Retail Pharmacies, Online Pharmacies, Oncology Clinics |
| Regional scope | North America, Europe, Asia Pacific, Latin America, Middle East & Africa |
| Key companies profiled | F. Hoffmann-La Roche Ltd.; Teva Pharmaceutical Industries Ltd.; Viatris Inc.; Hikma Pharmaceuticals plc; Dr. Reddy’s Laboratories Ltd.; Sun Pharmaceutical Industries Ltd.; Aurobindo Pharma Ltd.; Lupin Limited; Alkem Laboratories Ltd.; CHEPLAPHARM Arzneimittel GmbH |
| No. of Pages | 328 |
Segmentation
By Indication
- Colorectal Cancer
- Breast Cancer
- Gastric Cancer
- Pancreatic Cancer
- Other Cancers
By Drug Type / Formulation
- Branded
- Generic
By Dosage Strength
- 150 mg Tablets
- 500 mg Tablets
By End User
- Hospitals
- Homecare Settings
- Specialty Centers
- Others
By Distribution Channel
- Hospital Pharmacies
- Retail Pharmacies
- Online Pharmacies
- Oncology Clinics
By Region
- North America
- U.S.
- Canada
- Mexico
- Europe
- Germany
- France
- U.K.
- Italy
- Spain
- Rest of Europe
- Asia Pacific
- China
- Japan
- India
- South Korea
- South-east Asia
- Rest of Asia Pacific
- Latin America
- Brazil
- Argentina
- Rest of Latin America
- Middle East & Africa
- GCC Countries
- South Africa
- Rest of the Middle East and Africa
Request a Free Sample
Fill in your details and we'll send you a free sample report.
- Sample data tables & charts
- Research methodology
Need a Custom Version of This Report?
Tailor the scope, geography, or segments to your exact requirements.
- Custom geography or segment scope
- Direct access to our analyst team
Frequently Asked Questions
What is the market size of the Capecitabine Market in 2025 and the forecast for 2032?
What is the CAGR for the Capecitabine Market during 2025–2032?
Which segment is the largest in the Capecitabine Market?
What factors are driving growth in the Capecitabine Market?
Who are the leading companies in the Capecitabine Market?
Which region leads the Capecitabine Market?
Table of Content
Chapter 1. Report Introduction
- 1.1 Report Description & Purpose
- 1.1.1 Report Title & Market Definition
- 1.1.2 Unique Selling Propositions (USP) & Key Differentiators
- 1.1.3 Value Proposition for Stakeholders
- 1.2 Research Objectives
- 1.2.1 Market Sizing Objectives (Volume & Revenue)
- 1.2.2 Segmentation Objectives
- 1.2.3 Competitive Intelligence Objectives
- 1.2.4 Forecast & Scenario Objectives
- 1.3 Report Scope
- 1.3.1 Capecitabine Scope – Types & Subtypes Covered
- 1.3.2 Geographic Scope – Regions & Countries Covered
- 1.3.3 Historical Period, Base Year & Forecast Period (2025; forecast to 2032)
- 1.3.4 Inclusions & Exclusions
- 1.4 HS Code & Classification Framework
- 1.5 Currency, Units & Pricing Basis
- 1.6 Target Stakeholders
- 1.7 Limitations & Assumptions
Chapter 2. Executive Summary
- 2.1 Global Capecitabine Market Snapshot
- 2.1.1 Market Size – Historical (2025) & Forecast (2025-2032) (2025: USD 1177 million → 2032: USD 1689.45 million)
- 2.1.2 Volume & Revenue – Global Totals
- 2.1.3 Key Market Highlights – Top Five Facts
- 2.2 Capecitabine Market Segmentation Snapshot
- 2.2.1 Market Split by Region – 2025 vs. 2032
- 2.3 Competitive Snapshot
- 2.3.1 Top 10 Players by Revenue Share – 2025
- 2.3.2 Top 10 Players by Volume Share – 2025
- 2.3.3 Recent Strategic Developments (18-Month Summary)
- 2.4 Key Investment Highlights & Strategic Conclusions
Chapter 3. Capecitabine Market Dynamics & Industry Analysis
- 3.1 Market Overview & Context
- 3.1.1 Capecitabine Market Position in the Broader Automotive Value Chain
- 3.1.2 OEM vs. Replacement Market Dynamics
- 3.1.3 Market Maturity & Development Stage by Region
- 3.2 Capecitabine Market Drivers
- 3.3 Capecitabine Market Restraints & Challenges
- 3.4 Capecitabine Market Opportunities
- 3.5 Porter's Five Forces Analysis
- 3.5.1 Threat of New Entrants
- 3.5.2 Bargaining Power of Suppliers
- 3.5.3 Bargaining Power of Buyers
- 3.5.4 Threat of Substitutes
- 3.5.5 Competitive Rivalry – Intensity Assessment
- 3.6 Capecitabine Value Chain Analysis
- 3.6.1 Upstream – Raw Material/Input Suppliers
- 3.6.1.1 Raw Material/Input 1
- 3.6.1.2 Raw Material/Input 2
- 3.6.1.3 Raw Material/Input 3
- 3.6.2 Midstream – Production/Manufacturing/Service Delivery
- 3.6.2.1 Production/Process Overview
- 3.6.2.2 Key Facility Locations & Capacity by Manufacturer
- 3.6.3 Downstream – Distribution & End Consumer
- 3.6.3.1 Primary Channel – B2B/OEM
- 3.6.3.2 Secondary Channels – Dealer, Retail, Online, Direct
- 3.6.4 Value Chain Profitability Analysis
- 3.6.1 Upstream – Raw Material/Input Suppliers
- 3.7 PESTEL Analysis
- 3.7.1 Political Factors
- 3.7.2 Economic Factors
- 3.7.3 Social Factors
- 3.7.4 Technological Factors
- 3.7.5 Environmental Factors
- 3.7.6 Legal Factors
- 3.8 Capecitabine Supply Chain Analysis
- 3.8.1 Raw Material/Input Supply Risk Assessment
- 3.8.2 Manufacturing Concentration Risk (Geographic Exposure)
- 3.8.3 Trade Disruption Impact Analysis
- 3.9 Regulatory & Policy Landscape
Note: The regulatory and policy landscape section covers regulations based on their applicability to the market, Capecitabine category, geography, and scope of the study. Only regulatory frameworks with a material impact on operations, compliance, trade, sustainability, or market access are analyzed in detail.
Chapter 4. Key Investment Pockets & Opportunity Analysis
- 4.1 Capecitabine Market Attractiveness Analysis
- 4.1.1 By Region – Investment Attractiveness Matrix (Volume × CAGR)
- 4.2 Absolute Revenue Growth Opportunity
- 4.2.1 By Region – Absolute USD Growth Through 2032
- 4.3 Incremental Volume Opportunity
- 4.3.1 By Region – Incremental Volume Through 2032
- 4.3.2 Segment – Incremental Volume
- 4.4 Emerging Submarket Opportunity Deep Dive (Subject to Applicability)
- 4.5 Emerging Market Opportunity Scorecards
- 4.5.1 United States
- 4.5.2 Europe
- 4.5.3 Asia
- 4.5.4 Middle East & Africa
Note: Emerging Market Opportunity Scorecards will be included based on relevance and strategic importance. Regions listed are indicative and may vary depending on data availability and market dynamics.
Chapter 5. Capecitabine Import-Export Analysis & Trade Flows
- 5.1 Global Trade Overview
- 5.1.1 Global Export Value by Country (2025)
- 5.1.2 Global Export Volume by Country (2025)
- 5.1.3 Global Import Value by Country (2025)
- 5.1.4 Global Import Volume by Country (2025)
- 5.1.5 Net Trade Balance by Country (2025)
- 5.2 Export Analysis – Segment
- 5.2.1 Type 1 (HS Code)
- 5.2.2 Type 2 (HS Code)
- 5.2.3 Type 3 (HS Code)
- 5.2.4 Type 4 (HS Code)
- 5.2.5 Type 5 (HS Code)
- 5.3 Import Analysis – Segment
- 5.3.1 Type 1 (HS Code)
- 5.3.2 Type 2 (HS Code)
- 5.3.3 Type 3 (HS Code)
- 5.3.4 Type 4 (HS Code)
- 5.3.5 Type 5 (HS Code)
- 5.4 Average Unit Trade Prices
- 5.4.1 Average Export Price – Segment & Country
- 5.4.2 Average Import Price – Segment & Source Country
- 5.4.3 Price Trends (2025)
- 5.5 Key Trade Route Analysis
- 5.5.1 Trade Route 1
- 5.5.2 Trade Route 2
- 5.5.3 Trade Route 3
- 5.5.4 Trade Route 4
- 5.5.5 Trade Route 5
- 5.6 Trade Policy Impact Assessment
- 5.6.1 US Anti-Dumping & Section 301 Tariffs
- 5.6.2 EU Customs Union Impact
- 5.6.3 Major Free Trade Agreements
- 5.6.4 USMCA Rules of Origin
Note: Trade policy analysis will be included only where relevant to the Capecitabine market.
Chapter 6. Competitive Landscape & Company Benchmarking
- 6.1 Capecitabine Market Concentration & Structure
- 6.1.1 Herfindahl-Hirschman Index (HHI) – vs. 2025
- 6.1.2 Tier 1, Tier 2 & Tier 3 Market Structure
- 6.1.3 Global, Regional & Local Player Dynamics
- 6.2 Capecitabine Market Share Analysis – 2025
- 6.2.1 Global Revenue Share by Company
- 6.2.2 Global Volume Share by Company
- 6.2.3 Regional Revenue Share
- 6.2.4 Market Share Evolution ( vs. 2025)
- 6.2.5 OEM Segment Share by Company
- 6.2.6 Replacement Segment Share by Company
- 6.3 Production/Delivery Capacity & Facility Analysis
- 6.3.1 Global Installed Capacity
- 6.3.2 Capacity Utilization Rates
- 6.3.3 Production/Output Volume
- 6.3.4 Facility Locations & Capacity Map
- 6.3.5 Planned Capacity Additions
- 6.4 Capecitabine Competitive Benchmarking Matrix
- 6.4.1 Revenue, Volume, CAGR & Profitability Comparison
- 6.4.2 Channel Revenue Mix
- 6.4.3 Geographic Revenue Exposure
- 6.4.4 R&D Intensity
- 6.4.5 Sustainability Maturity
- 6.5 Strategic Developments in Capecitabine (Last 24 Months)
- 6.5.1 Mergers, Acquisitions & Divestments
- 6.5.2 New Capecitabine Launches
- 6.5.3 Facility Expansions
- 6.5.4 Strategic Alliances, Joint Ventures & Partnerships
- 6.5.5 Distribution Expansion & Market Entry
- 6.5.6 Sustainability & ESG Initiatives
- 6.6 Competitive Strategy Mapping
- 6.6.1 Leader, Challenger, Follower & Niche Classification
- 6.6.2 Pricing Strategy Comparison
- 6.6.3 Channel Strategy Matrix
Note: Strategic developments are included based on their materiality and the availability of reliable information.
Chapter 7. Global Capecitabine Market – By Distribution Channel
- 7.1 Segment Overview
- 7.1.1 Volume & Revenue Split by Channel (2025 & 2032)
- 7.1.2 Channel Mix Evolution (2025-2032)
Chapter 8. Regional Market Analysis – Global Overview
- 8.1 Global Regional Overview
- 8.1.1 Regional Volume Share
- 8.1.2 Regional Revenue Share
- 8.1.3 Regional Volume by Region
- 8.1.4 Regional Revenue by Region
- 8.1.5 Regional Forecast Through 2032
- 8.2 Cross-Regional Segment Analysis
- 8.2.1 By Distribution Channel
- 8.2.2 By Brand/Price Tier
Chapter 9. North America Capecitabine Market
- 9.1 United States
- 9.2 Canada
- 9.3 Mexico
Chapter 10. Europe Capecitabine Market
- 10.1 Germany
- 10.2 France
- 10.3 Italy
- 10.4 United Kingdom
- 10.5 Spain
- 10.6 Poland
- 10.7 Russia
- 10.8 Netherlands
- 10.9 Belgium
- 10.10 Sweden
- 10.11 Denmark
- 10.12 Norway
- 10.13 Rest of Europe
Chapter 11. Asia Pacific Capecitabine Market
- 11.1 China
- 11.2 India
- 11.3 Japan
- 11.4 South Korea
- 11.5 Thailand
- 11.6 Indonesia
- 11.7 Vietnam
- 11.8 Malaysia
- 11.9 Australia
- 11.10 Rest of Asia Pacific
Chapter 12. Latin America Capecitabine Market
- 12.1 Brazil
- 12.2 Argentina
- 12.3 Colombia
- 12.4 Chile
- 12.5 Rest of Latin America
Chapter 13. Middle East Capecitabine Market
- 13.1 Saudi Arabia
- 13.2 United Arab Emirates
- 13.3 Turkey
- 13.4 Israel
- 13.5 Iran
- 13.6 Rest of the Middle East
Chapter 14. Africa Capecitabine Market
- 14.1 South Africa
- 14.2 Egypt
- 14.3 Nigeria
- 14.4 Morocco
- 14.5 Rest of Africa
Chapter 15. Capecitabine Company Profiles
- 15.1 [Company 01]
- 15.1.1 Company Overview
- 15.1.2 Key Management Personnel
- 15.1.3 Products & Services Portfolio
- 15.1.4 Financial Performance
- 15.1.5 Key Market Focus & Geographic Presence
- 15.1.6 Recent Developments & Strategic Initiatives
Note: The company profile list is preliminary and may change based on research findings, market developments, data availability, and client requirements.
Chapter 16. Appendices
- Appendix A – List of Abbreviations & Acronyms
- Appendix B – Industry Classification Code Reference – Full Series
- Appendix C – Production & Capacity Data Tables
- Appendix D – End-Use & Demand Base Tables
- Appendix E – Consumption & Replacement Rate Assumptions
- Appendix F – ASP Reference Tables
- Appendix G – Manufacturing & Facility Database
- Appendix H – Import-Export Data Tables
- Appendix I – Regulatory Summary Tables
- Appendix J – Primary Research Participant List (Anonymized)
- Appendix K – Primary Research Questionnaire Framework
- Appendix L – Data Sources & Bibliography
- Appendix M – Market Size Divergence & Source Comparison
Chapter 17. Research Methodology
- 17.1 Research Framework & Philosophy
- 17.2 Secondary Research – Sources, Hierarchy & Data Extraction
- 17.3 Data Modeling – Bottom-Up & Top-Down Market Sizing
- 17.4 Primary Research – Stakeholder Framework, LOI & Sample Sizes
- 17.5 Forecast Methodology – Regression, Scenario & Sensitivity Analysis
- 17.6 Quality Control – Four-Layer Validation Framework
- 17.7 Limitations & Standard Assumptions
- 17.8 Disclaimer
