Market Overview:
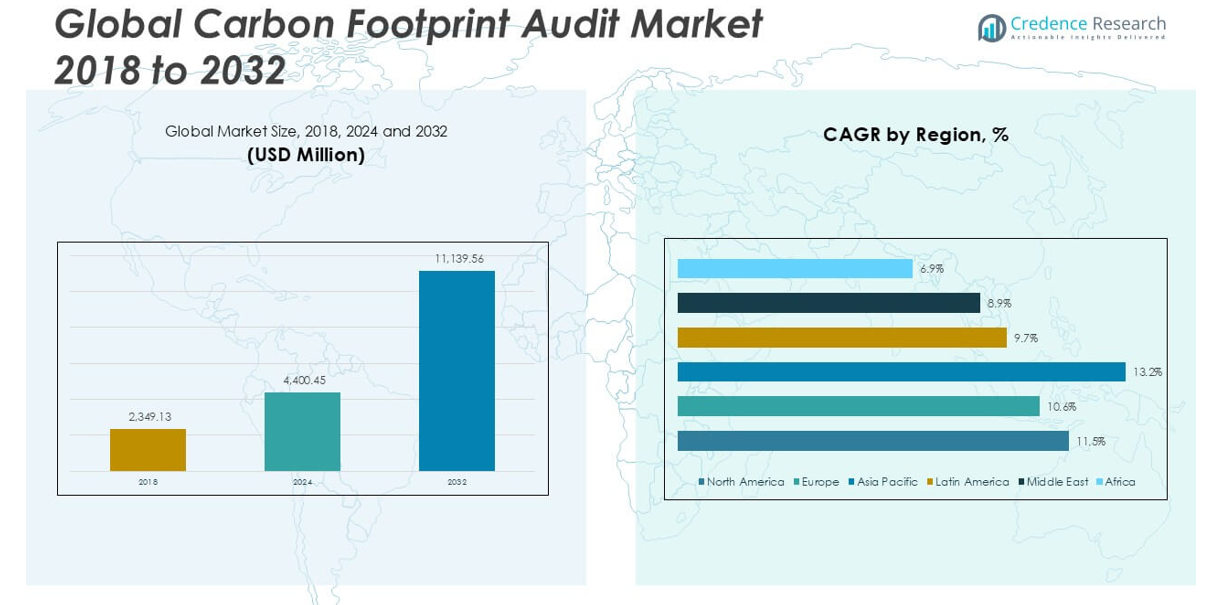
The Global Carbon Footprint Reduction Market size was valued at USD 2,492.81 million in 2018 to USD 5,989.04 million in 2024 and is anticipated to reach USD 20,880.19 million by 2032, at a CAGR of 16.57% during the forecast period.
| REPORT ATTRIBUTE |
DETAILS |
| Historical Period |
2020-2023 |
| Base Year |
2024 |
| Forecast Period |
2025-2032 |
| Carbon Footprint Reduction Market Size 2024 |
USD 5,989.04 million |
| Carbon Footprint Reduction Market, CAGR |
16.57% |
| Carbon Footprint Reduction Market Size 2032 |
USD 20,880.19 million |
This market experiences robust growth due to global decarbonization efforts, stringent government regulations, and heightened corporate responsibility toward climate change. Companies across sectors are adopting low-carbon technologies, energy-efficient systems, and sustainable materials to meet carbon neutrality goals. The transition to renewable energy sources, electrification of transportation, and increasing investments in carbon capture and offsetting solutions are driving market momentum. Heightened consumer awareness and pressure from stakeholders further compel organizations to adopt aggressive emission reduction strategies.
Regionally, North America and Europe are leading the market due to strong regulatory frameworks, government incentives, and early adoption of climate-resilient technologies. The Asia-Pacific region is emerging rapidly, driven by urbanization, industrial growth, and policy shifts in countries like China, India, and Japan toward cleaner energy alternatives. Latin America and the Middle East are gradually integrating carbon reduction initiatives, influenced by international climate commitments and the growing emphasis on sustainable development.
Market Insights:
- The Global Carbon Footprint Reduction Market was valued at USD 2,492.81 million in 2018, reached USD 5,989.04 million in 2024, and is projected to hit USD 20,880.19 million by 2032, growing at a CAGR of 16.57%.
- Stringent government regulations and international climate agreements are compelling industries to invest in emission reduction technologies.
- Corporations are adopting ESG frameworks and committing to net-zero targets, boosting demand for carbon management solutions.
- High capital costs and long return-on-investment cycles hinder adoption in cost-sensitive sectors and developing economies.
- Inconsistent carbon accounting standards and data reliability issues limit transparency and cross-sector comparability.
- North America and Europe lead due to mature regulatory structures and early technological adoption.
- Asia-Pacific is emerging as a high-growth region driven by rapid industrialization and increasing policy support for low-carbon initiatives.
Access crucial information at unmatched prices!
Request your sample report today & start making informed decisions powered by Credence Research Inc.!
Download Sample
Market Drivers:
Governmental Climate Policies and Decarbonization Mandates Accelerate Market Expansion:
Governments worldwide are enforcing strict emissions regulations and climate targets to address rising greenhouse gas levels. These policies compel industries to reduce their carbon intensity through energy efficiency, cleaner fuels, and sustainable operations. The Global Carbon Footprint Reduction Market benefits from public investment in low-emission infrastructure and climate-smart projects. Nations participating in international frameworks like the Paris Agreement drive national initiatives to meet carbon neutrality targets. Tax incentives, subsidies, and emission trading schemes further encourage corporate compliance. Regulatory pressure aligns closely with ESG mandates, pushing companies to transform energy use and supply chains. Public-private partnerships also foster scalable carbon reduction programs. It grows in direct response to the alignment of national policies with global sustainability goals.
- For instance, Siemens AG’s 2024 partnership with the UK government on the “Decarbonizing Railways” initiative is detailed in Siemens’ public sustainability filings. The project retrofitted 108 miles of UK railway track with Siemens’ smart grid and electrification systems, resulting in a documented annual displacement of 88,000 tons of diesel fuel. Siemens’ environmental dashboards provide real-time emissions tracking for the project, as described in the company’s published sustainability and impact assessment reports.
Rising Corporate Accountability and ESG Commitments Drive Market Demand:
Businesses are integrating carbon reduction into core strategies to meet stakeholder expectations and enhance brand credibility. Investors are demanding greater environmental transparency, pushing firms to disclose emissions and adopt verifiable reduction plans. The Global Carbon Footprint Reduction Market thrives on this shift, with companies leveraging advanced analytics and carbon accounting platforms. Green procurement, eco-design, and operational efficiency become vital elements of ESG strategies. Supply chain emissions receive increased scrutiny, prompting collaborations with low-carbon suppliers. Multinational corporations are adopting science-based targets and pledging net-zero goals. It gains momentum as businesses invest in clean technologies to remain competitive. Boards and leadership teams prioritize decarbonization to manage regulatory risks and secure long-term value.
- For instance, in February 2024, Unilever reported that 76 supplier facilities joined their “Climate Program” and collectively reduced Scope 3 emissions by over 760,000 metric tons CO₂e, primarily through supplier disclosure via the CDP (formerly Carbon Disclosure Project) platform and transitioning procurement to biogenic and recycled materials, as detailed in Unilever’s annual ESG report and supplier engagement case studies.
Technological Innovation Catalyzes Efficient Carbon Management Solutions:
Advanced technologies transform carbon management from a compliance task to a strategic capability. AI, blockchain, and IoT tools enable real-time emissions monitoring and traceability across industrial operations. The Global Carbon Footprint Reduction Market expands as demand grows for digital platforms that optimize carbon audits and reporting. Clean energy systems, such as solar, wind, and hydrogen, replace legacy infrastructure. Carbon capture, utilization, and storage (CCUS) technologies gain traction in high-emitting sectors. Smart energy grids and decentralized renewable generation promote energy independence and emission control. It integrates innovation to support predictive modelling, scenario planning, and mitigation strategies. The convergence of automation and sustainability strengthens the market’s value proposition across sectors.
Growing Public Awareness and Eco-conscious Consumption Shape Market Landscape:
Consumers increasingly choose brands aligned with climate responsibility and sustainable practices. This behavioral shift forces companies to evaluate product lifecycles and reduce emissions across packaging, transportation, and manufacturing. The Global Carbon Footprint Reduction Market benefits from this shift in preferences, as businesses invest in climate-positive branding and carbon labeling. Governments support these trends through green certification programs and sustainable procurement policies. Eco-conscious behavior influences sectors like retail, food, automotive, and travel. Educational campaigns and media coverage intensify consumer demand for emission-reducing actions. It builds public trust by aligning climate communication with measurable outcomes. Retailers and service providers that prioritize emission reductions gain loyalty and reputational advantage.
Market Trends:
Integration of Carbon Management Platforms with Enterprise Resource Planning (ERP):
Companies are embedding carbon footprint analytics into core ERP systems to enhance visibility and decision-making. The integration streamlines emissions tracking across facilities, fleets, and product lines. The Global Carbon Footprint Reduction Market incorporates this trend to support real-time carbon accounting and supply chain transparency. Enterprise platforms now include sustainability modules to facilitate audits, reporting, and compliance with global standards. Automation reduces manual tracking and enhances accuracy. AI-driven tools identify emissions hotspots and simulate reduction scenarios. This alignment of carbon and financial data improves internal accountability. It helps executives align emission targets with operational KPIs and investment planning.
- For instance, in November 2023, SAP launched its SAP Sustainability Control Tower, which enabled Walmart to automatically collect and monitor carbon emissions from over 4,600 U.S. stores in real-time. SAP’s technical white paper confirms that store-by-store data is now integrated into Walmart’s enterprise reporting, supporting granular emission reduction planning and year-over-year disclosure to stakeholders.
Adoption of Carbon Offsetting and Credit Trading Platforms Gains Momentum:
Companies unable to eliminate emissions entirely are adopting offsetting strategies through verified carbon credits. These programs fund renewable energy, reforestation, and methane capture projects. The Global Carbon Footprint Reduction Market incorporates blockchain and digital registries to ensure credit traceability and authenticity. Voluntary carbon markets are expanding with increased corporate participation. Organizations use offset portfolios to meet internal climate goals while supporting global decarbonization. Marketplaces for carbon credits are becoming more standardized and accessible. It enables enterprises to participate in trading systems aligned with science-based targets. This trend creates new revenue streams for offset providers and drives accountability in emissions finance.
- For instance, Shell Energy’s 2024 launch of the Shell Energy Carbon Platform completed more than 42 million carbon credit transactions on a blockchain-powered registry. Certified by Verra and Gold Standard, credits are fully traceable via real-time dashboards, as documented in Shell’s annual Sustainability Report and technical product release documentation.
Sector-specific Decarbonization Frameworks Expand Across Industries:
Industry associations are developing tailored decarbonization roadmaps to align operations with emission targets. Steel, cement, aviation, and shipping sectors are adopting frameworks focused on fuel switching, process redesign, and waste heat recovery. The Global Carbon Footprint Reduction Market responds by offering specialized solutions aligned with industry benchmarks. Sector-based alliances and innovation hubs promote knowledge sharing and coordinated climate action. Companies use these frameworks to define achievable milestones and compliance standards. It strengthens sector resilience and investment flow into scalable low-carbon technologies. Benchmarking tools help assess progress and prioritize cost-effective interventions across value chains.
Urban Sustainability and Net-Zero Infrastructure Projects Gain Traction:
Cities are adopting net-zero strategies to address rising emissions from transportation, buildings, and energy systems. Urban policymakers invest in green transit, retrofitting, and district energy networks. The Global Carbon Footprint Reduction Market supports this shift through partnerships with municipalities and urban planners. Projects integrate smart lighting, electric vehicle infrastructure, and sustainable construction materials. These developments create localized demand for carbon tracking and performance tools. It facilitates cross-sector collaboration and accelerates policy-driven innovation. Urban decarbonization becomes a testbed for scalable climate solutions across regions.
Market Challenges Analysis:
High Capital Costs and Limited ROI Delays Market Adoption in Some Sectors:
Initial investments in carbon reduction technologies remain high, especially for small and medium enterprises. Renewable energy infrastructure, advanced analytics platforms, and CCUS systems often involve long payback periods. The Global Carbon Footprint Reduction Market faces resistance from companies prioritizing short-term financial returns. Regulatory inconsistency across regions adds further hesitation, making it difficult for businesses to justify large-scale implementation. Financing options are limited in emerging economies, restricting access to innovation. Operational disruptions during retrofitting and system changes reduce appetite for adoption. It faces difficulty in penetrating sectors with tight margins or outdated infrastructure. High-risk perceptions further slow market maturity.
Lack of Standardization and Data Gaps Hinder Accurate Carbon Accounting:
Many companies struggle with inconsistent carbon accounting methodologies across regions and sectors. Absence of universal reporting frameworks limits comparability and credibility of emission disclosures. The Global Carbon Footprint Reduction Market encounters fragmented guidelines, which complicate corporate decision-making. Legacy systems and poor data integration restrict real-time emissions tracking. It impacts transparency in voluntary carbon markets and investor confidence in ESG metrics. Smaller firms often lack the expertise and resources to implement reliable measurement tools. Verification challenges create compliance risks, especially for multinationals. Regulatory clarity and technical guidance remain uneven globally.
Market Opportunities:
Expansion of Renewable Energy and Electrification Opens Scalable Reduction Pathways:
Widespread adoption of solar, wind, and hydropower technologies offers scalable emission reduction at national and corporate levels. The Global Carbon Footprint Reduction Market captures new value from the electrification of fleets, buildings, and industrial systems. Integration of clean energy into manufacturing and logistics creates major decarbonization potential. Governments incentivize transition through feed-in tariffs and renewable mandates. It attracts green financing and infrastructure development across both advanced and emerging markets.
Emerging Digital Tools and Carbon Intelligence Platforms Enhance Market Accessibility:
Advancements in digital sustainability tools simplify access to carbon footprint analytics for SMEs and start-ups. Cloud-based platforms reduce costs and technical barriers to entry. The Global Carbon Footprint Reduction Market leverages these innovations to reach underpenetrated sectors. Smart dashboards, APIs, and mobile apps improve user experience and scalability. It accelerates widespread adoption by reducing complexity and implementation time.
Market Segmentation Analysis:
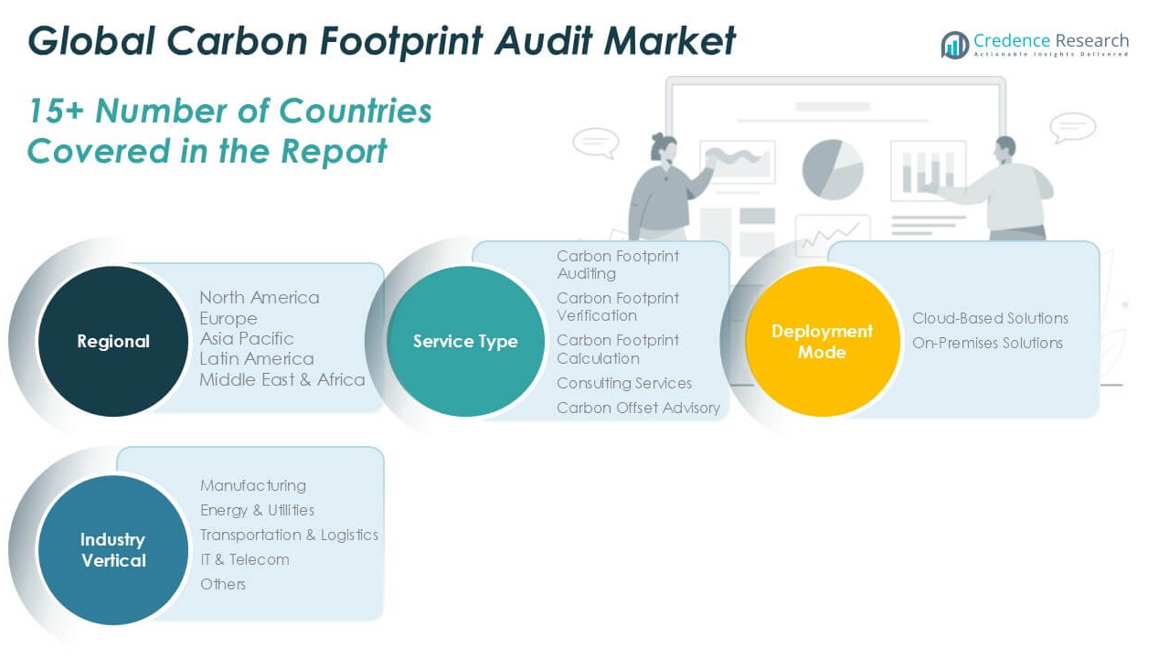
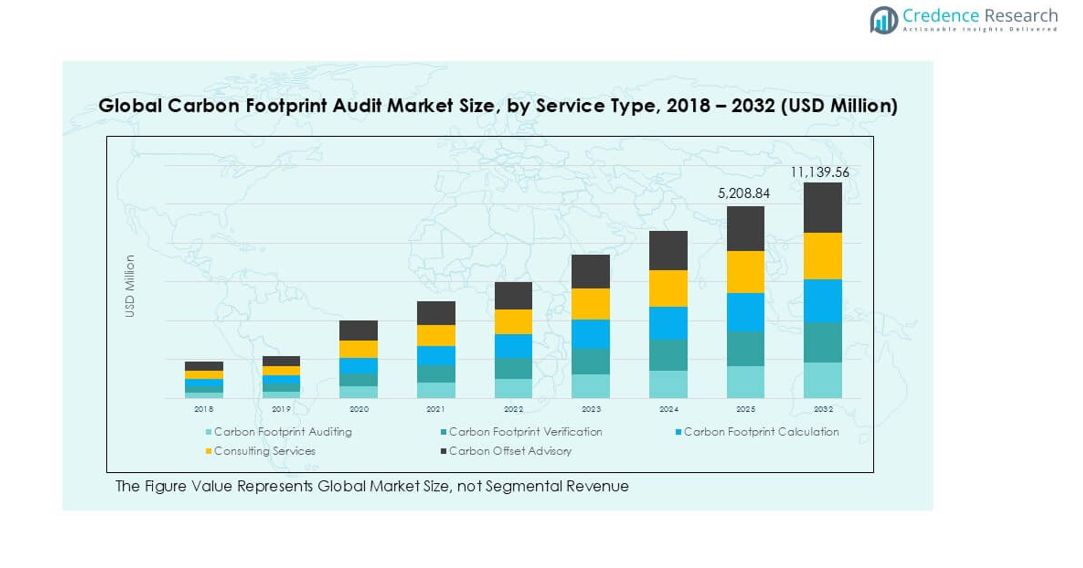
By Solution Type
The Global Carbon Footprint Reduction Market is segmented by solution type into carbon offset projects, energy efficiency solutions, renewable energy, and sustainable transportation. Carbon offset projects lead the segment due to their widespread use in meeting both regulatory and voluntary climate targets. Energy efficiency solutions are seeing strong adoption in industrial and commercial facilities where reducing energy consumption aligns with cost and sustainability goals. Renewable energy is expanding rapidly with global deployment of solar, wind, and hydropower to transition away from fossil fuels. Sustainable transportation is gaining pace through electrification of vehicles and development of low-emission transit networks, supported by infrastructure and policy incentives.
- For instance, ENGIE’s 2024 operational report records 6,400 megawatts of newly installed renewable energy capacity, with generation metrics and grid displacement figures independently verified in ENGIE’s investor and sustainability filings. Schneider Electric’s digital solutions case studies show EcoStruxure upgrades installed at over 1,200 industrial sites, with metered reductions in energy consumption tracked via on-site digital meters and confirmed reduction statements.
By End User
By end user, the market includes corporates, government, residential, and non-profit organizations. Corporates represent the largest segment due to rising ESG pressures, net-zero ambitions, and the integration of decarbonization into long-term business strategy. Governments contribute through regulatory mandates, public infrastructure development, and national climate programs. The residential segment is growing steadily with increased adoption of rooftop solar, electric mobility, and energy-saving devices. Non-profit organizations influence the market by supporting climate education, community engagement, and accessibility to reduction programs. It evolves through the collective actions of these groups to meet global sustainability benchmarks.
- For instance, in 2023, Tesla Energy reported over 430,000 new Powerwall and solar roof deployments supporting household and small business emission reductions across North America and Europe, as confirmed in Tesla’s quarterly installation results. In the non-profit segment, The Nature Conservancy managed reforestation projects covering 820,000 acres, generating 3.4 million independently certified carbon credits in a single calendar year, as disclosed on their project performance dashboard.
Segmentation:
By Solution Type
- Carbon Offset Projects
- Energy Efficiency Solutions
- Renewable Energy
- Sustainable Transportation
By End User
- Corporates
- Government
- Residential
- Non-Profit Organizations
By Region
- North America
- Europe
- UK
- France
- Germany
- Italy
- Spain
- Russia
- Rest of Europe
- Asia Pacific
- China
- Japan
- South Korea
- India
- Australia
- Southeast Asia
- Rest of Asia Pacific
- Latin America
- Brazil
- Argentina
- Rest of Latin America
- Middle East
- GCC Countries
- Israel
- Turkey
- Rest of Middle East
- Africa
- South Africa
- Egypt
- Rest of Africa
Regional Analysis:
North America
The North America Carbon Footprint Reduction Market size was valued at USD 1,065.01 million in 2018 to USD 2,531.56 million in 2024 and is anticipated to reach USD 8,851.09 million by 2032, at a CAGR of 16.6% during the forecast period. North America holds the largest market share, contributing approximately 42.4% to the Global Carbon Footprint Reduction Market in 2024. The region leads due to early regulatory initiatives, strong climate policy enforcement, and widespread adoption of clean technologies. Federal and state-level programs in the U.S. offer tax credits, subsidies, and grants for renewable energy, carbon capture, and electric vehicles. Corporates in the region actively pursue net-zero targets, supported by robust ESG investment. Canada emphasizes carbon pricing and nationwide decarbonization frameworks, while Mexico aligns with international agreements to strengthen its carbon strategy. Public-private partnerships help scale innovation and infrastructure projects. It gains traction through policy coherence, financial incentives, and mature technology ecosystems.
Europe
The Europe Carbon Footprint Reduction Market size was valued at USD 735.95 million in 2018 to USD 1,706.89 million in 2024 and is anticipated to reach USD 5,616.83 million by 2032, at a CAGR of 15.7% during the forecast period. Europe accounts for around 28.5% of the Global Carbon Footprint Reduction Market share in 2024. The European Union’s Green Deal, Fit for 55 package, and emissions trading system are driving forces behind regional decarbonization. Germany, France, and the UK lead in low-carbon infrastructure and technology innovation. The market benefits from consistent regulatory alignment, mandatory corporate disclosures, and aggressive renewable targets. Investments in hydrogen, smart grids, and circular economy projects create strong momentum. Public support and awareness also drive residential and commercial carbon reduction. It advances steadily, supported by innovation hubs, policy integration, and cross-border collaboration.
Asia Pacific
The Asia Pacific Carbon Footprint Reduction Market size was valued at USD 461.74 million in 2018 to USD 1,205.98 million in 2024 and is anticipated to reach USD 4,781.67 million by 2032, at a CAGR of 18.4% during the forecast period. Asia Pacific represents nearly 20.1% of the Global Carbon Footprint Reduction Market share in 2024 and is the fastest-growing region. China leads in renewable energy deployment and carbon market development. Japan and South Korea focus on clean hydrogen, smart energy, and zero-emission mobility. India scales solar infrastructure and energy efficiency initiatives across industries and cities. Government mandates and multilateral financing fuel large-scale decarbonization efforts. Rapid urbanization, rising energy demand, and policy transitions drive demand for carbon management solutions. It expands rapidly through public investment, industrial transformation, and growing awareness of climate risks.
Latin America
The Latin America Carbon Footprint Reduction Market size was valued at USD 117.75 million in 2018 to USD 279.37 million in 2024 and is anticipated to reach USD 862.08 million by 2032, at a CAGR of 14.8% during the forecast period. Latin America contributes about 4.7% to the Global Carbon Footprint Reduction Market in 2024. Brazil, Chile, and Colombia promote renewable energy, low-emission transportation, and deforestation control. The market receives support from international funding agencies and climate resilience programs. Regional governments implement national climate plans and integrate emission tracking into infrastructure and energy projects. Businesses are increasingly adopting carbon offsets and voluntary reduction commitments. Public awareness is rising, especially in urban areas. It grows through multilateral cooperation, resource diversification, and targeted policy actions across high-emission sectors.
Middle East
The Middle East Carbon Footprint Reduction Market size was valued at USD 72.60 million in 2018 to USD 160.01 million in 2024 and is anticipated to reach USD 474.32 million by 2032, at a CAGR of 14.2% during the forecast period. The region holds approximately 2.7% of the Global Carbon Footprint Reduction Market share in 2024. Countries like the UAE and Saudi Arabia are investing heavily in renewable energy, green hydrogen, and sustainable city initiatives. National visions and diversification plans prioritize emission reduction and clean technology deployment. Oil and gas companies are under pressure to adopt decarbonization strategies. The market benefits from sovereign green funds and public-private pilot projects. Adoption remains moderate across smaller economies, limited by policy and funding gaps. It advances where climate strategies align with economic transformation agendas and global sustainability frameworks.
Africa
The Africa Carbon Footprint Reduction Market size was valued at USD 39.76 million in 2018 to USD 105.23 million in 2024 and is anticipated to reach USD 294.20 million by 2032, at a CAGR of 13.4% during the forecast period. Africa accounts for nearly 1.8% of the Global Carbon Footprint Reduction Market in 2024. South Africa leads regional efforts with renewable energy programs, carbon taxes, and industrial decarbonization plans. Egypt and Kenya are developing solar and wind energy hubs supported by international partnerships. The region faces barriers such as limited financing, weak policy enforcement, and infrastructure gaps. Climate vulnerability drives interest in sustainable agriculture and clean cooking technologies. Governments collaborate with donors and NGOs to expand access to carbon offset projects. It shows potential through low-carbon development paths and growing climate advocacy in national policies.
Shape Your Report to Specific Countries or Regions & Enjoy 30% Off!
Key Player Analysis:
- Indo-German Energy Forum (IGEF)
- Carbon Credit Capital
- Greenko Group
- Gensol Group
- Grow Billion Trees Partners
- South Pole
- ClimatePartner
- 3Degrees
- TerraPass
- Watershed
Competitive Analysis:
The Global Carbon Footprint Reduction Market features a mix of multinational corporations, regional players, and sustainability-focused startups. Key companies compete on the basis of solution effectiveness, scalability, and alignment with regulatory frameworks. Leading firms offer comprehensive services spanning carbon offsetting, energy efficiency, and renewable integration. Market players such as South Pole, Greenko Group, and ClimatePartner strengthen their positions through strategic collaborations and technology integration. It attracts new entrants with niche digital tools for emissions tracking and carbon intelligence. Companies invest in R&D to enhance accuracy, traceability, and real-time reporting capabilities. Competitive differentiation depends on cost-efficiency, innovation, and strong ESG alignment.
Recent Developments:
- In January 2025, Gensol Engineering announced securing 30,000 pre-orders for its newly launched electric vehicles at the Bharat Mobility Global Expo. However, regulatory investigations later found substantial inconsistencies, including lower-than-claimed fulfillment numbers, alleged fund diversion, and SEBI’s order restricting key promoters from holding directorial roles. This regulatory intervention, coupled with loan defaults and insolvency proceedings filed by IREDA, has cast significant uncertainty over Gensol’s future operations, as detailed in major Indian business media reports.
- As of March 2025, collaborative reforestation initiatives among U.S. and Indian partners, including Grow Billion Trees, have collectively planted millions of trees. For example, the Keystone 10 Million Trees Partnership, with similar mission alignment, surpassed 8.2 million new trees planted in Pennsylvania and is on track to reach its 10 million tree target by the end of 2025. Such efforts involve hundreds of organizations working toward large-scale, data-backed nature restoration.
- In February 2025, Lely announced the expansion of its CO₂ offset program through new partnerships with ClimatePartner and Klim. This collaboration empowers Lely to certify and offset emissions across its global operations, using ClimatePartner’s transparent climate project registry and offset tracking systems. The partnership includes joint verification and certification for projects in sustainable agriculture, supporting both emissions reduction and regenerative farming.
- In April 2023, 3Degrees secured a $60 million line of credit from Citi to accelerate its global decarbonization support programs. This agreement allows 3Degrees to scale its climate solutions portfolio for multinational corporate clients and expand operations across North America, Europe, and Asia, aiming to provide market access and climate action tools for a wide spectrum of organizations.
Market Concentration & Characteristics:
The Global Carbon Footprint Reduction Market is moderately concentrated, with several dominant players influencing global trends through partnerships, acquisitions, and innovation. It exhibits strong cross-sector applicability, with solutions tailored for corporates, governments, and residential users. The market is characterized by technological innovation, policy-driven growth, and high stakeholder engagement. Companies compete on precision, integration ease, and regulatory alignment. Demand remains driven by ESG mandates, climate targets, and digital transformation.
Report Coverage:
The research report offers an in-depth analysis based on Solution Type and End User. It details leading market players, providing an overview of their business, product offerings, investments, revenue streams, and key applications. Additionally, the report includes insights into the competitive environment, SWOT analysis, current market trends, as well as the primary drivers and constraints. Furthermore, it discusses various factors that have driven market expansion in recent years. The report also explores market dynamics, regulatory scenarios, and technological advancements that are shaping the industry. It assesses the impact of external factors and global economic changes on market growth. Lastly, it provides strategic recommendations for new entrants and established companies to navigate the complexities of the market.
Future Outlook:
- Corporate demand for ESG compliance and net-zero commitments will drive sustained investment in carbon reduction technologies.
- Governments will continue strengthening emission regulations, creating favorable policy environments across industries.
- Digital platforms for real-time carbon tracking and reporting will see increased integration across enterprise systems.
- Carbon credit trading and offset markets will mature, supported by blockchain and verified registry systems.
- Decentralized renewable energy adoption will grow, particularly in developing regions aiming for energy independence.
- Electric mobility and low-emission transport infrastructure will accelerate, reducing sectoral emissions.
- Carbon capture, utilization, and storage (CCUS) technologies will expand in heavy industry and energy sectors.
- Urban development will increasingly align with net-zero building codes and sustainable infrastructure models.
- Innovation in sustainable materials and eco-friendly manufacturing processes will enhance product-level reductions.
- Strategic partnerships between governments, corporations, and NGOs will scale global climate action initiatives.


