
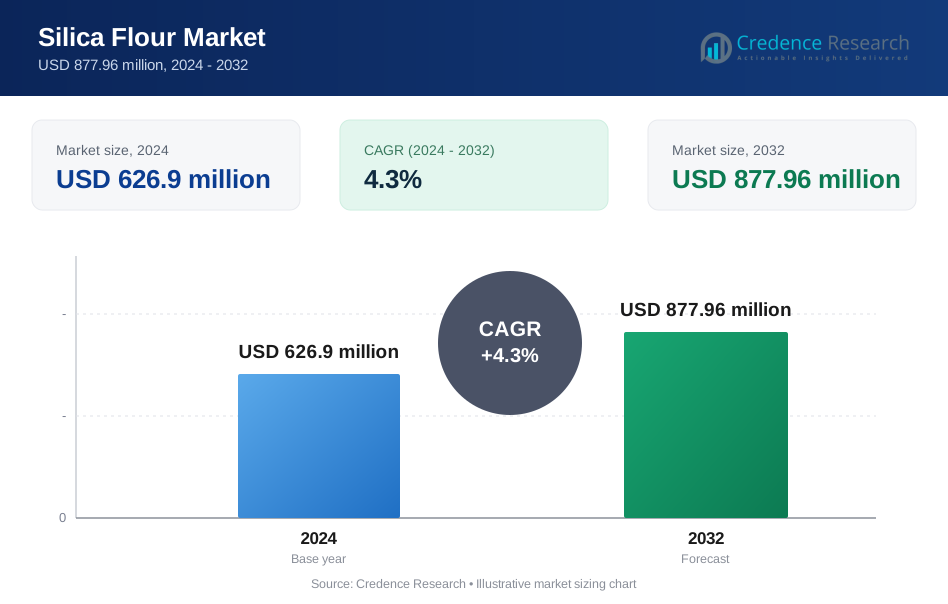
Silica Flour Market was valued at USD 626.9 million in 2024 and is anticipated to reach USD 877.96 million by 2032, growing at a CAGR of 4.3% during the forecast period.
| REPORT ATTRIBUTE | DETAILS |
|---|---|
| Historical Period | 2020-2023 |
| Base Year | 2024 |
| Forecast Period | 2025-2032 |
| Silica Flour Market Size 2024 | USD 626.9 Million |
| Silica Flour Market, CAGR | 4.3% |
| Silica Flour Market Size 2032 | USD Million |
The Silica Flour Market features strong competition among leading manufacturers focused on product innovation, purity enhancement, and regional expansion. Major players include Sibelco (Belgium), Finore Minerals LLP (India), Sil Industrial Minerals (Canada), Adwan Chemical Industries Co. Ltd. (Saudi Arabia), Euroquarz GmbH (Germany), AGSCO Corporation (U.S.), Fineton Industrial Minerals Limited (Hong Kong), U.S. Silica Holdings, Inc. (U.S.), Capital Sand Company (U.S.), and Hoben International Ltd. (UK). These companies prioritize customized silica grades for applications in glassmaking, foundry casting, and industrial coatings. North America leads the global Silica Flour Market with a 36% market share, supported by advanced manufacturing capabilities and strong demand from glass and construction industries. Europe and Asia-Pacific follow, driven by infrastructure growth and rising use in ceramics and paints.
Market Insights
- The Silica Flour Market was valued at USD 626.9 million in 2024 and is projected to reach USD 877.96 million by 2032, growing at a CAGR of 4.3% during the forecast period.
- Growing demand from glass, paints, and ceramics industries drives the market as silica flour enhances durability, strength, and heat resistance.
- The market trend favors high-purity grades for solar glass and semiconductor manufacturing, supporting advanced industrial applications.
- Leading players such as Sibelco, U.S. Silica Holdings, and Adwan Chemical Industries are expanding production capacity and investing in refining technologies to maintain competitiveness.
- North America dominates with a 36% regional share, followed by Europe and Asia-Pacific, while the glass manufacturing segment holds a 28% market share due to strong construction and renewable energy growth.
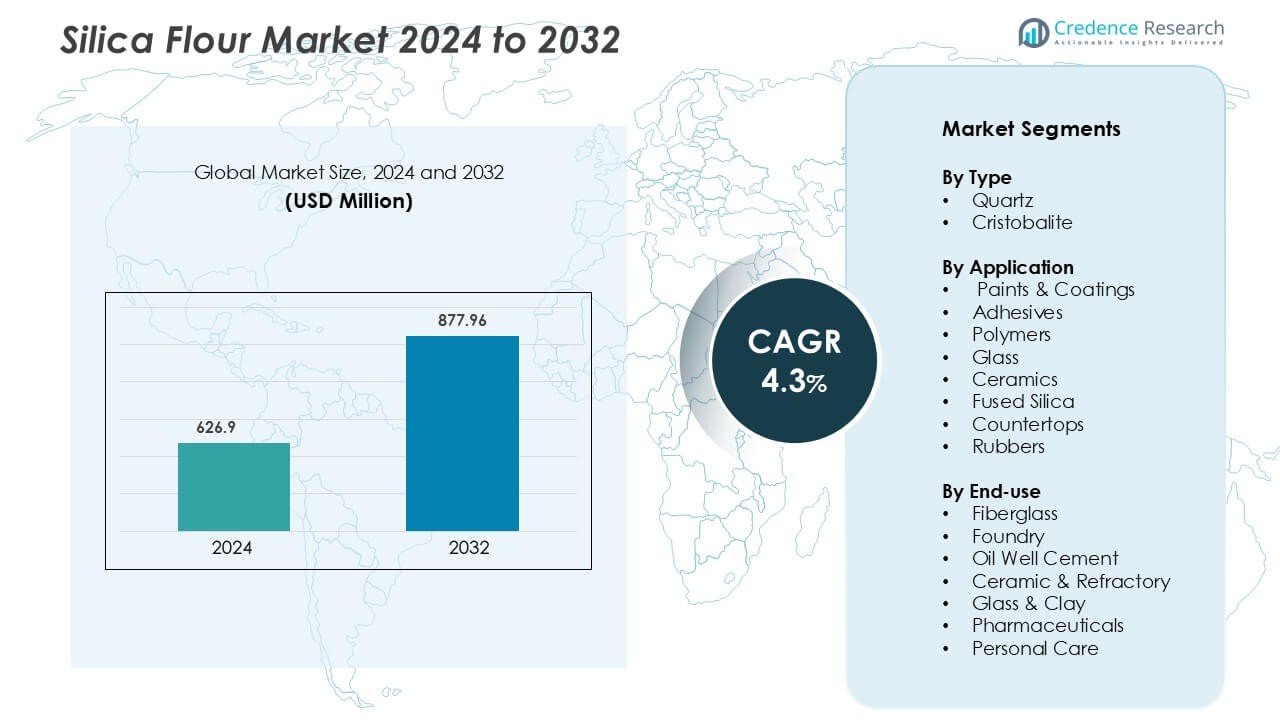
Market Segmentation Analysis:
By Type
Quartz dominates the Silica Flour Market, accounting for the largest market share due to its high purity and superior hardness. Its widespread availability and consistent performance make it the preferred choice across multiple industrial processes. Cristobalite follows as a specialized variant used in applications demanding high thermal stability and brightness. The growth of the quartz segment is driven by its extensive use in glassmaking, foundry molds, and ceramics manufacturing, supported by technological advancements in micronization that improve particle uniformity and performance consistency in industrial formulations.
- For instance, 20 Microns Limited produces ground quartz and silica flour powders in sizes ranging from 65 microns down to 10 microns from its Gujarat facility, enabling fine‐particle loadings for coatings and plastics.
By Application
The glass segment holds the dominant market share within the application category, driven by rising demand from the construction, automotive, and solar industries. Silica flour is a key ingredient in producing clear, durable, and high-strength glass. The paints and coatings segment also demonstrates significant growth, supported by silica’s role in enhancing durability, scratch resistance, and pigment dispersion. Increasing production of solar panels and architectural glass continues to strengthen the dominance of the glass sub-segment, with manufacturers emphasizing precision processing for optical clarity and energy efficiency.
- For instance, Quarzwerke Group supplies surface-treated silica flour under its SILBOND® brand, where one ultrafine grade reports a D50 of 0.3 µm and a BET surface area of 30 m²/g, tailored for high-performance powder coatings.
By End-use
Fiberglass represents the largest end-use segment in the Silica Flour Market, holding a substantial market share due to its extensive use in insulation, composites, and reinforced plastics. The segment benefits from strong demand across automotive, construction, and wind energy industries. Silica flour enhances fiberglass strength and reduces bubble formation during production. Growth in renewable energy projects and infrastructure development fuels further demand. Additionally, the foundry and ceramic & refractory segments maintain steady growth, supported by silica’s critical role in heat resistance and dimensional stability during metal casting and high-temperature operations.
Key Growth Drivers
Expanding Demand from the Glass and Construction Industries
The growing use of silica flour in the glass and construction industries remains a primary growth driver. It serves as a crucial raw material in the production of flat glass, fiberglass, and specialty glass used in architectural and automotive applications. The surge in infrastructure development, energy-efficient buildings, and solar installations further elevates consumption. Glass manufacturers rely on high-purity silica flour for improved transparency and thermal resistance. Additionally, its role in cement and concrete formulations enhances mechanical strength and durability, promoting widespread adoption. As global construction and urbanization trends accelerate, particularly in Asia-Pacific and the Middle East, silica flour demand continues to rise steadily, supported by technological improvements in material refinement and particle size control.
- For instance, Chemsize International Trading Co., Ltd. supplies high-purity fused silica flour with a D50 value of 3-5 µm, Fe₂O₃ content less than 0.003 %, and SiO₂ content above 99.9 %, ensuring excellent optical clarity in high-performance glass.
Rising Application in Industrial and Foundry Processes
The foundry and metallurgy industries are key contributors to silica flour consumption due to its superior refractory and molding properties. Silica flour provides excellent thermal stability and uniform mold casting, ensuring high precision in metal component manufacturing. In foundry cores and molds, its fine particle size minimizes surface defects, improving product finish and dimensional accuracy. The oil well cement segment also benefits from silica flour’s strength-enhancing and anti-retrogression properties in high-temperature conditions. Increasing demand for cast products in automotive and heavy engineering sectors drives further use. Moreover, the growing focus on advanced refractory linings for high-temperature furnaces in steel and aluminum industries supports steady market expansion, particularly across emerging industrial economies.
- For instance, industry literature notes that micronized crystalline silica (silica flour) is added to high-temperature oil-well cement (>110 °C) to prevent strength retrogression in more than 500,000 tons of material annually.
Growing Use in Paints, Coatings, and Polymers
Silica flour plays an essential role in the paints, coatings, and polymer sectors by improving surface finish, hardness, and abrasion resistance. It acts as a functional filler that enhances mechanical strength and weather durability. Paint manufacturers use silica flour to improve pigment dispersion, reduce gloss, and boost UV protection in architectural and industrial coatings. In the polymer industry, it provides dimensional stability and reinforcement for thermoplastics, adhesives, and sealants. Growing infrastructure modernization, coupled with increased consumer preference for long-lasting coatings, drives demand. The rising focus on eco-friendly coatings and performance-based composites further enhances silica flour utilization, supported by ongoing product innovation targeting high-performance, low-VOC formulations in developed markets.
Key Trends & Opportunities
Shift Toward High-Purity and Microfine Silica Grades
A growing trend in the Silica Flour Market is the shift toward high-purity and microfine silica grades for precision-based applications. Industries such as semiconductors, solar panels, and specialty coatings increasingly demand ultra-clean silica with controlled particle distribution. Manufacturers are investing in advanced purification technologies and automated grinding systems to meet strict quality requirements. High-purity silica enables superior performance in electronic components and optical materials where impurities can cause functional defects. This trend opens opportunities for companies to differentiate products through customized purity levels and particle engineering, catering to niche markets such as electronics and energy-efficient construction materials.
- For instance, high-purity quartz powder from Chida Mineral Co., Ltd. is available in sizes with D50 of 2 µm, 5 µm, 10 µm and purity levels reaching up to 99.995%.
Rising Adoption of Sustainable and Recycled Silica Sources
Sustainability is becoming a major focus in silica flour production, creating opportunities for manufacturers using recycled or eco-friendly silica sources. Producers are adopting low-emission manufacturing and waste-reduction technologies to align with environmental regulations. The use of recycled glass and industrial by-products to produce silica flour is gaining momentum due to its cost efficiency and lower carbon footprint. This shift benefits manufacturers targeting green construction materials, renewable energy infrastructure, and sustainable paints. The trend not only reduces dependence on virgin raw materials but also enhances brand reputation among environmentally conscious industries, providing a competitive edge in regulated markets like Europe and North America.
- For instance, a study indicated that every tonne of glass cullet recycled into silica feedstock avoided approximately 315 kg of CO₂ emissions compared tovirgin silica mining and processing.
Key Challenges
Stringent Occupational and Environmental Regulations
One of the major challenges in the Silica Flour Market is compliance with strict occupational and environmental safety standards. Prolonged exposure to fine silica dust can lead to respiratory illnesses such as silicosis, prompting governments to impose tighter regulations on handling, processing, and emissions. Industries face increased operational costs due to mandatory dust control systems, protective equipment, and periodic health monitoring. Compliance with regulations from bodies like OSHA and REACH adds administrative complexity and limits smaller manufacturers’ competitiveness. The challenge pushes companies to adopt safer, automated production methods and explore alternative materials, though it increases investment costs and slows production expansion in certain regions.
Volatile Raw Material Prices and Supply Constraints
Fluctuating prices of raw silica sand and transportation costs present ongoing challenges for market stability. Supply chain disruptions due to mining restrictions, trade policies, or geopolitical tensions can hinder consistent raw material availability. Producers dependent on natural quartz sources face uncertainty in procurement, affecting production continuity and profitability. Additionally, the energy-intensive grinding and purification processes contribute to rising operational costs, particularly during energy price surges. To mitigate these risks, companies are investing in resource optimization, localized sourcing, and long-term supplier agreements. However, price volatility remains a constraint on profit margins, especially for small and mid-sized players competing in cost-sensitive markets.
Regional Analysis
North America
North America captured a market share of approximately 22.0% in 2024. The region benefits from strong demand for fiberglass, oil-well cement, and high-performance glass applications. Investment in renewable energy, automotive lightweighting, and advanced manufacturing supports silica flour uptake. Suppliers exploit high-quality quartz resources and efficient logistics networks, enabling consistent supply across the U.S. and Canada. The regulatory environment emphasises industrial safety and quality standards, which further drives premium grade product adoption and fosters stable long-term growth.
Europe
Europe holds a significant portion of the global silica flour market, estimated at roughly 15-20%. (Exact share not publicly specified) The region’s well-established glass, ceramics and foundry industries, particularly in Germany, France and the UK, support robust demand. A strong focus on energy-efficient building materials and green manufacturing strengthens uptake of refined silica flour grades. Moreover, Europe's stringent environmental and health regulations push manufacturers to adopt higher-purity and lower-emission materials, reinforcing market maturity.
Asia-Pacific
Asia-Pacific leads the global silica flour market with the largest share, reported at approximately 39.5% in 2019. Rapid industrialisation, urbanisation and infrastructure growth in China, India and Southeast Asia drive this dominance. Expanding glass, fiberglass, coatings and foundry sectors consume large volumes of silica flour. Additionally, abundant raw silica sand deposits and competitive production costs enhance Asia-Pacific’s position as a global manufacturing hub. Aggressive investment in renewable energy, construction and automotive lightweighting further amplifies regional demand.
Latin America
Latin America holds a modest yet growing share, estimated at 5-8% of the global market. While local production capacity remains limited, expanding construction, oil & gas cementing and industrial applications in Brazil and Mexico fuel growth. Import reliance from North America and Asia increases exposure to cost and logistics risks. Nevertheless, targeted infrastructure projects and rising manufacturing activity support gradual share expansion in the region.
Middle East & Africa
The Middle East & Africa region commands an estimated 3-6% market share globally. Driving factors include large-scale infrastructure and smart-city developments, oil-well cementing operations and emerging glass/ceramics manufacturing in GCC and South Africa. The market remains less mature than other regions but offers growth potential through local capacity expansion and demand for high-temperature industrial applications.
Market Segmentations:
By Type
- Quartz
- Cristobalite
By Application
- Paints & Coatings
- Adhesives
- Polymers
- Glass
- Ceramics
- Fused Silica
- Countertops
- Rubbers
By End-use
- Fiberglass
- Foundry
- Oil Well Cement
- Ceramic & Refractory
- Glass & Clay
- Pharmaceuticals
- Personal Care
By Geography
- North America
- U.S.
- Canada
- Mexico
- Europe
- Germany
- France
- U.K.
- Italy
- Spain
- Rest of Europe
- Asia Pacific
- China
- Japan
- India
- South Korea
- South-east Asia
- Rest of Asia Pacific
- Latin America
- Brazil
- Argentina
- Rest of Latin America
- Middle East & Africa
- GCC Countries
- South Africa
- Rest of the Middle East and Africa
Competitive Landscape
The silica flour market is moderately fragmented, with global and regional players focusing on purity enhancement, particle size consistency, and application diversification. Sibelco and U.S. Silica Holdings, Inc. lead with high-grade silica flour used in glass manufacturing, oilfield services, and foundry applications, supported by extensive mining operations and global distribution networks. Adwan Chemical Industries Co. Ltd. and Euroquarz GmbH emphasize precision processing and tailored grades for paints, coatings, and polymer industries. Sil Industrial Minerals and Capital Sand Company strengthen North American supply capabilities through advanced beneficiation and logistics optimization. Finore Minerals LLP and Fineton Industrial Minerals Limited expand their market presence in Asia through cost-efficient production and export-oriented strategies. AGSCO Corporation and Hoben International Ltd. specialize in engineered silica for abrasives and industrial filtration. Companies are increasingly investing in sustainable mining practices, dust control technologies, and automation to ensure quality consistency and environmental compliance across production facilities.
Key Player Analysis
- Sibelco (Belgium)
- Finore Minerals LLP (India)
- Sil Industrial Minerals (Canada)
- Adwan Chemical Industries Co. Ltd. (Saudi Arabia)
- Euroquarz GmbH (Germany)
- AGSCO Corporation (U.S.)
- Fineton Industrial Minerals Limited (Hong Kong)
- S. Silica Holdings, Inc. (U.S.)
- Capital Sand Company (U.S.)
- Hoben International Ltd. (UK)
Recent Developments
- In March 2022, Sibelco completed the acquisition of Kremer Zande n Grind (KZG) to increase silica sand resources and reserves in Western Europe
- In July 2022, Sibelco completed acquisition of Echasa S.A. for expansion of its customer base in construction, foundry, and glass markets in Spain’s northern part, apart from extending silica sand resources and reserves in Western Europe
Report Coverage
The research report offers an in-depth analysis based on Type, Application, End-Use and Geography. It details leading market players, providing an overview of their business, product offerings, investments, revenue streams, and key applications. Additionally, the report includes insights into the competitive environment, SWOT analysis, current market trends, as well as the primary drivers and constraints. Furthermore, it discusses various factors that have driven market expansion in recent years. The report also explores market dynamics, regulatory scenarios, and technological advancements that are shaping the industry. It assesses the impact of external factors and global economic changes on market growth. Lastly, it provides strategic recommendations for new entrants and established companies to navigate the complexities of the market.
Future Outlook
- The Silica Flour Market will witness steady growth driven by rising glass and ceramics demand.
- Increasing infrastructure projects will boost the use of silica flour in construction materials.
- Advancements in high-purity processing will enhance product quality for industrial applications.
- Growing solar panel production will create strong demand for refined silica flour.
- The shift toward eco-friendly coatings will increase the use of silica flour-based additives.
- Expansion of foundry and oilfield industries will continue to support market growth.
- Asia-Pacific will emerge as the fastest-growing region due to rapid industrialization.
- Strategic mergers and capacity expansions will strengthen the presence of key producers.
- Rising demand for precision-engineered fillers in polymers and rubbers will drive innovation.
- Continuous R&D investments will focus on improving consistency, purity, and performance efficiency.
Request a Free Sample
Fill in your details and we'll send you a free sample report.
- Sample data tables & charts
- Research methodology
Need a Custom Version of This Report?
Tailor the scope, geography, or segments to your exact requirements.
- Custom geography or segment scope
- Direct access to our analyst team
Frequently Asked Questions
What is the current market size for Silica Flour Market, and what is its projected size in 2032?
At what Compound Annual Growth Rate is the Silica Flour Market projected to grow between 2025 and 2032?
Which Silica Flour Market segment held the largest share in 2024?
What are the primary factors fueling the growth of the Silica Flour Market?
Who are the leading companies in the Silica Flour Market?
Which region commanded the largest share of the Silica Flour Market in 2024?
Table of Content
Chapter 1. Report Introduction
- 1.1 Report Description & Purpose
- 1.1.1 Report Title & Market Definition
- 1.1.2 Unique Selling Propositions (USP) & Key Differentiators
- 1.1.3 Value Proposition for Stakeholders
- 1.2 Research Objectives
- 1.2.1 Market Sizing Objectives (Volume & Revenue)
- 1.2.2 Segmentation Objectives
- 1.2.3 Competitive Intelligence Objectives
- 1.2.4 Forecast & Scenario Objectives
- 1.3 Report Scope
- 1.3.1 Silica Flour Scope – Types & Subtypes Covered
- 1.3.2 Geographic Scope – Regions & Countries Covered
- 1.3.3 Historical Period, Base Year & Forecast Period (2024; forecast to 2032)
- 1.3.4 Inclusions & Exclusions
- 1.4 HS Code & Classification Framework
- 1.5 Currency, Units & Pricing Basis
- 1.6 Target Stakeholders
- 1.7 Limitations & Assumptions
Chapter 2. Executive Summary
- 2.1 Global Silica Flour Market Snapshot
- 2.1.1 Market Size – Historical (2024) & Forecast (2024-2032) (2024: USD 626.9 million → 2032: USD 877.96 million)
- 2.1.2 Volume & Revenue – Global Totals
- 2.1.3 Key Market Highlights – Top Five Facts
- 2.2 Silica Flour Market Segmentation Snapshot
- 2.2.1 Market Split by Region – 2024 vs. 2032
- 2.3 Competitive Snapshot
- 2.3.1 Top 10 Players by Revenue Share – 2024
- 2.3.2 Top 10 Players by Volume Share – 2024
- 2.3.3 Recent Strategic Developments (18-Month Summary)
- 2.4 Key Investment Highlights & Strategic Conclusions
Chapter 3. Silica Flour Market Dynamics & Industry Analysis
- 3.1 Market Overview & Context
- 3.1.1 Silica Flour Market Position in the Broader Automotive Value Chain
- 3.1.2 OEM vs. Replacement Market Dynamics
- 3.1.3 Market Maturity & Development Stage by Region
- 3.2 Silica Flour Market Drivers
- 3.3 Silica Flour Market Restraints & Challenges
- 3.4 Silica Flour Market Opportunities
- 3.5 Porter's Five Forces Analysis
- 3.5.1 Threat of New Entrants
- 3.5.2 Bargaining Power of Suppliers
- 3.5.3 Bargaining Power of Buyers
- 3.5.4 Threat of Substitutes
- 3.5.5 Competitive Rivalry – Intensity Assessment
- 3.6 Silica Flour Value Chain Analysis
- 3.6.1 Upstream – Raw Material/Input Suppliers
- 3.6.1.1 Raw Material/Input 1
- 3.6.1.2 Raw Material/Input 2
- 3.6.1.3 Raw Material/Input 3
- 3.6.2 Midstream – Production/Manufacturing/Service Delivery
- 3.6.2.1 Production/Process Overview
- 3.6.2.2 Key Facility Locations & Capacity by Manufacturer
- 3.6.3 Downstream – Distribution & End Consumer
- 3.6.3.1 Primary Channel – B2B/OEM
- 3.6.3.2 Secondary Channels – Dealer, Retail, Online, Direct
- 3.6.4 Value Chain Profitability Analysis
- 3.6.1 Upstream – Raw Material/Input Suppliers
- 3.7 PESTEL Analysis
- 3.7.1 Political Factors
- 3.7.2 Economic Factors
- 3.7.3 Social Factors
- 3.7.4 Technological Factors
- 3.7.5 Environmental Factors
- 3.7.6 Legal Factors
- 3.8 Silica Flour Supply Chain Analysis
- 3.8.1 Raw Material/Input Supply Risk Assessment
- 3.8.2 Manufacturing Concentration Risk (Geographic Exposure)
- 3.8.3 Trade Disruption Impact Analysis
- 3.9 Regulatory & Policy Landscape
Note: The regulatory and policy landscape section covers regulations based on their applicability to the market, Silica Flour category, geography, and scope of the study. Only regulatory frameworks with a material impact on operations, compliance, trade, sustainability, or market access are analyzed in detail.
Chapter 4. Key Investment Pockets & Opportunity Analysis
- 4.1 Silica Flour Market Attractiveness Analysis
- 4.1.1 By Region – Investment Attractiveness Matrix (Volume × CAGR)
- 4.2 Absolute Revenue Growth Opportunity
- 4.2.1 By Region – Absolute USD Growth Through 2032
- 4.3 Incremental Volume Opportunity
- 4.3.1 By Region – Incremental Volume Through 2032
- 4.3.2 Segment – Incremental Volume
- 4.4 Emerging Submarket Opportunity Deep Dive (Subject to Applicability)
- 4.5 Emerging Market Opportunity Scorecards
- 4.5.1 United States
- 4.5.2 Europe
- 4.5.3 Asia
- 4.5.4 Middle East & Africa
Note: Emerging Market Opportunity Scorecards will be included based on relevance and strategic importance. Regions listed are indicative and may vary depending on data availability and market dynamics.
Chapter 5. Silica Flour Import-Export Analysis & Trade Flows
- 5.1 Global Trade Overview
- 5.1.1 Global Export Value by Country (2024)
- 5.1.2 Global Export Volume by Country (2024)
- 5.1.3 Global Import Value by Country (2024)
- 5.1.4 Global Import Volume by Country (2024)
- 5.1.5 Net Trade Balance by Country (2024)
- 5.2 Export Analysis – Segment
- 5.2.1 Type 1 (HS Code)
- 5.2.2 Type 2 (HS Code)
- 5.2.3 Type 3 (HS Code)
- 5.2.4 Type 4 (HS Code)
- 5.2.5 Type 5 (HS Code)
- 5.3 Import Analysis – Segment
- 5.3.1 Type 1 (HS Code)
- 5.3.2 Type 2 (HS Code)
- 5.3.3 Type 3 (HS Code)
- 5.3.4 Type 4 (HS Code)
- 5.3.5 Type 5 (HS Code)
- 5.4 Average Unit Trade Prices
- 5.4.1 Average Export Price – Segment & Country
- 5.4.2 Average Import Price – Segment & Source Country
- 5.4.3 Price Trends (2024)
- 5.5 Key Trade Route Analysis
- 5.5.1 Trade Route 1
- 5.5.2 Trade Route 2
- 5.5.3 Trade Route 3
- 5.5.4 Trade Route 4
- 5.5.5 Trade Route 5
- 5.6 Trade Policy Impact Assessment
- 5.6.1 US Anti-Dumping & Section 301 Tariffs
- 5.6.2 EU Customs Union Impact
- 5.6.3 Major Free Trade Agreements
- 5.6.4 USMCA Rules of Origin
Note: Trade policy analysis will be included only where relevant to the Silica Flour market.
Chapter 6. Competitive Landscape & Company Benchmarking
- 6.1 Silica Flour Market Concentration & Structure
- 6.1.1 Herfindahl-Hirschman Index (HHI) – vs. 2024
- 6.1.2 Tier 1, Tier 2 & Tier 3 Market Structure
- 6.1.3 Global, Regional & Local Player Dynamics
- 6.2 Silica Flour Market Share Analysis – 2024
- 6.2.1 Global Revenue Share by Company
- 6.2.2 Global Volume Share by Company
- 6.2.3 Regional Revenue Share
- 6.2.4 Market Share Evolution ( vs. 2024)
- 6.2.5 OEM Segment Share by Company
- 6.2.6 Replacement Segment Share by Company
- 6.3 Production/Delivery Capacity & Facility Analysis
- 6.3.1 Global Installed Capacity
- 6.3.2 Capacity Utilization Rates
- 6.3.3 Production/Output Volume
- 6.3.4 Facility Locations & Capacity Map
- 6.3.5 Planned Capacity Additions
- 6.4 Silica Flour Competitive Benchmarking Matrix
- 6.4.1 Revenue, Volume, CAGR & Profitability Comparison
- 6.4.2 Channel Revenue Mix
- 6.4.3 Geographic Revenue Exposure
- 6.4.4 R&D Intensity
- 6.4.5 Sustainability Maturity
- 6.5 Strategic Developments in Silica Flour (Last 24 Months)
- 6.5.1 Mergers, Acquisitions & Divestments
- 6.5.2 New Silica Flour Launches
- 6.5.3 Facility Expansions
- 6.5.4 Strategic Alliances, Joint Ventures & Partnerships
- 6.5.5 Distribution Expansion & Market Entry
- 6.5.6 Sustainability & ESG Initiatives
- 6.6 Competitive Strategy Mapping
- 6.6.1 Leader, Challenger, Follower & Niche Classification
- 6.6.2 Pricing Strategy Comparison
- 6.6.3 Channel Strategy Matrix
Note: Strategic developments are included based on their materiality and the availability of reliable information.
Chapter 7. Global Silica Flour Market – By Distribution Channel
- 7.1 Segment Overview
- 7.1.1 Volume & Revenue Split by Channel (2024 & 2032)
- 7.1.2 Channel Mix Evolution (2024-2032)
Chapter 8. Regional Market Analysis – Global Overview
- 8.1 Global Regional Overview
- 8.1.1 Regional Volume Share
- 8.1.2 Regional Revenue Share
- 8.1.3 Regional Volume by Region
- 8.1.4 Regional Revenue by Region
- 8.1.5 Regional Forecast Through 2032
- 8.2 Cross-Regional Segment Analysis
- 8.2.1 By Distribution Channel
- 8.2.2 By Brand/Price Tier
Chapter 9. North America Silica Flour Market
- 9.1 United States
- 9.2 Canada
- 9.3 Mexico
Chapter 10. Europe Silica Flour Market
- 10.1 Germany
- 10.2 France
- 10.3 Italy
- 10.4 United Kingdom
- 10.5 Spain
- 10.6 Poland
- 10.7 Russia
- 10.8 Netherlands
- 10.9 Belgium
- 10.10 Sweden
- 10.11 Denmark
- 10.12 Norway
- 10.13 Rest of Europe
Chapter 11. Asia Pacific Silica Flour Market
- 11.1 China
- 11.2 India
- 11.3 Japan
- 11.4 South Korea
- 11.5 Thailand
- 11.6 Indonesia
- 11.7 Vietnam
- 11.8 Malaysia
- 11.9 Australia
- 11.10 Rest of Asia Pacific
Chapter 12. Latin America Silica Flour Market
- 12.1 Brazil
- 12.2 Argentina
- 12.3 Colombia
- 12.4 Chile
- 12.5 Rest of Latin America
Chapter 13. Middle East Silica Flour Market
- 13.1 Saudi Arabia
- 13.2 United Arab Emirates
- 13.3 Turkey
- 13.4 Israel
- 13.5 Iran
- 13.6 Rest of the Middle East
Chapter 14. Africa Silica Flour Market
- 14.1 South Africa
- 14.2 Egypt
- 14.3 Nigeria
- 14.4 Morocco
- 14.5 Rest of Africa
Chapter 15. Silica Flour Company Profiles
- 15.1 [Company 01]
- 15.1.1 Company Overview
- 15.1.2 Key Management Personnel
- 15.1.3 Products & Services Portfolio
- 15.1.4 Financial Performance
- 15.1.5 Key Market Focus & Geographic Presence
- 15.1.6 Recent Developments & Strategic Initiatives
Note: The company profile list is preliminary and may change based on research findings, market developments, data availability, and client requirements.
Chapter 16. Appendices
- Appendix A – List of Abbreviations & Acronyms
- Appendix B – Industry Classification Code Reference – Full Series
- Appendix C – Production & Capacity Data Tables
- Appendix D – End-Use & Demand Base Tables
- Appendix E – Consumption & Replacement Rate Assumptions
- Appendix F – ASP Reference Tables
- Appendix G – Manufacturing & Facility Database
- Appendix H – Import-Export Data Tables
- Appendix I – Regulatory Summary Tables
- Appendix J – Primary Research Participant List (Anonymized)
- Appendix K – Primary Research Questionnaire Framework
- Appendix L – Data Sources & Bibliography
- Appendix M – Market Size Divergence & Source Comparison
Chapter 17. Research Methodology
- 17.1 Research Framework & Philosophy
- 17.2 Secondary Research – Sources, Hierarchy & Data Extraction
- 17.3 Data Modeling – Bottom-Up & Top-Down Market Sizing
- 17.4 Primary Research – Stakeholder Framework, LOI & Sample Sizes
- 17.5 Forecast Methodology – Regression, Scenario & Sensitivity Analysis
- 17.6 Quality Control – Four-Layer Validation Framework
- 17.7 Limitations & Standard Assumptions
- 17.8 Disclaimer
