
Market Overview
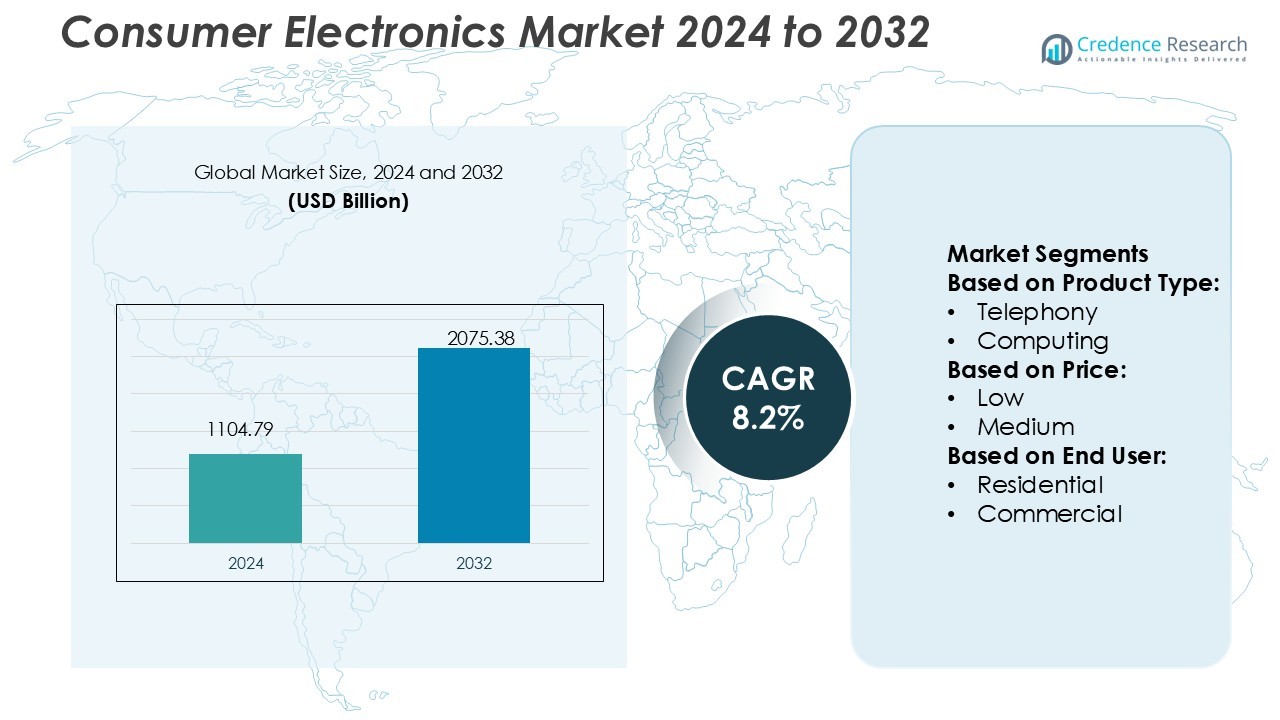
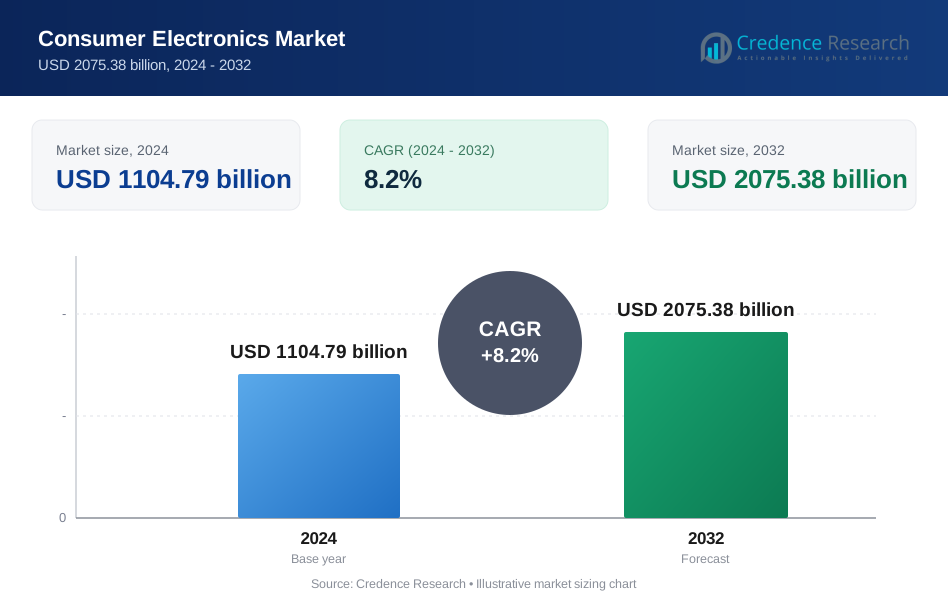
Consumer Electronics Market size was valued USD 1104.79 billion in 2024 and is anticipated to reach USD 2075.38 billion by 2032, at a CAGR of 8.2% during the forecast period.
| REPORT ATTRIBUTE | DETAILS |
|---|---|
| Historical Period | 2020-2023 |
| Base Year | 2024 |
| Forecast Period | 2025-2032 |
| Consumer Electronics Market Size 2024 | USD 1104.79 Billion |
| Consumer Electronics Market, CAGR | 8.2% |
| Consumer Electronics Market Size 2032 | USD 2075.38 Billion |
The consumer electronics market is driven by major players including Samsung Electronics, Apple Inc., LG Electronics, Sony Group Corporation, Huawei Technologies, Microsoft Corp., Panasonic Corporation, Dell Technologies, HP Inc., and Lenovo Group. These companies focus on innovation, design efficiency, and digital integration to strengthen their market positions. They invest heavily in R&D, develop AI-powered devices, and expand global distribution networks to meet rising consumer demand. Asia-Pacific leads the global consumer electronics market with a 39% share in 2024, driven by strong manufacturing capabilities, urbanization, and growing middle-class income. The region’s dominance is further supported by technological innovation, large-scale production facilities, and expanding e-commerce penetration.
Market Insights
- The consumer electronics market was valued at USD 1104.79 billion in 2024 and is projected to reach USD 2075.38 billion by 2032, growing at a CAGR of 8.2%.
- Strong R&D investments and product innovation by Samsung, Apple, Sony, and LG drive technological growth, focusing on AI integration, sustainability, and energy-efficient designs.
- Key trends include the rising use of smart home devices, wearable technologies, and IoT-based automation enhancing consumer convenience and lifestyle personalization.
- High production costs and semiconductor supply fluctuations act as market restraints, impacting pricing strategies and product availability globally.
- Asia-Pacific dominates with a 39% regional share in 2024 due to strong manufacturing capabilities, expanding e-commerce, and growing middle-class income, while the computing and telephony segments hold the largest revenue share within product categories.
Market Segmentation Analysis:
By Product Type
The computing segment dominated the consumer electronics market, accounting for a 34% share in 2024. This segment leads due to strong demand for laptops, tablets, and hybrid devices supporting remote work and digital education. Advancements in AI-enabled processors, lightweight designs, and extended battery life fuel adoption. Increasing cloud integration and gaming performance optimization also attract both residential and professional users. Major players focus on integrating sustainable materials and faster chipsets, aligning with the growing consumer preference for eco-friendly and high-performance electronics.
- For instance, LG’s AI research division validated the Furiosa RNGD chip for use in computing and edge servers, achieving 512 TFLOPS FP8 throughput with a TDP of 150 W in LG’s internal benchmark tests.
By Price
The medium-price segment held the largest market share of 46% in 2024, driven by balanced affordability and advanced features. Mid-range products attract a wide customer base seeking durability and performance without premium costs. Rising disposable incomes and the availability of feature-rich smartphones, laptops, and smart TVs strengthen this category. Companies focus on modular designs, local manufacturing, and regional customization to enhance competitiveness. The segment benefits from technological diffusion from premium lines, offering consumers enhanced connectivity and smart integration at accessible price points.
- For instance, Microsoft announced Surface Copilot+ PCs that include on-device Neural Processing Units (NPUs) delivering over 40 TOPS of AI inferencing performance.
By End User
The residential segment dominated the market with a 68% share in 2024, supported by growing smart home adoption and lifestyle upgrades. Consumers increasingly prefer interconnected devices for entertainment, communication, and daily convenience. Expansion of IoT ecosystems, coupled with home automation systems and streaming services, boosts product integration across households. E-commerce platforms and brand-specific online stores further drive product accessibility. Continuous innovation in energy-efficient appliances and AI-powered smart assistants sustains strong demand within the residential electronics market.
Key Growth Drivers
Rising Adoption of Smart and Connected Devices
The growing demand for IoT-enabled and AI-integrated consumer electronics is a major growth driver. Devices such as smart TVs, wearables, and voice-assisted appliances are increasingly popular due to improved convenience and automation. The integration of AI enhances personalization and energy efficiency, attracting a wide consumer base. Manufacturers are also leveraging connectivity for remote operation and real-time monitoring. This trend is accelerating the replacement of traditional devices with smart counterparts, boosting global sales and expanding the consumer electronics market.
- For instance, Huawei in 2025 claimed that its WATCH GT 6 can run for 21 days on a single charge under its TruSense health monitoring framework. Huawei’s CloudMatrix384 supernode integrates 384 Ascend 910C NPUs and 192 Kunpeng CPUs, enabling 6,688 tokens/sec prefill throughput per NPU and 1,943 tokens/sec decode throughput per NPU in large language model inference operations.
Increasing Disposable Income and Urbanization
Rapid urbanization and rising disposable incomes are significantly fueling demand for advanced consumer electronics. Consumers in urban areas are adopting premium and multifunctional devices for better comfort and efficiency. Expanding middle-class populations in Asia-Pacific and Latin America further contribute to increased purchasing power. The availability of financing options and online retail platforms makes high-end electronics more accessible. This combination of lifestyle transformation and economic improvement continues to support strong global market growth.
- For instance, Panasonic developed the H₂ Kibou Field, a renewable energy demonstration facility in Kusatsu, Japan. The facility combines a 495 kW hydrogen fuel cell system, 570 kW of solar panels, and a 1.1 MWh lithium-ion storage system.
Advancements in Manufacturing and Energy Efficiency
Technological innovation in manufacturing and energy-efficient designs is driving market expansion. The introduction of lightweight materials, miniaturization, and enhanced battery performance improves product longevity and user experience. Energy-efficient electronics reduce power consumption, aligning with sustainability goals and government energy regulations. Automation and robotics in production lines have lowered costs and increased scalability. These advancements enable companies to deliver high-quality, affordable products while meeting eco-friendly standards and consumer expectations.
Key Trends & Opportunities
Growing Demand for Sustainable and Eco-Friendly Products
Consumers are increasingly favoring electronics designed with recyclable materials and low carbon footprints. Companies are developing energy-efficient products that comply with environmental regulations. The adoption of green technologies and circular economy principles presents strong growth opportunities. Firms investing in eco-certifications and sustainable packaging are gaining consumer trust and brand value. This shift toward sustainability enhances long-term competitiveness in the global market.
- For instance, HP reports that in its 2023 operations it incorporated 34,400 tonnes of post-consumer recycled (PCR) plastic into its product portfolio, meeting 18 % of its total plastic demand.
Expansion of E-Commerce and Omnichannel Retailing
E-commerce has become a vital distribution channel for consumer electronics. Online platforms enable product comparison, easy financing, and doorstep delivery, driving convenience-led purchasing behavior. Omnichannel strategies-combining digital and physical experiences-are helping brands strengthen customer engagement. Enhanced logistics, AR-based product visualization, and post-purchase support further improve user satisfaction. The digital retail ecosystem thus continues to shape the future of electronics sales.
Integration of Artificial Intelligence and Voice Assistance
AI-driven technologies are transforming user interaction with electronic devices. Voice assistants like Alexa and Google Assistant enable seamless control, enhancing convenience and personalization. Smart home ecosystems integrating AI-based recommendations are becoming mainstream. Manufacturers using predictive analytics and machine learning enhance product efficiency and user engagement. This trend continues to open new possibilities for innovation and premium product development.
- For instance, Samsung’s Latin America e-commerce team partnered with Kluge to deploy Web AR for over 200 3D product models, enabling users to place virtual TVs and appliances in their homes without installing an app.
Key Challenges
High Competition and Price Sensitivity
The consumer electronics market faces intense competition from numerous global and regional brands. Continuous innovation leads to frequent product launches, increasing price pressure. Many consumers prioritize affordability, forcing manufacturers to balance between quality and cost. This environment limits profit margins and compels firms to optimize supply chains. Price sensitivity, especially in emerging markets, remains a persistent challenge for sustainable growth.
Supply Chain Disruptions and Semiconductor Shortages
Global supply chain disruptions and chip shortages have severely impacted production cycles. Semiconductor scarcity affects manufacturing timelines and increases product costs. Dependence on limited suppliers makes the industry vulnerable to geopolitical and logistic risks. Companies are now investing in regional manufacturing and diversified sourcing to mitigate these issues. However, rebuilding supply resilience requires time and significant capital investment.
Regional Analysis
North America
North America holds a 27% share of the global consumer electronics market in 2024. The region benefits from high adoption of smart home devices, advanced connectivity, and strong purchasing power. Major players such as Apple, Samsung, and Sony dominate through continuous innovation in wearables, entertainment systems, and IoT-based appliances. The U.S. leads regional growth, supported by increasing demand for AI-integrated and energy-efficient devices. Expanding 5G infrastructure and the rise of digital lifestyles further accelerate product replacement cycles, strengthening market expansion across both residential and commercial sectors.
Europe
Europe accounts for a 24% share of the consumer electronics market in 2024. Strong environmental regulations and consumer demand for sustainable, energy-efficient products drive regional growth. Countries like Germany, the U.K., and France lead adoption due to high disposable incomes and tech-savvy consumers. European manufacturers focus on eco-friendly designs, smart connectivity, and compliance with the EU’s Green Deal. E-commerce expansion and smart home penetration continue to enhance product accessibility. The region’s focus on digital transformation and innovation in smart appliances ensures consistent growth within both premium and mid-range segments.
Asia-Pacific
Asia-Pacific dominates the global consumer electronics market with a 39% share in 2024. The region’s leadership is driven by high population density, rapid urbanization, and growing middle-class income. China, Japan, South Korea, and India serve as major production and consumption hubs. Strong government initiatives supporting manufacturing and smart city development fuel market expansion. The dominance of regional players like Samsung, LG, Xiaomi, and Sony enhances innovation and competitive pricing. Growing e-commerce networks and rising adoption of connected devices sustain the region’s growth momentum, making Asia-Pacific the fastest-evolving electronics market globally.
Latin America
Latin America holds a 6% share of the global consumer electronics market in 2024. Market growth is supported by increasing smartphone penetration, expanding internet access, and the popularity of e-commerce platforms. Brazil and Mexico dominate regional demand, driven by young consumers’ preference for smart and affordable devices. The adoption of 4G and emerging 5G networks stimulates sales of connected products. Local distributors and international brands are expanding partnerships to meet diverse consumer needs. Despite currency fluctuations and import costs, the region’s growing digital economy provides favorable conditions for steady market expansion.
Middle East & Africa
The Middle East & Africa region represents a 4% share of the consumer electronics market in 2024. Growth is driven by rising urbanization, improving living standards, and expanding retail infrastructure. Gulf countries like the UAE and Saudi Arabia lead adoption, supported by smart city initiatives and tech-friendly policies. Africa’s market is developing rapidly due to affordable smartphone availability and expanding internet access. Global brands are increasing investments in localized manufacturing and after-sales networks. Although the market faces challenges from price sensitivity and limited distribution, growing digitalization continues to enhance regional opportunities.
Market Segmentations:
By Product Type:
- Telephony
- Computing
By Price:
- Low
- Medium
By End User:
- Residential
- Commercial
By Geography
- North America
- US
- Canada
- Mexico
- Europe
- Germany
- France
- UK.
- Italy
- Spain
- Rest of Europe
- Asia Pacific
- China
- Japan
- India
- South Korea
- South-east Asia
- Rest of Asia Pacific
- Latin America
- Brazil
- Argentina
- Rest of Latin America
- Middle East & Africa
- GCC Countries
- South Africa
- Rest of Middle East and Africa
Competitive Landscape
The competitive landscape of the consumer electronics market features key players such as LG Electronics, Microsoft Corp., Huawei Technologies, Panasonic Corporation, HP Inc., Samsung Electronics, Dell Technologies, Sony Group Corporation, Lenovo Group, and Apple Inc. The consumer electronics market is highly competitive, driven by continuous innovation, rapid technological advancement, and changing consumer preferences. Companies compete by offering smart, connected, and energy-efficient products tailored to modern digital lifestyles. The industry focuses on integrating artificial intelligence, the Internet of Things (IoT), and cloud-based ecosystems to enhance user experience. Manufacturers are investing heavily in research and development to introduce innovative designs and multifunctional features. The growing emphasis on sustainability, recyclability, and low-energy consumption further differentiates leading brands. Competitive intensity remains high, with global players expanding product portfolios and strengthening distribution networks to capture diverse market segments.
Key Player Analysis
- LG Electronics
- Microsoft Corp.
- Huawei Technologies
- Panasonic Corporation
- HP Inc.
- Samsung Electronics
- Dell Technologies
- Sony Group Corporation
- Lenovo Group
- Apple Inc.
Recent Developments
- In February 2025, ZeroAvia secured its first commercial agreement for a standalone electric propulsion system, with Jetcruzer International purchasing the company's 600kW system. The propulsion system will support Jetcruzer International's ongoing electric aircraft development program.
- In January 2025, Samsung Electronics America unveiled its latest innovation, Samsung Vision AI1, at the CES First Look 2025 event. This advanced AI technology showcases groundbreaking applications designed to deliver exceptional picture quality and serve as adaptive, intelligent companions that simplify and enhance daily life.
- In June 2024, HORIBA introduced its STARS Battery software, aimed at improving battery testing capabilities in the mobility sector. This new software supports the testing of diverse battery types-single cells, modules, and packs-and provides performance and durability assessments essential for ensuring the reliability of electric propulsion systems.
- In May 2023, Sony Electronics Inc. launched the ‘Xperia 1V’ smartphone, fit with advanced and cutting edge technology, along with a CMOS image sensor with two-layer transistor pixel.
Report Coverage
The research report offers an in-depth analysis based on Product Type, Price, End-User and Geography. It details leading market players, providing an overview of their business, product offerings, investments, revenue streams, and key applications. Additionally, the report includes insights into the competitive environment, SWOT analysis, current market trends, as well as the primary drivers and constraints. Furthermore, it discusses various factors that have driven market expansion in recent years. The report also explores market dynamics, regulatory scenarios, and technological advancements that are shaping the industry. It assesses the impact of external factors and global economic changes on market growth. Lastly, it provides strategic recommendations for new entrants and established companies to navigate the complexities of the market.
Future Outlook
- The market will expand steadily due to rising demand for smart and connected devices.
- Artificial intelligence and IoT integration will enhance product performance and personalization.
- Energy-efficient and eco-friendly electronics will gain stronger consumer preference.
- E-commerce and direct-to-consumer channels will drive higher global sales.
- 5G connectivity will accelerate adoption of advanced mobile and home devices.
- Wearables and health-monitoring gadgets will become mainstream in consumer use.
- Cloud-based ecosystems will improve device interconnectivity and remote management.
- Emerging economies will witness strong growth through increased digital adoption.
- Companies will focus more on circular economy models and sustainable production.
- Continuous innovation in display, battery, and semiconductor technologies will shape future competitiveness.
Request a Free Sample
Fill in your details and we'll send you a free sample report.
- Sample data tables & charts
- Research methodology
Need a Custom Version of This Report?
Tailor the scope, geography, or segments to your exact requirements.
- Custom geography or segment scope
- Direct access to our analyst team
Frequently Asked Questions
What is the current market size for the Consumer Electronics Market, and what is its projected size in 2032?
At what Compound Annual Growth Rate is the Consumer Electronics Market projected to grow between 2025 and 2032?
Which Consumer Electronics Market segment held the largest share in 2024?
What are the primary factors fueling the growth of the Consumer Electronics Market?
Who are the leading companies in the Consumer Electronics Market?
Which region commanded the largest share of the Consumer Electronics Market in 2024?
Table of Content
Chapter 1. Report Introduction
- 1.1 Report Description & Purpose
- 1.1.1 Report Title & Market Definition
- 1.1.2 Unique Selling Propositions (USP) & Key Differentiators
- 1.1.3 Value Proposition for Stakeholders
- 1.2 Research Objectives
- 1.2.1 Market Sizing Objectives (Volume & Revenue)
- 1.2.2 Segmentation Objectives
- 1.2.3 Competitive Intelligence Objectives
- 1.2.4 Forecast & Scenario Objectives
- 1.3 Report Scope
- 1.3.1 Consumer Electronics Scope – Types & Subtypes Covered
- 1.3.2 Geographic Scope – Regions & Countries Covered
- 1.3.3 Historical Period, Base Year & Forecast Period (2024; forecast to 2032)
- 1.3.4 Inclusions & Exclusions
- 1.4 HS Code & Classification Framework
- 1.5 Currency, Units & Pricing Basis
- 1.6 Target Stakeholders
- 1.7 Limitations & Assumptions
Chapter 2. Executive Summary
- 2.1 Global Consumer Electronics Market Snapshot
- 2.1.1 Market Size – Historical (2024) & Forecast (2024-2032) (2024: USD 1104.79 billion → 2032: USD 2075.38 billion)
- 2.1.2 Volume & Revenue – Global Totals
- 2.1.3 Key Market Highlights – Top Five Facts
- 2.2 Consumer Electronics Market Segmentation Snapshot
- 2.2.1 Market Split by Region – 2024 vs. 2032
- 2.3 Competitive Snapshot
- 2.3.1 Top 10 Players by Revenue Share – 2024
- 2.3.2 Top 10 Players by Volume Share – 2024
- 2.3.3 Recent Strategic Developments (18-Month Summary)
- 2.4 Key Investment Highlights & Strategic Conclusions
Chapter 3. Consumer Electronics Market Dynamics & Industry Analysis
- 3.1 Market Overview & Context
- 3.1.1 Consumer Electronics Market Position in the Broader Automotive Value Chain
- 3.1.2 OEM vs. Replacement Market Dynamics
- 3.1.3 Market Maturity & Development Stage by Region
- 3.2 Consumer Electronics Market Drivers
- 3.3 Consumer Electronics Market Restraints & Challenges
- 3.4 Consumer Electronics Market Opportunities
- 3.5 Porter's Five Forces Analysis
- 3.5.1 Threat of New Entrants
- 3.5.2 Bargaining Power of Suppliers
- 3.5.3 Bargaining Power of Buyers
- 3.5.4 Threat of Substitutes
- 3.5.5 Competitive Rivalry – Intensity Assessment
- 3.6 Consumer Electronics Value Chain Analysis
- 3.6.1 Upstream – Raw Material/Input Suppliers
- 3.6.1.1 Raw Material/Input 1
- 3.6.1.2 Raw Material/Input 2
- 3.6.1.3 Raw Material/Input 3
- 3.6.2 Midstream – Production/Manufacturing/Service Delivery
- 3.6.2.1 Production/Process Overview
- 3.6.2.2 Key Facility Locations & Capacity by Manufacturer
- 3.6.3 Downstream – Distribution & End Consumer
- 3.6.3.1 Primary Channel – B2B/OEM
- 3.6.3.2 Secondary Channels – Dealer, Retail, Online, Direct
- 3.6.4 Value Chain Profitability Analysis
- 3.6.1 Upstream – Raw Material/Input Suppliers
- 3.7 PESTEL Analysis
- 3.7.1 Political Factors
- 3.7.2 Economic Factors
- 3.7.3 Social Factors
- 3.7.4 Technological Factors
- 3.7.5 Environmental Factors
- 3.7.6 Legal Factors
- 3.8 Consumer Electronics Supply Chain Analysis
- 3.8.1 Raw Material/Input Supply Risk Assessment
- 3.8.2 Manufacturing Concentration Risk (Geographic Exposure)
- 3.8.3 Trade Disruption Impact Analysis
- 3.9 Regulatory & Policy Landscape
Note: The regulatory and policy landscape section covers regulations based on their applicability to the market, Consumer Electronics category, geography, and scope of the study. Only regulatory frameworks with a material impact on operations, compliance, trade, sustainability, or market access are analyzed in detail.
Chapter 4. Key Investment Pockets & Opportunity Analysis
- 4.1 Consumer Electronics Market Attractiveness Analysis
- 4.1.1 By Region – Investment Attractiveness Matrix (Volume × CAGR)
- 4.2 Absolute Revenue Growth Opportunity
- 4.2.1 By Region – Absolute USD Growth Through 2032
- 4.3 Incremental Volume Opportunity
- 4.3.1 By Region – Incremental Volume Through 2032
- 4.3.2 Segment – Incremental Volume
- 4.4 Emerging Submarket Opportunity Deep Dive (Subject to Applicability)
- 4.5 Emerging Market Opportunity Scorecards
- 4.5.1 United States
- 4.5.2 Europe
- 4.5.3 Asia
- 4.5.4 Middle East & Africa
Note: Emerging Market Opportunity Scorecards will be included based on relevance and strategic importance. Regions listed are indicative and may vary depending on data availability and market dynamics.
Chapter 5. Consumer Electronics Import-Export Analysis & Trade Flows
- 5.1 Global Trade Overview
- 5.1.1 Global Export Value by Country (2024)
- 5.1.2 Global Export Volume by Country (2024)
- 5.1.3 Global Import Value by Country (2024)
- 5.1.4 Global Import Volume by Country (2024)
- 5.1.5 Net Trade Balance by Country (2024)
- 5.2 Export Analysis – Segment
- 5.2.1 Type 1 (HS Code)
- 5.2.2 Type 2 (HS Code)
- 5.2.3 Type 3 (HS Code)
- 5.2.4 Type 4 (HS Code)
- 5.2.5 Type 5 (HS Code)
- 5.3 Import Analysis – Segment
- 5.3.1 Type 1 (HS Code)
- 5.3.2 Type 2 (HS Code)
- 5.3.3 Type 3 (HS Code)
- 5.3.4 Type 4 (HS Code)
- 5.3.5 Type 5 (HS Code)
- 5.4 Average Unit Trade Prices
- 5.4.1 Average Export Price – Segment & Country
- 5.4.2 Average Import Price – Segment & Source Country
- 5.4.3 Price Trends (2024)
- 5.5 Key Trade Route Analysis
- 5.5.1 Trade Route 1
- 5.5.2 Trade Route 2
- 5.5.3 Trade Route 3
- 5.5.4 Trade Route 4
- 5.5.5 Trade Route 5
- 5.6 Trade Policy Impact Assessment
- 5.6.1 US Anti-Dumping & Section 301 Tariffs
- 5.6.2 EU Customs Union Impact
- 5.6.3 Major Free Trade Agreements
- 5.6.4 USMCA Rules of Origin
Note: Trade policy analysis will be included only where relevant to the Consumer Electronics market.
Chapter 6. Competitive Landscape & Company Benchmarking
- 6.1 Consumer Electronics Market Concentration & Structure
- 6.1.1 Herfindahl-Hirschman Index (HHI) – vs. 2024
- 6.1.2 Tier 1, Tier 2 & Tier 3 Market Structure
- 6.1.3 Global, Regional & Local Player Dynamics
- 6.2 Consumer Electronics Market Share Analysis – 2024
- 6.2.1 Global Revenue Share by Company
- 6.2.2 Global Volume Share by Company
- 6.2.3 Regional Revenue Share
- 6.2.4 Market Share Evolution ( vs. 2024)
- 6.2.5 OEM Segment Share by Company
- 6.2.6 Replacement Segment Share by Company
- 6.3 Production/Delivery Capacity & Facility Analysis
- 6.3.1 Global Installed Capacity
- 6.3.2 Capacity Utilization Rates
- 6.3.3 Production/Output Volume
- 6.3.4 Facility Locations & Capacity Map
- 6.3.5 Planned Capacity Additions
- 6.4 Consumer Electronics Competitive Benchmarking Matrix
- 6.4.1 Revenue, Volume, CAGR & Profitability Comparison
- 6.4.2 Channel Revenue Mix
- 6.4.3 Geographic Revenue Exposure
- 6.4.4 R&D Intensity
- 6.4.5 Sustainability Maturity
- 6.5 Strategic Developments in Consumer Electronics (Last 24 Months)
- 6.5.1 Mergers, Acquisitions & Divestments
- 6.5.2 New Consumer Electronics Launches
- 6.5.3 Facility Expansions
- 6.5.4 Strategic Alliances, Joint Ventures & Partnerships
- 6.5.5 Distribution Expansion & Market Entry
- 6.5.6 Sustainability & ESG Initiatives
- 6.6 Competitive Strategy Mapping
- 6.6.1 Leader, Challenger, Follower & Niche Classification
- 6.6.2 Pricing Strategy Comparison
- 6.6.3 Channel Strategy Matrix
Note: Strategic developments are included based on their materiality and the availability of reliable information.
Chapter 7. Global Consumer Electronics Market – By Distribution Channel
- 7.1 Segment Overview
- 7.1.1 Volume & Revenue Split by Channel (2024 & 2032)
- 7.1.2 Channel Mix Evolution (2024-2032)
Chapter 8. Regional Market Analysis – Global Overview
- 8.1 Global Regional Overview
- 8.1.1 Regional Volume Share
- 8.1.2 Regional Revenue Share
- 8.1.3 Regional Volume by Region
- 8.1.4 Regional Revenue by Region
- 8.1.5 Regional Forecast Through 2032
- 8.2 Cross-Regional Segment Analysis
- 8.2.1 By Distribution Channel
- 8.2.2 By Brand/Price Tier
Chapter 9. North America Consumer Electronics Market
- 9.1 United States
- 9.2 Canada
- 9.3 Mexico
Chapter 10. Europe Consumer Electronics Market
- 10.1 Germany
- 10.2 France
- 10.3 Italy
- 10.4 United Kingdom
- 10.5 Spain
- 10.6 Poland
- 10.7 Russia
- 10.8 Netherlands
- 10.9 Belgium
- 10.10 Sweden
- 10.11 Denmark
- 10.12 Norway
- 10.13 Rest of Europe
Chapter 11. Asia Pacific Consumer Electronics Market
- 11.1 China
- 11.2 India
- 11.3 Japan
- 11.4 South Korea
- 11.5 Thailand
- 11.6 Indonesia
- 11.7 Vietnam
- 11.8 Malaysia
- 11.9 Australia
- 11.10 Rest of Asia Pacific
Chapter 12. Latin America Consumer Electronics Market
- 12.1 Brazil
- 12.2 Argentina
- 12.3 Colombia
- 12.4 Chile
- 12.5 Rest of Latin America
Chapter 13. Middle East Consumer Electronics Market
- 13.1 Saudi Arabia
- 13.2 United Arab Emirates
- 13.3 Turkey
- 13.4 Israel
- 13.5 Iran
- 13.6 Rest of the Middle East
Chapter 14. Africa Consumer Electronics Market
- 14.1 South Africa
- 14.2 Egypt
- 14.3 Nigeria
- 14.4 Morocco
- 14.5 Rest of Africa
Chapter 15. Consumer Electronics Company Profiles
- 15.1 [Company 01]
- 15.1.1 Company Overview
- 15.1.2 Key Management Personnel
- 15.1.3 Products & Services Portfolio
- 15.1.4 Financial Performance
- 15.1.5 Key Market Focus & Geographic Presence
- 15.1.6 Recent Developments & Strategic Initiatives
Note: The company profile list is preliminary and may change based on research findings, market developments, data availability, and client requirements.
Chapter 16. Appendices
- Appendix A – List of Abbreviations & Acronyms
- Appendix B – Industry Classification Code Reference – Full Series
- Appendix C – Production & Capacity Data Tables
- Appendix D – End-Use & Demand Base Tables
- Appendix E – Consumption & Replacement Rate Assumptions
- Appendix F – ASP Reference Tables
- Appendix G – Manufacturing & Facility Database
- Appendix H – Import-Export Data Tables
- Appendix I – Regulatory Summary Tables
- Appendix J – Primary Research Participant List (Anonymized)
- Appendix K – Primary Research Questionnaire Framework
- Appendix L – Data Sources & Bibliography
- Appendix M – Market Size Divergence & Source Comparison
Chapter 17. Research Methodology
- 17.1 Research Framework & Philosophy
- 17.2 Secondary Research – Sources, Hierarchy & Data Extraction
- 17.3 Data Modeling – Bottom-Up & Top-Down Market Sizing
- 17.4 Primary Research – Stakeholder Framework, LOI & Sample Sizes
- 17.5 Forecast Methodology – Regression, Scenario & Sensitivity Analysis
- 17.6 Quality Control – Four-Layer Validation Framework
- 17.7 Limitations & Standard Assumptions
- 17.8 Disclaimer
