
| REPORT ATTRIBUTE | DETAILS |
|---|---|
| Historical Period | 2019-2022 |
| Base Year | 2023 |
| Forecast Period | 2024-2032 |
| Convertible Shipper Display Market Size 2024 | USD 48,612 Million |
| Convertible Shipper Display Market, CAGR | 6.2% |
| Convertible Shipper Display Market Size 2032 | USD 78,657.4 Million |
Market Overview:
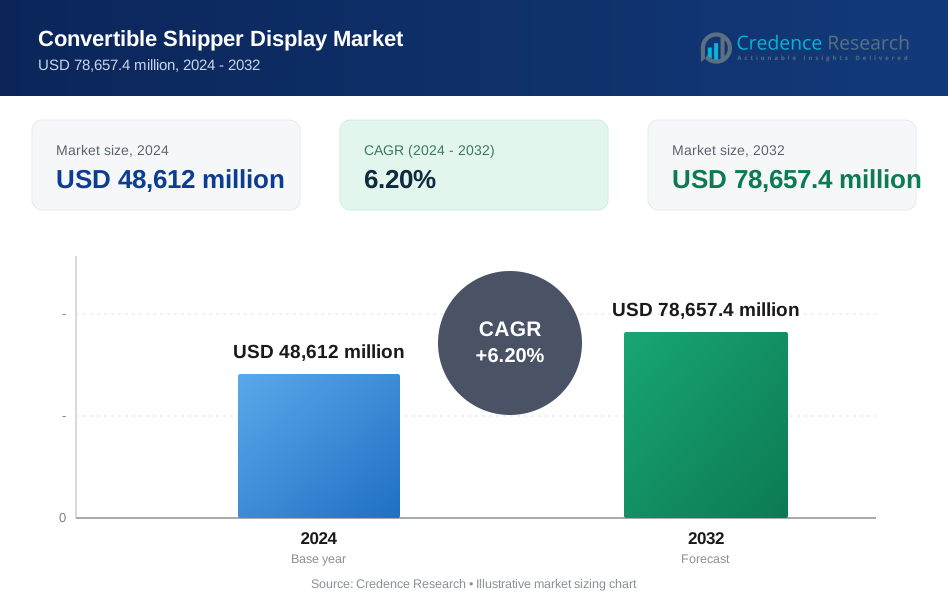
The global Convertible Shipper Display Market is projected to grow from USD 48,612 million in 2024 to USD 78,657.4 million by 2032, at a compound annual growth rate (CAGR) of 6.2% during the forecast period.
Several factors are driving the growth of the Convertible Shipper Display Market. The rise of retail-ready packaging and the growing prominence of in-store marketing strategies have amplified the demand for visually appealing and functional packaging. Consumers make purchase decisions in-store, underscoring the importance of packaging that enhances brand visibility. Additionally, the increasing focus on sustainability has led to widespread adoption of recyclable and biodegradable materials in shipper displays, with 65% of global retailers prioritizing eco-friendly packaging to meet consumer expectations and comply with regulatory demands. The rapid expansion of e-commerce further supports market growth, as these solutions optimize space while improving product visibility during delivery and in stores.
Regionally, North America leads the market, driven by a robust retail sector, widespread use of eco-friendly packaging, and a strong presence of consumer goods companies. Sustainability initiatives, which push suppliers toward recyclable display packaging, have significantly increased demand in the region. Europe follows closely, supported by stringent sustainability regulations and innovative retail practices. The Asia-Pacific region is anticipated to witness the fastest growth, fueled by rapid urbanization, rising disposable income, and the expansion of organized retail and e-commerce in countries like China and India. Latin America and the Middle East & Africa are also emerging markets, benefiting from increased investment in retail infrastructure and growing awareness of sustainable packaging solutions.
Market Insights:
- The Convertible Shipper Display Market is expected to grow significantly from USD 48,612 million in 2024 to USD 78,657.4 million by 2032, driven by increasing demand for versatile packaging solutions.
- The rise of retail-ready packaging and in-store marketing strategies enhances the appeal of shipper displays for efficient and attractive product presentation.
- Adoption of recyclable and biodegradable materials aligns with consumer preferences and regulatory mandates, boosting market demand.
- The rapid growth of e-commerce drives demand for dual-purpose packaging that optimizes space and ensures product visibility during delivery and in-store display.
- The relatively higher cost of eco-friendly and customized solutions may hinder adoption among smaller retailers and manufacturers.
- A strong retail sector and sustainability initiatives contribute to North America holding the largest market share.
- Rapid urbanization, rising disposable incomes, and the expansion of organized retail in countries like China and India make Asia-Pacific the fastest-growing region.
Market Drivers:
Retail Industry Growth and Supermarket Sales:
The growth of the retail industry and the increasing sales in supermarkets worldwide are primary drivers for the Convertible Shipper Display Market. For instance, the National Retail Federation (NRF) predicts that retail sales will climb by 4-6% by the end of 2023 compared to the previous year, indicating a highly favorable prognosis for the industry. This growth is fueled by the need for efficient product display solutions that enhance consumer shopping experiences and encourage impulse purchases. Convertible shipper displays, designed to be both transport and showcase packaging, are increasingly adopted by retailers to optimize shelf space and streamline replenishment operations, thereby reducing labor costs and increasing store efficiency.
Sustainability and Environmental Concerns:
Environmental consciousness is a significant driver for the Convertible Shipper Display Market. For instance, according to the Environmental Protection Agency (EPA), in 2021, the U.S. generated 40 million tons of plastic waste, with only 5% to 6% being recycled. This low recycling rate has led to a push for sustainable packaging solutions, including convertible shipper displays made from recyclable materials like corrugated or solid board. Companies are responding to consumer demand for eco-friendly packaging, with initiatives like the EU Plastics Strategy creating regulatory incentives for refillable and recyclable packaging. This trend is further supported by the fact that 50% of consumers consider it essential to know where a product’s packaging can be recycled and how to recycle it.
Technological Advancements and Digitalization:
Technological advancements and the integration of digital solutions are driving the Convertible Shipper Display Market. For instance, reports that global consumers prefer digitally advanced products, and see high-tech features as essential or nice to have when selecting purchases. This demand for digitalization extends to packaging, where QR codes and interactive elements are being incorporated into convertible shipper displays to enhance consumer engagement and facilitate digital payments. These innovations not only improve the consumer experience but also provide manufacturers with valuable data on consumer behavior and preferences.
E-commerce and Supply Chain Efficiency:
The rise of e-commerce platforms and the need for efficient supply chain management are also key drivers for the Convertible Shipper Display Market. For instance, the U.S. Census data indicates that retail outlets continue to be the primary place for most consumers to shop, but the fast rise of e-commerce has boosted the use of ready retail packaging. Convertible shipper displays are designed to be lightweight, strong, and easy to handle, making them ideal for logistics and supply chain management. They help in reducing freight costs, ensuring proper product orientation during transportation, and promoting products through high-quality printing techniques, thereby meeting the demands of both online and offline retail environments.
Market Trends:
Adoption of Sustainable Packaging Solutions:
Sustainability has become a central focus in the packaging industry, with increasing adoption of recyclable and biodegradable materials in convertible shipper displays. A report highlighted that 60% of global packaging companies have committed to using at least 50% recycled content by 2030. For instance, Unilever has implemented fully recyclable shipper displays across its product lines, reducing plastic usage by 35% annually. This shift is driven by consumer demand for eco-friendly products and regulatory policies, such as the European Union's Packaging Waste Directive, which aims for 65% recycling by 2025. Additionally, Unilever has set ambitious goals to reduce its virgin plastic footprint by 30% by 2026 and 40% by 2028, further emphasizing the company's commitment to sustainability.
Integration of Innovative Design Features:
Innovative designs that enhance functionality and visual appeal are gaining traction in the convertible shipper display market. Companies like Nestlé have introduced modular designs that can be easily transformed from shipping containers to retail displays, saving time and resources. According to a study by Packaging World, retailers report a 25% reduction in labor costs when using convertible displays with pre-assembled structures. These advancements cater to the growing demand for efficient, visually appealing, and cost-effective solutions in retail environments. For instance, Nestlé's semi-automated Pallet Shuttle system has enabled the management of perishable goods according to the FIFO strategy, speeding up the entries and exits of 500 pallets a day.
Rising Demand from E-Commerce Channels:
The rapid growth of e-commerce is driving the demand for convertible shipper displays optimized for delivery and product visibility. A report noted that global e-commerce sales increased by 20% in 2023, fueling the need for packaging that protects products during transit while doubling as display units. For instance, Amazon introduced a display-ready shipping solution for electronics, reducing damages during delivery by 30%. This trend reflects the dual-purpose functionality demanded by online retailers to streamline operations. Additionally, Amazon's redesigned packaging for Echo, Kindle, and Fire TV products uses an average of 30% more recycled content and 60% less ink than the previous design, further supporting sustainability efforts.
Regional Emphasis on Retail-Ready Packaging:
Retail-ready packaging is gaining momentum globally, with regional initiatives emphasizing efficiency and sustainability. Walmart’s "Sustainable Packaging Playbook" in North America has influenced suppliers to adopt recyclable and reusable display packaging, boosting market demand. Similarly, in Asia-Pacific, the Indian government’s "Make in India" initiative has encouraged the local production of innovative packaging solutions, leading to a 25% annual growth in demand for retail-ready displays. These regional efforts underscore the increasing importance of convertible shipper displays in modern retail strategies. For instance, the European Union's Packaging and Packaging Waste Regulation (PPWR) aims to make all packaging on the EU market recyclable in an economically viable way by 2030, further driving the adoption of sustainable packaging solutions.
Market Challenges Analysis:
High Costs of Sustainable Materials and Customization:
One of the primary restraints in the convertible shipper display market is the high cost associated with sustainable materials and customized designs. Biodegradable and recyclable materials, while environmentally beneficial, are often more expensive than traditional options. According to the U.S. Environmental Protection Agency (EPA), recyclable materials can cost 20–30% more than conventional plastics and cardboard due to their processing requirements and limited availability. This cost disparity makes it challenging for small and medium-sized enterprises (SMEs) to adopt eco-friendly solutions while maintaining cost efficiency. A survey by the National Association of Manufacturers indicated that over 40% of SMEs cite high material costs as a barrier to implementing sustainable packaging.
Complex Regulatory Compliance:
Stringent packaging regulations create additional hurdles for manufacturers in the market. The European Union’s Packaging and Packaging Waste Directive mandates that 65% of packaging materials be recycled by 2025, requiring significant investment in recycling infrastructure and material innovation. Similarly, the U.S. Food and Drug Administration (FDA) enforces strict guidelines on packaging used for food and beverages, adding complexity to the compliance process. A report by the European Environmental Agency revealed that compliance-related costs increase production expenses by 10–15%, delaying product launches and creating financial pressure on manufacturers.
Logistical and Operational Constraints:
Logistical inefficiencies in managing dual-purpose packaging designs further challenge market growth. According to the World Trade Organization (WTO), supply chain inefficiencies result in packaging cost increases of up to 15% in developing regions. The bulky nature of some convertible shipper displays exacerbates transportation and storage costs, making it difficult for retailers to optimize operations. A study by the International Transport Forum highlighted that improving logistics coordination could reduce costs by 12%, emphasizing the need for streamlined supply chains.
Limited Awareness and Adoption in Emerging Markets:
Adoption of convertible shipper displays remains low in emerging markets due to insufficient recycling infrastructure and limited consumer education. In Brazil, for example, only 30% of municipal waste is recycled, according to the National Sanitation Information System (SNIS). Similarly, in South Africa, a lack of awareness about sustainable packaging options among small businesses limits adoption rates. Investment in awareness campaigns and recycling infrastructure by global organizations and governments is essential to address these challenges.
Market Opportunities:
The Convertible Shipper Display Market presents significant growth opportunities driven by the rising demand for sustainable and multifunctional packaging solutions. As businesses and consumers increasingly prioritize eco-friendly practices, there is a growing opportunity for manufacturers to develop innovative, recyclable, and biodegradable shipper displays. Government regulations, such as the European Union's Packaging Waste Directive and the U.S. Environmental Protection Agency's sustainability initiatives, are further accelerating this trend by encouraging companies to adopt environmentally responsible packaging. Moreover, the integration of advanced materials and technologies, such as smart packaging with tracking capabilities, can enhance functionality and appeal, meeting the evolving needs of retailers and e-commerce platforms. Companies that invest in these innovations are poised to capture a competitive edge in the market.
Emerging markets, particularly in Asia-Pacific and Latin America, offer another significant avenue for growth. Rapid urbanization and the expansion of organized retail and e-commerce in countries like India, China, and Brazil are driving the demand for efficient and cost-effective packaging solutions. Local governments, such as India’s “Make in India” initiative, are encouraging the domestic production of innovative packaging, opening doors for regional manufacturers to expand their offerings. Additionally, the increasing penetration of e-commerce platforms in these regions creates opportunities for dual-purpose packaging that optimizes product visibility and transportation efficiency. These factors collectively highlight the untapped potential in the market, enabling companies to cater to a diverse consumer base while addressing global sustainability challenges.
Market Segmentation Analysis:
By Type
The market is categorized into cardboard, plastic, and other materials. Cardboard displays dominate due to their eco-friendly properties, ease of customization, and cost-effectiveness. With rising consumer preference for sustainable solutions, recyclable cardboard displays are increasingly favored. Plastic displays, although durable and lightweight, face growing scrutiny due to environmental concerns, pushing manufacturers to explore recyclable plastic options.
By Application
The market serves a wide range of industries, including food and beverages, personal care, electronics, and retail. The food and beverage sector accounts for a significant share, driven by the need for efficient packaging and visually appealing displays in retail settings. Personal care products, requiring attractive presentation and compact designs, also contribute significantly to demand. Electronics and other retail categories are leveraging shipper displays for improved product visibility and reduced transit damages.
By Geography
Regionally, North America leads the market, driven by a well-established retail industry and strong adoption of eco-friendly practices. Europe follows closely, supported by stringent packaging regulations and sustainability initiatives. The Asia-Pacific region is experiencing rapid growth, fueled by urbanization, increasing disposable income, and the expansion of organized retail in countries like China and India. Latin America and the Middle East & Africa are emerging markets, benefiting from growing investments in retail infrastructure and the increasing adoption of sustainable packaging.
Segmentations:
By Type
- Corrugated
- Solid Board
By Application
- Food & Beverages
- Cosmetics & Personal Care
- Electronics
- Pharmaceuticals
- Others
By Geography
- North America
- The U.S.
- Canada
- Mexico
- Europe
- Germany
- France
- The U.K.
- Italy
- Spain
- Rest of Europe
- Asia Pacific
- China
- Japan
- India
- South Korea
- South-east Asia
- Rest of Asia Pacific
- Latin America
- Brazil
- Argentina
- Rest of Latin America
- Middle East & Africa
- GCC Countries
- South Africa
- Rest of the Middle East and Africa
Regional Analysis:
North America
North America holds the largest market share in the Convertible Shipper Display Market, accounting for 35% of global revenue. This dominance is driven by a robust retail sector and strong sustainability initiatives. For instance, major retailers like Walmart and Target have implemented sustainable packaging practices, prompting suppliers to adopt eco-friendly convertible shipper displays. According to the U.S. Environmental Protection Agency (EPA), over 60% of packaging waste in the region is recycled, emphasizing the focus on environmentally responsible practices. The high adoption of retail-ready packaging by consumer goods companies further contributes to market growth.
Europe
Europe captures 30% of the market share, driven by stringent regulations and consumer demand for sustainable packaging. For instance, the European Union's Packaging and Packaging Waste Directive, which mandates 65% recycling of packaging materials by 2025, has accelerated the shift toward recyclable shipper displays. Countries like Germany, France, and the UK lead in adopting biodegradable packaging solutions. A report by the European Environmental Agency highlighted that 75% of businesses in the region have adopted sustainable packaging practices, further boosting demand for convertible shipper displays.
Asia-Pacific
Asia-Pacific accounts for 25% of the market share and is the fastest-growing region. Rapid urbanization and increasing disposable income in countries like China, India, and Indonesia are fueling demand. For instance, the expansion of organized retail and e-commerce platforms, growing at 20% annually in India, has significantly increased the use of convertible shipper displays. Government initiatives like India’s “Make in India” program encourage domestic production of innovative packaging solutions, further driving regional growth.
Latin America and the Middle East & Africa
Latin America and the Middle East & Africa hold a combined market share of 10%, with increasing investments in retail infrastructure and sustainability practices driving growth. For instance, Brazil’s retail sector has seen a 15% annual increase in demand for retail-ready packaging, while South Africa is investing in recycling infrastructure to align with global sustainability standards. The gradual adoption of advanced packaging solutions in these regions presents significant growth opportunities for market players.
Key Player Analysis:
- Easternpak
- UNIPAKNILE Ltd
- UNIPAKCYPRUS Ltd
- INDEVCO Paper Containers
- Delkor Systems, Inc.
- DS Smith Plc
- International Paper Company
- Smurfit Kappa Group PLC
- Menasha Packaging Company, LLC.
- WestRock Company
Competitive Analysis:
The Convertible Shipper Display Market is highly competitive, with key players such as DS Smith Plc, Smurfit Kappa Group, International Paper Company, and WestRock Company driving innovation and market growth. These companies leverage their strong supply chain networks, advanced manufacturing capabilities, and focus on sustainability to maintain a competitive edge. For instance, Smurfit Kappa has introduced fully recyclable and biodegradable shipper displays that align with global sustainability goals, contributing to a 15% increase in its packaging segment revenue. Additionally, DS Smith’s investment in innovative designs has enabled it to cater to the growing demand for retail-ready packaging across Europe and North America. DS Smith's focus on sustainability has led to a 10% increase in its market share in the European region. The market also sees competition from smaller regional players focusing on cost-effective and customized solutions, particularly in emerging economies. In Brazil, local companies have seen a 20% growth in demand for customized shipper displays due to the expansion of retail sectors. As businesses increasingly prioritize eco-friendly practices and retail-ready packaging, companies investing in sustainability and design innovations are well-positioned for growth.
Recent Developments:
- In November 2024 UNIPAKNILE completed Phase One of its corrugating line upgrade, focusing on improving efficiency and sustainability in their operations.
- In November 2022 UNIPAKCYPRUS, in collaboration with UNIPAKHELLAS, introduced a solution to streamline the return process for e-commerce packaging, addressing the growing market demand for efficient packaging solutions.
- In November 2024 Delkor Systems will be presenting at Pack Expo International, showcasing their latest innovations in retail-ready packaging, including the EVO Case Packer and Trayfecta X Series Former.
- In October 2024 DS Smith announced half-year results for 2024/25, reporting a like-for-like box volume growth of 2% and continued investment in customer service, quality, and innovation.
Market Concentration & Characteristics:
The Convertible Shipper Display Market is moderately fragmented, with a mix of global leaders and regional players catering to diverse industry needs. Prominent companies such as DS Smith Plc, Smurfit Kappa Group, and International Paper Company hold a significant market share, driven by their extensive distribution networks, innovation capabilities, and focus on sustainability. These players dominate in developed markets like North America and Europe, where demand for high-quality, eco-friendly packaging is robust. Regional players, particularly in Asia-Pacific and Latin America, are gaining traction by offering cost-effective and tailored solutions for emerging economies. The market is characterized by rapid innovation in design and materials, with growing emphasis on recyclable and biodegradable packaging. Increasing demand from retail and e-commerce industries, coupled with evolving consumer preferences for sustainable and visually appealing solutions, shapes the competitive dynamics of the market.
Report Coverage:
The research report offers an in-depth analysis based on Type, Application, and Geography. It details leading market players, providing an overview of their business, product offerings, investments, revenue streams, and key applications. Additionally, the report includes insights into the competitive environment, SWOT analysis, current market trends, as well as the primary drivers and constraints. Furthermore, it discusses various factors that have driven market expansion in recent years. The report also explores market dynamics, regulatory scenarios, and technological advancements that are shaping the industry. It assesses the impact of external factors and global economic changes on market growth. Lastly, it provides strategic recommendations for new entrants and established companies to navigate the complexities of the market.
Future Outlook:
- The demand for sustainable and recyclable materials in shipper displays is expected to grow, driven by increasing regulatory requirements and consumer preferences for eco-friendly packaging.
- Advancements in material technology will lead to the development of lightweight, durable, and biodegradable packaging solutions, enhancing their appeal across industries.
- The rapid expansion of e-commerce platforms will continue to fuel the adoption of convertible shipper displays that optimize space and ensure product safety during transit.
- Growth in retail-ready packaging will drive innovation in design, focusing on functionality and visual appeal to enhance in-store marketing strategies.
- Emerging markets in Asia-Pacific and Latin America will present significant growth opportunities due to rising urbanization and expanding retail infrastructure.
- Increased investment in automation and smart packaging technologies will enable manufacturers to improve production efficiency and meet growing demand.
- Collaboration between manufacturers and retailers to develop customized solutions tailored to specific industry needs will become more prominent.
- Sustainability-focused initiatives by global brands and governments will encourage the adoption of environmentally responsible packaging solutions.
- The integration of digital tools, such as QR codes and augmented reality, into shipper displays will enhance consumer engagement and brand interaction.
- Rising awareness of waste management and recycling practices will further accelerate the shift towards sustainable packaging in developed and developing regions.
Request a Free Sample
Fill in your details and we'll send you a free sample report.
- Sample data tables & charts
- Research methodology
Need a Custom Version of This Report?
Tailor the scope, geography, or segments to your exact requirements.
- Custom geography or segment scope
- Direct access to our analyst team
Frequently Asked Questions
What is the current size of the Convertible Shipper Display Market?
What factors are driving the growth of the Convertible Shipper Display Market?
What are some challenges faced by the Convertible Shipper Display Market?
Who are the major players in the Convertible Shipper Display Market?
Which segment is leading the market share?
Table of Content
Chapter 1. Report Introduction
- 1.1 Report Description & Purpose
- 1.1.1 Report Title & Market Definition
- 1.1.2 Unique Selling Propositions (USP) & Key Differentiators
- 1.1.3 Value Proposition for Stakeholders
- 1.2 Research Objectives
- 1.2.1 Market Sizing Objectives (Volume & Revenue) (Volume Where Applicable)
- 1.2.2 Segmentation Objectives
- 1.2.3 Competitive Intelligence Objectives
- 1.2.4 Forecast & Scenario Objectives
- 1.3 Report Scope
- 1.3.1 Convertible Shipper Display Scope – Segments & Subsegments Covered
- 1.3.2 Geographic Scope – Regions & Countries Covered
- 1.3.3 Historical Period, Base Year & Forecast Period (2024; forecast to 2032)
- 1.3.4 Inclusions & Exclusions
- 1.4 Industry Classification & Applicable Codes
- 1.5 Currency, Measurement Units & Valuation Basis
- 1.6 Target Stakeholders
- 1.7 Limitations & Assumptions
Chapter 2. Executive Summary
- 2.1 Global Convertible Shipper Display Market Snapshot
- 2.1.1 Market Size – Historical (2024) & Forecast (2024-2032) (2024: USD 48,612 million → 2032: USD 78,657.4 million)
- 2.1.2 Volume & Revenue – Global Totals (Volume Where Applicable)
- 2.1.3 Key Market Highlights – Top Five Facts
- 2.2 Convertible Shipper Display Market Segmentation Snapshot
- 2.2.1 Market Split by Region – 2024 vs. 2032
- 2.3 Competitive Snapshot
- 2.3.1 Top 10 Players by Revenue Share – 2024
- 2.3.2 Top 10 Players by Volume Share – 2024 (Volume Where Applicable)
- 2.3.3 Recent Strategic Developments (18-Month Summary)
- 2.4 Key Investment Highlights & Strategic Conclusions
Chapter 3. Convertible Shipper Display Market Dynamics & Industry Analysis
- 3.1 Market Overview & Context
- 3.1.1 Convertible Shipper Display Market Position in the Broader Industry Value Chain
- 3.1.2 Demand Structure & Purchasing Dynamics
- 3.1.3 Market Maturity & Development Stage by Region
- 3.2 Convertible Shipper Display Market Drivers
- 3.3 Convertible Shipper Display Market Restraints & Challenges
- 3.4 Convertible Shipper Display Market Opportunities
- 3.5 Porter's Five Forces Analysis
- 3.5.1 Threat of New Entrants
- 3.5.2 Bargaining Power of Suppliers
- 3.5.3 Bargaining Power of Buyers
- 3.5.4 Threat of Substitutes
- 3.5.5 Competitive Rivalry – Intensity Assessment
- 3.6 Convertible Shipper Display Value Chain Analysis
- 3.6.1 Upstream – Key Inputs, Resources & Suppliers
- 3.6.1.1 Key Input/Resource 1
- 3.6.1.2 Key Input/Resource 2
- 3.6.1.3 Key Input/Resource 3
- 3.6.2 Midstream – Core Operations & Value Creation
- 3.6.2.1 Operating Model & Process Overview
- 3.6.2.2 Key Operating Locations & Capabilities by Company
- 3.6.3 Downstream – Market Channels & End Users
- 3.6.3.1 Direct Sales & Customer Engagement Channels
- 3.6.3.2 Indirect Sales, Intermediaries & Partner Channels
- 3.6.4 Value Chain Profitability Analysis
- 3.6.1 Upstream – Key Inputs, Resources & Suppliers
- 3.7 PESTEL Analysis
- 3.7.1 Political Factors
- 3.7.2 Economic Factors
- 3.7.3 Social Factors
- 3.7.4 Technological Factors
- 3.7.5 Environmental Factors
- 3.7.6 Legal Factors
- 3.8 Convertible Shipper Display Supply Chain Analysis
- 3.8.1 Critical Input & Resource Availability Risk Assessment
- 3.8.2 Supplier & Operational Concentration Risk (Geographic Exposure)
- 3.8.3 Supply & Service Disruption Impact Analysis
- 3.9 Regulatory & Policy Landscape
Note: The regulatory and policy landscape section covers regulations based on their applicability to the market, Convertible Shipper Display category, geography, and scope of the study. Only regulatory frameworks with a material impact on operations, compliance, trade, sustainability, or market access are analyzed in detail.
Chapter 4. Key Investment Pockets & Opportunity Analysis
- 4.1 Convertible Shipper Display Market Attractiveness Analysis
- 4.1.1 By Region – Investment Attractiveness Matrix (Market Size × CAGR)
- 4.2 Absolute Revenue Growth Opportunity
- 4.2.1 By Region – Absolute Revenue Growth Through 2032
- 4.3 Incremental Demand Opportunity
- 4.3.1 By Region – Incremental Demand Through 2032
- 4.3.2 Segment – Incremental Demand
- 4.4 Emerging Submarket Opportunity Deep Dive (Subject to Applicability)
- 4.5 Priority Market Opportunity Scorecards
- 4.5.1 United States
- 4.5.2 Europe
- 4.5.3 Asia
- 4.5.4 Middle East & Africa
Note: Priority market opportunity scorecards reflect the geographic scope and strategic relevance of the study. Listed markets are indicative and may be adapted to the industry.
Chapter 5. Convertible Shipper Display Cross-Border Trade & Market Access Analysis
- 5.1 International Trade & Cross-Border Activity Overview
- 5.1.1 Global Export Value by Country (2024)
- 5.1.2 Global Export Volume by Country (2024) (Volume Where Applicable)
- 5.1.3 Global Import Value by Country (2024)
- 5.1.4 Global Import Volume by Country (2024) (Volume Where Applicable)
- 5.1.5 Net Trade Balance by Country (2024)
- 5.2 Export Analysis – Segment
- 5.2.1 Category 1 (Applicable Classification Code)
- 5.2.2 Category 2 (Applicable Classification Code)
- 5.2.3 Category 3 (Applicable Classification Code)
- 5.2.4 Category 4 (Applicable Classification Code)
- 5.2.5 Category 5 (Applicable Classification Code)
- 5.3 Import Analysis – Segment
- 5.3.1 Category 1 (Applicable Classification Code)
- 5.3.2 Category 2 (Applicable Classification Code)
- 5.3.3 Category 3 (Applicable Classification Code)
- 5.3.4 Category 4 (Applicable Classification Code)
- 5.3.5 Category 5 (Applicable Classification Code)
- 5.4 Cross-Border Pricing & Transaction Benchmarks
- 5.4.1 Export Pricing – Segment & Country
- 5.4.2 Import Pricing – Segment & Source Country
- 5.4.3 Price Trends (2024)
- 5.5 Key Cross-Border Trade & Delivery Routes
- 5.5.1 Cross-Border Trade/Delivery Route 1
- 5.5.2 Cross-Border Trade/Delivery Route 2
- 5.5.3 Cross-Border Trade/Delivery Route 3
- 5.5.4 Cross-Border Trade/Delivery Route 4
- 5.5.5 Cross-Border Trade/Delivery Route 5
- 5.6 Trade Policy & Market Access Impact Assessment
- 5.6.1 Tariff & Non-Tariff Barriers
- 5.6.2 Regional Trade & Economic Integration Frameworks
- 5.6.3 Bilateral & Multilateral Trade Agreements
- 5.6.4 Cross-Border Operating, Licensing & Localization Requirements
Note: This chapter applies where cross-border trade or delivery is relevant to Convertible Shipper Display. Goods, services, and digital offerings are assessed using applicable classifications and transaction measures. Import-export volumes, trade balances, and route analyses are included only where meaningful to the market.
Chapter 6. Competitive Landscape & Company Benchmarking
- 6.1 Convertible Shipper Display Market Concentration & Structure
- 6.1.1 Herfindahl-Hirschman Index (HHI) – vs. 2024
- 6.1.2 Leading, Mid-Sized & Emerging Player Structure
- 6.1.3 Global, Regional & Local Player Dynamics
- 6.2 Convertible Shipper Display Market Share Analysis – 2024
- 6.2.1 Global Revenue Share by Company
- 6.2.2 Global Volume Share by Company (Volume Where Applicable)
- 6.2.3 Regional Revenue Share
- 6.2.4 Market Share Evolution ( vs. 2024)
- 6.2.5 Company Market Share by Key Segment
- 6.2.6 Company Market Share by Customer Group
- 6.3 Operating Scale, Capacity & Infrastructure Analysis
- 6.3.1 Global Operating Scale & Supply Capacity
- 6.3.2 Resource Utilization & Operating Efficiency
- 6.3.3 Output, Service Delivery & Activity Metrics
- 6.3.4 Operating Footprint & Infrastructure Map
- 6.3.5 Planned Operational & Capacity Expansion
- 6.4 Convertible Shipper Display Competitive Benchmarking Matrix
- 6.4.1 Revenue, Growth, Profitability & Operating Metric Comparison
- 6.4.2 Channel Revenue Mix
- 6.4.3 Geographic Revenue Exposure
- 6.4.4 R&D Intensity
- 6.4.5 Sustainability Maturity
- 6.5 Strategic Developments in Convertible Shipper Display (Last 24 Months)
- 6.5.1 Mergers, Acquisitions & Divestments
- 6.5.2 New Products, Services & Solutions in Convertible Shipper Display
- 6.5.3 Operational & Infrastructure Expansions
- 6.5.4 Strategic Alliances, Joint Ventures & Partnerships
- 6.5.5 Distribution Expansion & Market Entry
- 6.5.6 Sustainability & ESG Initiatives
- 6.6 Competitive Strategy Mapping
- 6.6.1 Leader, Challenger, Follower & Niche Classification
- 6.6.2 Pricing Strategy Comparison
- 6.6.3 Channel Strategy Matrix
Note: Strategic developments are included based on their materiality and the availability of reliable information.
Chapter 7. Global Convertible Shipper Display Market – By Sales & Delivery Channel
- 7.1 Segment Overview
- 7.1.1 Volume & Revenue Split by Channel (2024 & 2032) (Volume Where Applicable)
- 7.1.2 Channel Mix Evolution (2024-2032)
Chapter 8. Regional Market Analysis – Global Overview
- 8.1 Global Regional Overview
- 8.1.1 Regional Volume Share (Volume Where Applicable)
- 8.1.2 Regional Revenue Share
- 8.1.3 Regional Volume by Region (Volume Where Applicable)
- 8.1.4 Regional Revenue by Region
- 8.1.5 Regional Forecast Through 2032
- 8.2 Cross-Regional Segment Analysis
- 8.2.1 By Sales & Delivery Channel
- 8.2.2 By Competitive Positioning & Price Tier
Chapter 9. North America Convertible Shipper Display Market
- 9.1 United States
- 9.2 Canada
- 9.3 Mexico
Chapter 10. Europe Convertible Shipper Display Market
- 10.1 Germany
- 10.2 France
- 10.3 Italy
- 10.4 United Kingdom
- 10.5 Spain
- 10.6 Poland
- 10.7 Russia
- 10.8 Netherlands
- 10.9 Belgium
- 10.10 Sweden
- 10.11 Denmark
- 10.12 Norway
- 10.13 Rest of Europe
Chapter 11. Asia Pacific Convertible Shipper Display Market
- 11.1 China
- 11.2 India
- 11.3 Japan
- 11.4 South Korea
- 11.5 Thailand
- 11.6 Indonesia
- 11.7 Vietnam
- 11.8 Malaysia
- 11.9 Australia
- 11.10 Rest of Asia Pacific
Chapter 12. Latin America Convertible Shipper Display Market
- 12.1 Brazil
- 12.2 Argentina
- 12.3 Colombia
- 12.4 Chile
- 12.5 Rest of Latin America
Chapter 13. Middle East Convertible Shipper Display Market
- 13.1 Saudi Arabia
- 13.2 United Arab Emirates
- 13.3 Turkey
- 13.4 Israel
- 13.5 Iran
- 13.6 Rest of the Middle East
Chapter 14. Africa Convertible Shipper Display Market
- 14.1 South Africa
- 14.2 Egypt
- 14.3 Nigeria
- 14.4 Morocco
- 14.5 Rest of Africa
Chapter 15. Convertible Shipper Display Company Profiles
- 15.1 [Company 01]
- 15.1.1 Company Overview
- 15.1.2 Key Management Personnel
- 15.1.3 Products & Services Portfolio
- 15.1.4 Financial Performance
- 15.1.5 Key Market Focus & Geographic Presence
- 15.1.6 Recent Developments & Strategic Initiatives
Note: The company profile list is preliminary and may change based on research findings, market developments, data availability, and client requirements.
Chapter 16. Appendices
- Appendix A – List of Abbreviations & Acronyms
- Appendix B – Industry Classification Code Reference – Full Series
- Appendix C – Supply, Output & Operating Capacity Data Tables
- Appendix D – End-Use & Demand Base Tables
- Appendix E – Demand, Adoption & Usage Assumptions
- Appendix F – Pricing & Revenue Metric Reference Tables
- Appendix G – Company Operations & Infrastructure Database
- Appendix H – Cross-Border Trade & Activity Data Tables (Where Applicable)
- Appendix I – Regulatory Summary Tables
- Appendix J – Primary Research Participant List (Anonymized)
- Appendix K – Primary Research Questionnaire Framework
- Appendix L – Data Sources & Bibliography
- Appendix M – Market Size Divergence & Source Comparison
Chapter 17. Research Methodology
- 17.1 Research Framework & Philosophy
- 17.2 Secondary Research – Sources, Hierarchy & Data Extraction
- 17.3 Data Modeling – Bottom-Up & Top-Down Market Sizing
- 17.4 Primary Research – Stakeholder Framework, LOI & Sample Sizes
- 17.5 Forecast Methodology – Regression, Scenario & Sensitivity Analysis
- 17.6 Quality Control – Four-Layer Validation Framework
- 17.7 Limitations & Standard Assumptions
- 17.8 Disclaimer
