
Market Overview:
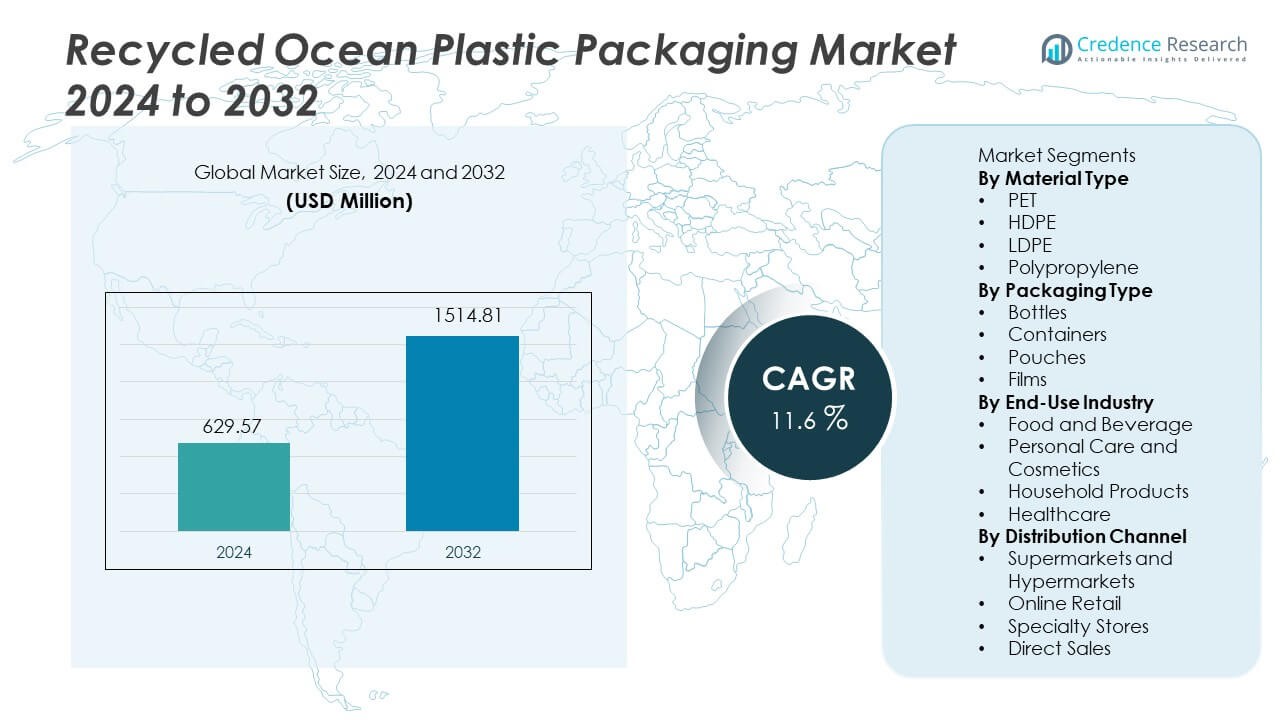
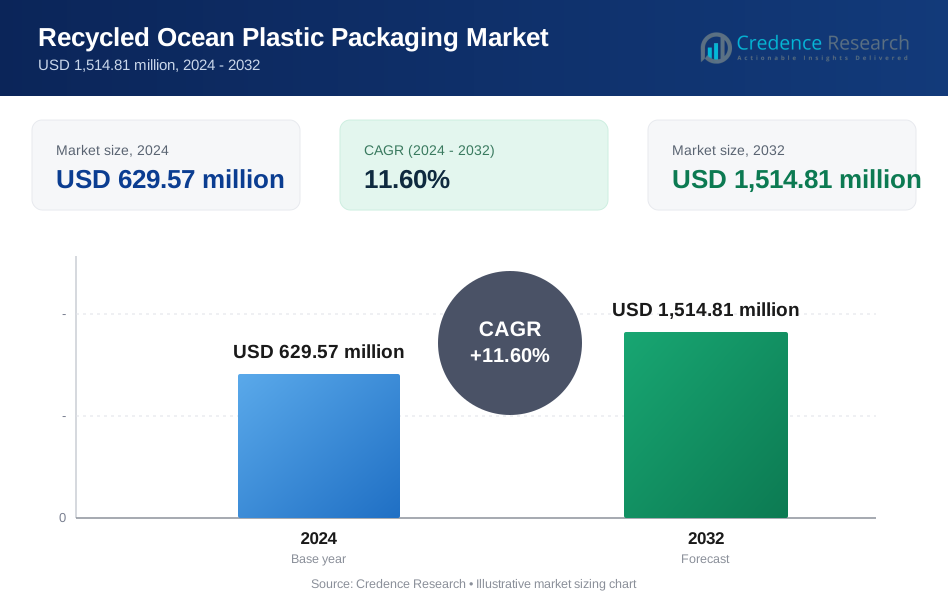
The Recycled Ocean Plastic Packaging Market was valued at USD 629.57 million in 2024. The market is projected to reach USD 1,514.81 million by 2032, recording a CAGR of 11.6% during the forecast period.
| REPORT ATTRIBUTE | DETAILS |
|---|---|
| Historical Period | 2020-2023 |
| Base Year | 2024 |
| Forecast Period | 2025-2032 |
| Recycled Ocean Plastic Packaging Market Size 2024 | USD 629.57 Million |
| Recycled Ocean Plastic Packaging Market, CAGR | 11.6% |
| Recycled Ocean Plastic Packaging Market Size 2032 | USD 1,514.81 Million |
Top players in the Recycled Ocean Plastic Packaging market include Avient Corporation, Oceanworks, TerraCycle, Envision Plastics, SABIC, Dow Inc., DSM Engineering Materials, ALPLA Group, Borealis AG, and Plastipak Packaging. These companies focus on certified ocean-bound material sourcing, advanced pellet processing, and partnerships with global brands that target circular packaging goals. North America leads the market with a 32% share, supported by strong sustainability commitments and advanced coastal recovery programs, followed by Europe at 29%, driven by strict packaging rules and recycled-content targets. Asia Pacific holds 26% due to growing recycling capacity and coastal waste volumes, while other regions expand at a gradual pace with rising awareness and new cleanup initiatives.
Market Insights
- The market reached USD 629.57 million in 2024 and is projected to hit USD 1,514.81 million by 2032 at 11.6% CAGR, driven by rising demand for sustainable packaging across global consumer sectors.
- Market growth benefits from strong corporate sustainability targets and supportive government action encouraging recycled content in packaging; PET leads the material type segment with 55% share, followed by HDPE at 22%, supported by strong use in bottles and personal care goods.
- Key trends include wider adoption of recycled ocean bottles in beverages and personal care, advanced sorting systems improving pellet quality, and expanding digital tracking of ocean material supporting brand transparency and premium positioning in retail channels.
- Competition features large chemical companies and specialist recyclers investing in coastal recovery, traceable sourcing, and food-grade pellet development; supply agreements with major brands strengthen long-term volume growth across FMCG categories.
- North America holds 32% share, followed by Europe at 29% and Asia Pacific at 26%, reflecting advanced recycling policies, strong coastal collection capacity, and rising buyer awareness in personal care and beverage categories.
 Market Segmentation Analysis:
By Material Type
PET holds the leading share near 55% in this segment due to wide use in food, beverage, and personal care packaging. PET supports strong clarity and good barrier behavior, which helps brand appeal. HDPE follows with near 22% share because brands use the material for containers that need strength. LDPE and polypropylene share the rest with near 13% and 10%, helped by flexible film demand. Growth comes from rising brand goals for ocean waste reduction. Global recycling programs also improve recycled PET supply for packaging producers and speed adoption in mass-market applications.
- For instance, Avient Corporation expanded its Ocean-Bound PET portfolio using certified recycled feedstock and reported processing capacity across its regional lines. The company collaborates with social enterprises and global marketplaces, such as Plastic Bank and Oceanworks, to ensure traceability and sourcing of at-risk plastic waste from collection zones within coastal areas.
By Packaging Type
Bottles lead this category with near 48% share due to heavy use in personal care and beverage brands. Containers hold near 26% share supported by growing home care demand. Pouches gain near 16% share driven by lightweight formats that lower transport loads. Films capture near 10% mainly from flexible food packs. Brands adopt recycled ocean bottles faster because designs fit current filling lines. Refill programs and collection partnerships also support bottle growth. Demand grows as global buyers shift to greener choices and major brands commit to recycled ocean content in branded products.
- For instance, ALPLA Group announced bottle production using material at risk of ending up in the ocean, also known as ocean-bound plastic, and operates recycling plants across Latin America and Asia to process post-consumer recycled plastic for new packaging.
By End-Use Industry
Food and beverage represent the top share near 41% because global beverage and water brands adopt recycled ocean formats. Personal care and cosmetics hold near 29% share supported by strong brand claims linked with clean oceans. Household products follow with near 18% share from cleaners and surface care. Healthcare captures near 12% share with slow but steady gains in non-critical packaging. Strong brand commitments and rising plastic bans support wider adoption in leading consumer markets. Global sustainability rules also push mandatory recycled share in new packs, which lifts demand for recycled ocean content across major brands.
Key Growth Drivers
Rising Corporate Sustainability Commitments
Brands set recycling goals and promise cleaner oceans through packaging plans. Many global brands invest in recycled designs that replace single-use plastics. Retail groups promote packages made from rescued ocean waste to improve brand trust. Regulations encourage recycled usage and push greener pack choices. Governments support cleanup plans and fund recycling projects in coastal areas. These actions raise demand for recycled ocean plastic packs across consumer markets. Growth remains strong as large companies report progress toward circular material targets.
- For instance, Nestlé aims to have more than 95 percent of its plastic packaging designed for recycling by 2025 and to reduce its use of virgin plastic by one-third during that same timeframe.
Growing Awareness of Plastic Pollution
Public concern over marine waste pushes brands to adopt recycled ocean packs. Media reports show ocean damage and help shape buyer behavior in key markets. Families choose products that support responsible waste removal and safe oceans. Refill and return systems also support lower waste per purchase. NGOs and cleanup groups promote certified ocean material collection efforts. This awareness helps drive demand in personal care and food packs. Consumer pressure encourages long-term change in packaging planning across regions.
- For instance, Adidas and Parley for the Oceans converted plastic collected from coastal zones into performance footwear and reported more than 15 million pairs produced with recovered plastic inputs. The program removes ocean-bound waste from island and coastal communities and recycles material into yarn for consumer goods.
Supportive Regulations and Recycling Investments
Recycling rules promote use of rescued ocean waste in new packs. Many regions set recycled content rules for fast-moving consumer goods. Recycling systems expand in coastal cities and help increase material supply. Cleanup programs encourage fishermen and coastal groups to gather ocean waste. New processing sites raise supply of recycled ocean pellets for packaging. These changes help secure raw materials for future production. Strong rules also guide industry action and speed adoption of recycled ocean packs.
Key Trends and Opportunities
Adoption of Branded Ocean Rescue Programs
Brands start rescue programs that collect ocean trash and fund cleanup groups. Buyers respond well to traceable ocean material that shows clear social value. Digital tracking of collection points improves trust in supply chains. Many brands promote ocean stories on retail packs to build awareness. This trend supports growth in personal care and beverage lines. Ocean origin claims enable stronger market reach and buyer loyalty. These programs help brands stand out in crowded retail aisles.
- For instance, Plastic Bank established more than 500 active collection sites and documented recovery of near 60 million kilograms of ocean-bound plastic, using digital traceability to record each transaction. These datasets help brands validate actual marine waste removal in finished consumer packs.
Advancement in Sorting and Processing Technology
Sorting tech improves identification of ocean plastics with better sensors and scanners. New washing and treatment systems raise pellet quality for food contact needs. These steps help reduce odor and support better color performance. Improved material strength expands use in bottles and containers. Technology lowers cost and makes recycled content easier to scale. Investment in processing plants boosts global supply of ocean material. This trend creates new opportunities for high-grade packs across industries.
- For instance, TOMRA Recycling installed more than 10,000 sensor-based sorting units worldwide and uses near-infrared scanners capable of detecting polymer signatures at resolutions near 3 millimeters, enabling precise separation of PET, HDPE, and mixed polyolefins.
Key Challenges
High Cost of Ocean Material Collection
Collecting waste from oceans needs boats, labor, and safe handling systems. These steps increase feedstock prices versus land waste. Many coastal areas lack strong logistics that support steady supply. High cost challenges wide adoption in cost-sensitive markets. Brands must balance price pressure with sustainability goals. Some companies pay premiums to support cleanup and meet targets. High collection cost remains a leading barrier in mass volumes.
Limited Material Availability and Quality Variation
Ocean waste shows mixed grades and heavy contamination in many sites. Sorting and cleaning create delays in supply chains and higher costs. Quality variation limits use in strict food packaging rules. Limited supply also restricts large-scale use in global brands. Companies need steady feedstock for long term planning. Slow supply growth delays transition to recycled ocean content. These issues keep pressure on producers to improve quality and volume.
Regional Analysis
North America
North America holds near 32% share driven by strong recycling rules and brand commitments. The United States leads due to large beverage and personal care companies adopting recycled ocean material in bottles and pouches. Canada supports circular packaging standards that strengthen demand in retail goods. Regional buyers favor eco labels which helps brand growth. Supply chains benefit from coastal recovery programs operating along major coastlines. Government grants support waste removal actions, raising long term feedstock supply. The market expands as brands link ocean recovery with premium positioning across consumer categories.
Europe
Europe captures near 29% share supported by strict packaging laws and ambitious sustainability targets. The region leads recycled usage in beverages and personal care due to mature recycling networks. Germany and the United Kingdom adopt recycled ocean bottles in supermarket lines. The European Union promotes recycled content rules that accelerate brand sourcing. Buyers value eco claims, pushing adoption in multiple retail channels. Coastal cleanup partners supply feedstock that helps secure long term usage. Growing circular packaging strategies sustain market growth across high-value sectors.
Asia Pacific
Asia Pacific holds near 26% share supported by coastal waste volumes and rising sustainability focus. China and Japan invest in advanced recycling plants that improve pellet quality. South Korea supports ocean cleanup groups that build recycled supply for packaging producers. India sees growing interest in recycled ocean packs in personal care lines. Large coastal populations create challenges and opportunities for waste recovery programs. Regional buyers respond to eco labels, especially in premium goods. The market grows as local brands follow global sustainability standards.
Latin America
Latin America holds near 7% share driven by growing public awareness of marine waste. Brazil leads adoption in personal care and beverage lines due to strong coastal exposure. Mexico invests in coastal recovery groups that improve feedstock access for packaging producers. Limited recycling infrastructure slows growth, yet brand action continues to improve collection. Retail buyers begin favoring recycled ocean claims linked with environmental responsibility. Regional supply chains need investment to reach large-scale volumes. Growth improves as local regulations shape recycled content plans.
Middle East and Africa
Middle East and Africa account for near 6% share influenced by coastal waste concerns and early-stage recycling programs. South Africa drives regional adoption of recycled ocean containers in consumer goods. Gulf countries invest in pilot recovery projects that support circular packaging goals. Still, limited processing facilities slow scale and quality improvement. Retail buyers show growing interest in eco messaging linked with ocean health. International brands introduce recycled ocean packs in premium segments first. Long term growth depends on stronger collection programs and local recycling capacity.
Market Segmentations:
By Material Type
- PET
- HDPE
- LDPE
- Polypropylene
By Packaging Type
- Bottles
- Containers
- Pouches
- Films
By End-Use Industry
- Food and Beverage
- Personal Care and Cosmetics
- Household Products
- Healthcare
By Distribution Channel
- Supermarkets and Hypermarkets
- Online Retail
- Specialty Stores
- Direct Sales
By Geography
- North America
- U.S.
- Canada
- Mexico
- Europe
- Germany
- France
- U.K.
- Italy
- Spain
- Rest of Europe
- Asia Pacific
- China
- Japan
- India
- South Korea
- South-east Asia
- Rest of Asia Pacific
- Latin America
- Brazil
- Argentina
- Rest of Latin America
- Middle East & Africa
- GCC Countries
- South Africa
- Rest of the Middle East and Africa
Competitive Landscape
Competitive landscape includes Avient Corporation, Oceanworks, TerraCycle, Envision Plastics, SABIC, Dow Inc., DSM Engineering Materials, ALPLA Group, Borealis AG, and Plastipak Packaging. Leading companies invest in recycling technologies, coastal material sourcing, and certification programs that build brand trust across consumer markets. Many producers form partnerships with coastal communities and cleanup groups to secure reliable feedstock from ocean recovery programs. Technology upgrades focus on better washing, decontamination, and pellet enhancement that enable food contact applications. Key players expand global supply networks to meet rising demand from personal care, beverage, and household product brands. Many companies collaborate with major retailers to develop private label portfolios based on recycled ocean content. Strategic investments in material traceability and lifecycle data also support brand claims in regulated markets. Integration of recycled ocean content into high-volume packaging formats remains a long-term priority for most major brands and suppliers.
Key Player Analysis
- Avient Corporation
- Oceanworks
- TerraCycle
- Envision Plastics
- SABIC
- Dow Inc.
- DSM Engineering Materials
- ALPLA Group
- Borealis AG
- Plastipak Packaging
Recent Developments
- In June 2024, Berry Global Group, Inc. and Brookfield Drinks partnered to introduce a new line of spring water, NEO WTR, in a first-to-market bottle composed entirely of Prevented Ocean Plastic (POP).
- In 2024, Dow expanded its existing line of REVOLOOP™ recycled-plastic resins—a post-consumer recycled (PCR) line meant to support circular packaging solutions and lower the carbon footprint of various products.
- In July 2023, ALPLA Group launched its ALPLArecycling brand to produce sustainable packaging from used plastics, strengthening regional recycling loops and lowering carbon use.
Report Coverage
The research report offers an in-depth analysis based on Material Type, Packaging Type, End-Use Industry, Distribution Channel and Geography. It details leading market players, providing an overview of their business, product offerings, investments, revenue streams, and key applications. Additionally, the report includes insights into the competitive environment, SWOT analysis, current market trends, as well as the primary drivers and constraints. Furthermore, it discusses various factors that have driven market expansion in recent years. The report also explores market dynamics, regulatory scenarios, and technological advancements that are shaping the industry. It assesses the impact of external factors and global economic changes on market growth. Lastly, it provides strategic recommendations for new entrants and established companies to navigate the complexities of the market.
Future Outlook
- Demand will grow as brands adopt higher recycled content goals across packaging lines.
- More coastal recovery programs will secure long-term feedstock for global producers.
- Technological progress will improve material strength for wider packaging use.
- Food contact approval will expand with better cleaning and decontamination methods.
- Retailers will support private label lines using certified ocean waste materials.
- Digital tracking will strengthen trust by showing traceable ocean material origins.
- Partnerships with NGOs will expand collection networks in coastal regions.
- Refill and reuse systems will support lower virgin plastic use across product categories.
- Government rules will encourage mandatory recycled content in several consumer markets.
- Global brands will scale recycled ocean formats across personal care and beverage segments.
Request a Free Sample
Fill in your details and we'll send you a free sample report.
- Sample data tables & charts
- Research methodology
Need a Custom Version of This Report?
Tailor the scope, geography, or segments to your exact requirements.
- Custom geography or segment scope
- Direct access to our analyst team
Frequently Asked Questions
What is the current market size for the Recycled Ocean Plastic Packaging Market, and what is its projected size in 2032?
At what Compound Annual Growth Rate is the Recycled Ocean Plastic Packaging Market projected to grow between 2024 and 2032?
Which Recycled Ocean Plastic Packaging Market segment held the largest share in 2024?
What are the primary factors fueling the growth of the Recycled Ocean Plastic Packaging Market?
Who are the leading companies in the Recycled Ocean Plastic Packaging Market?
Which region commanded the largest share of the Recycled Ocean Plastic Packaging Market in 2024?
Table of Content
Chapter 1. Report Introduction
- 1.1 Report Description & Purpose
- 1.1.1 Report Title & Market Definition
- 1.1.2 Unique Selling Propositions (USP) & Key Differentiators
- 1.1.3 Value Proposition for Stakeholders
- 1.2 Research Objectives
- 1.2.1 Market Sizing Objectives (Volume & Revenue)
- 1.2.2 Segmentation Objectives
- 1.2.3 Competitive Intelligence Objectives
- 1.2.4 Forecast & Scenario Objectives
- 1.3 Report Scope
- 1.3.1 Recycled Ocean Plastic Packaging Scope – Types & Subtypes Covered
- 1.3.2 Geographic Scope – Regions & Countries Covered
- 1.3.3 Historical Period, Base Year & Forecast Period (2024; forecast to 2032)
- 1.3.4 Inclusions & Exclusions
- 1.4 HS Code & Classification Framework
- 1.5 Currency, Units & Pricing Basis
- 1.6 Target Stakeholders
- 1.7 Limitations & Assumptions
Chapter 2. Executive Summary
- 2.1 Global Recycled Ocean Plastic Packaging Market Snapshot
- 2.1.1 Market Size – Historical (2024) & Forecast (2024-2032) (2024: USD 629.57 million → 2032: USD 1,514.81 million)
- 2.1.2 Volume & Revenue – Global Totals
- 2.1.3 Key Market Highlights – Top Five Facts
- 2.2 Recycled Ocean Plastic Packaging Market Segmentation Snapshot
- 2.2.1 Market Split by Region – 2024 vs. 2032
- 2.3 Competitive Snapshot
- 2.3.1 Top 10 Players by Revenue Share – 2024
- 2.3.2 Top 10 Players by Volume Share – 2024
- 2.3.3 Recent Strategic Developments (18-Month Summary)
- 2.4 Key Investment Highlights & Strategic Conclusions
Chapter 3. Recycled Ocean Plastic Packaging Market Dynamics & Industry Analysis
- 3.1 Market Overview & Context
- 3.1.1 Recycled Ocean Plastic Packaging Market Position in the Broader Automotive Value Chain
- 3.1.2 OEM vs. Replacement Market Dynamics
- 3.1.3 Market Maturity & Development Stage by Region
- 3.2 Recycled Ocean Plastic Packaging Market Drivers
- 3.3 Recycled Ocean Plastic Packaging Market Restraints & Challenges
- 3.4 Recycled Ocean Plastic Packaging Market Opportunities
- 3.5 Porter's Five Forces Analysis
- 3.5.1 Threat of New Entrants
- 3.5.2 Bargaining Power of Suppliers
- 3.5.3 Bargaining Power of Buyers
- 3.5.4 Threat of Substitutes
- 3.5.5 Competitive Rivalry – Intensity Assessment
- 3.6 Recycled Ocean Plastic Packaging Value Chain Analysis
- 3.6.1 Upstream – Raw Material/Input Suppliers
- 3.6.1.1 Raw Material/Input 1
- 3.6.1.2 Raw Material/Input 2
- 3.6.1.3 Raw Material/Input 3
- 3.6.2 Midstream – Production/Manufacturing/Service Delivery
- 3.6.2.1 Production/Process Overview
- 3.6.2.2 Key Facility Locations & Capacity by Manufacturer
- 3.6.3 Downstream – Distribution & End Consumer
- 3.6.3.1 Primary Channel – B2B/OEM
- 3.6.3.2 Secondary Channels – Dealer, Retail, Online, Direct
- 3.6.4 Value Chain Profitability Analysis
- 3.6.1 Upstream – Raw Material/Input Suppliers
- 3.7 PESTEL Analysis
- 3.7.1 Political Factors
- 3.7.2 Economic Factors
- 3.7.3 Social Factors
- 3.7.4 Technological Factors
- 3.7.5 Environmental Factors
- 3.7.6 Legal Factors
- 3.8 Recycled Ocean Plastic Packaging Supply Chain Analysis
- 3.8.1 Raw Material/Input Supply Risk Assessment
- 3.8.2 Manufacturing Concentration Risk (Geographic Exposure)
- 3.8.3 Trade Disruption Impact Analysis
- 3.9 Regulatory & Policy Landscape
Note: The regulatory and policy landscape section covers regulations based on their applicability to the market, Recycled Ocean Plastic Packaging category, geography, and scope of the study. Only regulatory frameworks with a material impact on operations, compliance, trade, sustainability, or market access are analyzed in detail.
Chapter 4. Key Investment Pockets & Opportunity Analysis
- 4.1 Recycled Ocean Plastic Packaging Market Attractiveness Analysis
- 4.1.1 By Region – Investment Attractiveness Matrix (Volume × CAGR)
- 4.2 Absolute Revenue Growth Opportunity
- 4.2.1 By Region – Absolute USD Growth Through 2032
- 4.3 Incremental Volume Opportunity
- 4.3.1 By Region – Incremental Volume Through 2032
- 4.3.2 Segment – Incremental Volume
- 4.4 Emerging Submarket Opportunity Deep Dive (Subject to Applicability)
- 4.5 Emerging Market Opportunity Scorecards
- 4.5.1 United States
- 4.5.2 Europe
- 4.5.3 Asia
- 4.5.4 Middle East & Africa
Note: Emerging Market Opportunity Scorecards will be included based on relevance and strategic importance. Regions listed are indicative and may vary depending on data availability and market dynamics.
Chapter 5. Recycled Ocean Plastic Packaging Import-Export Analysis & Trade Flows
- 5.1 Global Trade Overview
- 5.1.1 Global Export Value by Country (2024)
- 5.1.2 Global Export Volume by Country (2024)
- 5.1.3 Global Import Value by Country (2024)
- 5.1.4 Global Import Volume by Country (2024)
- 5.1.5 Net Trade Balance by Country (2024)
- 5.2 Export Analysis – Segment
- 5.2.1 Type 1 (HS Code)
- 5.2.2 Type 2 (HS Code)
- 5.2.3 Type 3 (HS Code)
- 5.2.4 Type 4 (HS Code)
- 5.2.5 Type 5 (HS Code)
- 5.3 Import Analysis – Segment
- 5.3.1 Type 1 (HS Code)
- 5.3.2 Type 2 (HS Code)
- 5.3.3 Type 3 (HS Code)
- 5.3.4 Type 4 (HS Code)
- 5.3.5 Type 5 (HS Code)
- 5.4 Average Unit Trade Prices
- 5.4.1 Average Export Price – Segment & Country
- 5.4.2 Average Import Price – Segment & Source Country
- 5.4.3 Price Trends (2024)
- 5.5 Key Trade Route Analysis
- 5.5.1 Trade Route 1
- 5.5.2 Trade Route 2
- 5.5.3 Trade Route 3
- 5.5.4 Trade Route 4
- 5.5.5 Trade Route 5
- 5.6 Trade Policy Impact Assessment
- 5.6.1 US Anti-Dumping & Section 301 Tariffs
- 5.6.2 EU Customs Union Impact
- 5.6.3 Major Free Trade Agreements
- 5.6.4 USMCA Rules of Origin
Note: Trade policy analysis will be included only where relevant to the Recycled Ocean Plastic Packaging market.
Chapter 6. Competitive Landscape & Company Benchmarking
- 6.1 Recycled Ocean Plastic Packaging Market Concentration & Structure
- 6.1.1 Herfindahl-Hirschman Index (HHI) – vs. 2024
- 6.1.2 Tier 1, Tier 2 & Tier 3 Market Structure
- 6.1.3 Global, Regional & Local Player Dynamics
- 6.2 Recycled Ocean Plastic Packaging Market Share Analysis – 2024
- 6.2.1 Global Revenue Share by Company
- 6.2.2 Global Volume Share by Company
- 6.2.3 Regional Revenue Share
- 6.2.4 Market Share Evolution ( vs. 2024)
- 6.2.5 OEM Segment Share by Company
- 6.2.6 Replacement Segment Share by Company
- 6.3 Production/Delivery Capacity & Facility Analysis
- 6.3.1 Global Installed Capacity
- 6.3.2 Capacity Utilization Rates
- 6.3.3 Production/Output Volume
- 6.3.4 Facility Locations & Capacity Map
- 6.3.5 Planned Capacity Additions
- 6.4 Recycled Ocean Plastic Packaging Competitive Benchmarking Matrix
- 6.4.1 Revenue, Volume, CAGR & Profitability Comparison
- 6.4.2 Channel Revenue Mix
- 6.4.3 Geographic Revenue Exposure
- 6.4.4 R&D Intensity
- 6.4.5 Sustainability Maturity
- 6.5 Strategic Developments in Recycled Ocean Plastic Packaging (Last 24 Months)
- 6.5.1 Mergers, Acquisitions & Divestments
- 6.5.2 New Recycled Ocean Plastic Packaging Launches
- 6.5.3 Facility Expansions
- 6.5.4 Strategic Alliances, Joint Ventures & Partnerships
- 6.5.5 Distribution Expansion & Market Entry
- 6.5.6 Sustainability & ESG Initiatives
- 6.6 Competitive Strategy Mapping
- 6.6.1 Leader, Challenger, Follower & Niche Classification
- 6.6.2 Pricing Strategy Comparison
- 6.6.3 Channel Strategy Matrix
Note: Strategic developments are included based on their materiality and the availability of reliable information.
Chapter 7. Global Recycled Ocean Plastic Packaging Market – By Distribution Channel
- 7.1 Segment Overview
- 7.1.1 Volume & Revenue Split by Channel (2024 & 2032)
- 7.1.2 Channel Mix Evolution (2024-2032)
Chapter 8. Regional Market Analysis – Global Overview
- 8.1 Global Regional Overview
- 8.1.1 Regional Volume Share
- 8.1.2 Regional Revenue Share
- 8.1.3 Regional Volume by Region
- 8.1.4 Regional Revenue by Region
- 8.1.5 Regional Forecast Through 2032
- 8.2 Cross-Regional Segment Analysis
- 8.2.1 By Distribution Channel
- 8.2.2 By Brand/Price Tier
Chapter 9. North America Recycled Ocean Plastic Packaging Market
- 9.1 United States
- 9.2 Canada
- 9.3 Mexico
Chapter 10. Europe Recycled Ocean Plastic Packaging Market
- 10.1 Germany
- 10.2 France
- 10.3 Italy
- 10.4 United Kingdom
- 10.5 Spain
- 10.6 Poland
- 10.7 Russia
- 10.8 Netherlands
- 10.9 Belgium
- 10.10 Sweden
- 10.11 Denmark
- 10.12 Norway
- 10.13 Rest of Europe
Chapter 11. Asia Pacific Recycled Ocean Plastic Packaging Market
- 11.1 China
- 11.2 India
- 11.3 Japan
- 11.4 South Korea
- 11.5 Thailand
- 11.6 Indonesia
- 11.7 Vietnam
- 11.8 Malaysia
- 11.9 Australia
- 11.10 Rest of Asia Pacific
Chapter 12. Latin America Recycled Ocean Plastic Packaging Market
- 12.1 Brazil
- 12.2 Argentina
- 12.3 Colombia
- 12.4 Chile
- 12.5 Rest of Latin America
Chapter 13. Middle East Recycled Ocean Plastic Packaging Market
- 13.1 Saudi Arabia
- 13.2 United Arab Emirates
- 13.3 Turkey
- 13.4 Israel
- 13.5 Iran
- 13.6 Rest of the Middle East
Chapter 14. Africa Recycled Ocean Plastic Packaging Market
- 14.1 South Africa
- 14.2 Egypt
- 14.3 Nigeria
- 14.4 Morocco
- 14.5 Rest of Africa
Chapter 15. Recycled Ocean Plastic Packaging Company Profiles
- 15.1 [Company 01]
- 15.1.1 Company Overview
- 15.1.2 Key Management Personnel
- 15.1.3 Products & Services Portfolio
- 15.1.4 Financial Performance
- 15.1.5 Key Market Focus & Geographic Presence
- 15.1.6 Recent Developments & Strategic Initiatives
Note: The company profile list is preliminary and may change based on research findings, market developments, data availability, and client requirements.
Chapter 16. Appendices
- Appendix A – List of Abbreviations & Acronyms
- Appendix B – Industry Classification Code Reference – Full Series
- Appendix C – Production & Capacity Data Tables
- Appendix D – End-Use & Demand Base Tables
- Appendix E – Consumption & Replacement Rate Assumptions
- Appendix F – ASP Reference Tables
- Appendix G – Manufacturing & Facility Database
- Appendix H – Import-Export Data Tables
- Appendix I – Regulatory Summary Tables
- Appendix J – Primary Research Participant List (Anonymized)
- Appendix K – Primary Research Questionnaire Framework
- Appendix L – Data Sources & Bibliography
- Appendix M – Market Size Divergence & Source Comparison
Chapter 17. Research Methodology
- 17.1 Research Framework & Philosophy
- 17.2 Secondary Research – Sources, Hierarchy & Data Extraction
- 17.3 Data Modeling – Bottom-Up & Top-Down Market Sizing
- 17.4 Primary Research – Stakeholder Framework, LOI & Sample Sizes
- 17.5 Forecast Methodology – Regression, Scenario & Sensitivity Analysis
- 17.6 Quality Control – Four-Layer Validation Framework
- 17.7 Limitations & Standard Assumptions
- 17.8 Disclaimer
