
Market Overview
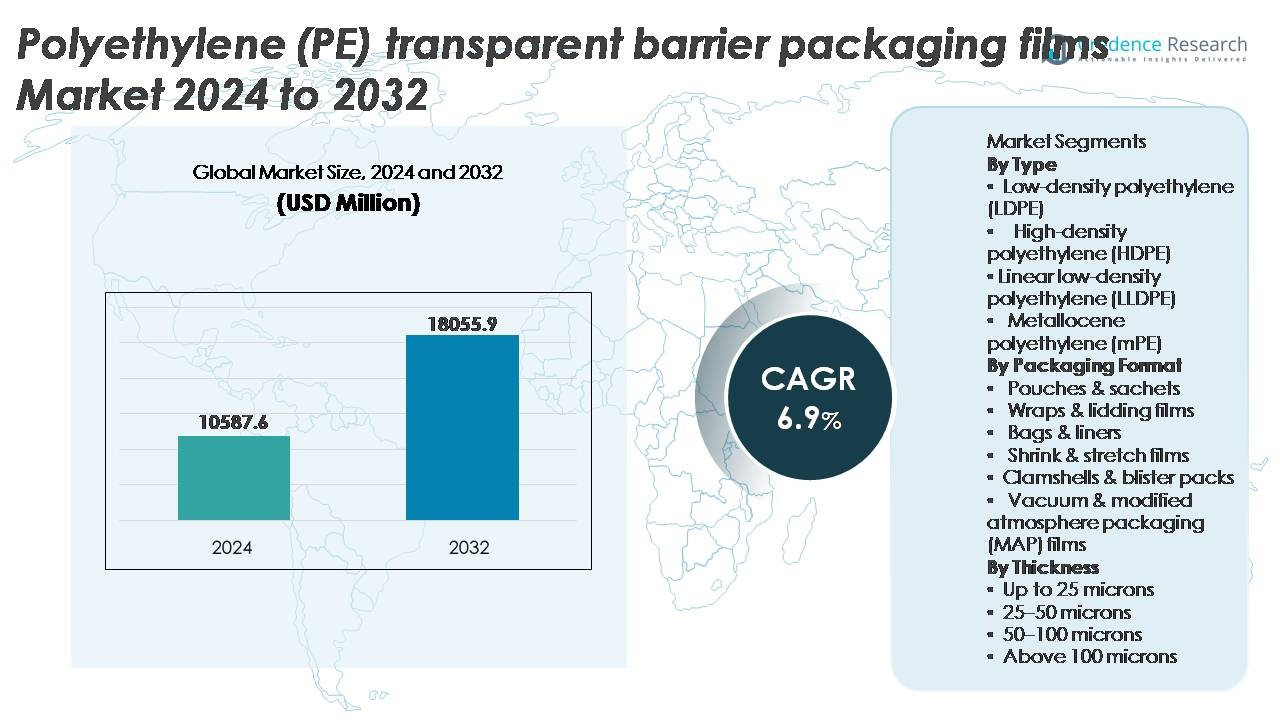
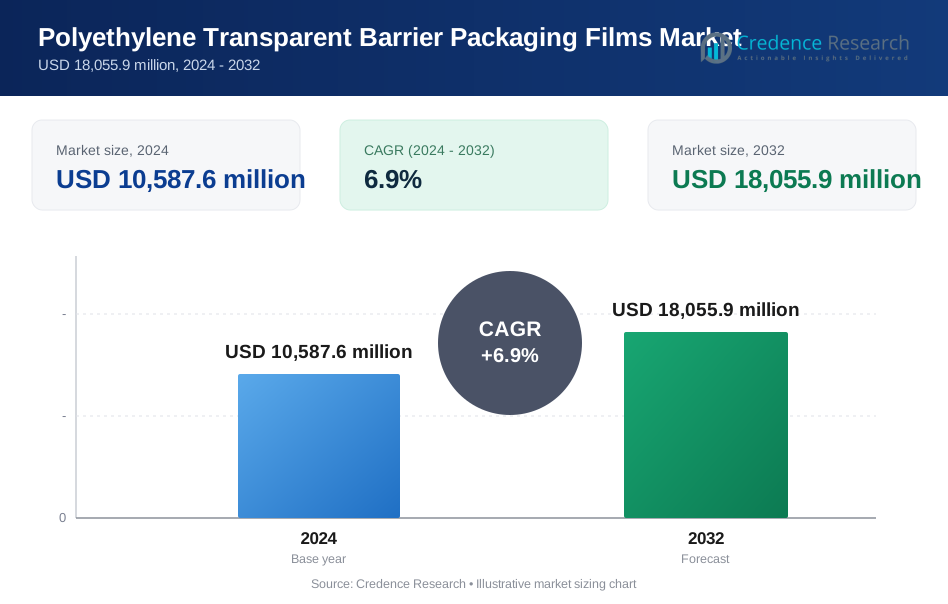
The global Polyethylene (PE) transparent barrier packaging films market was valued at USD 10,587.6 million in 2024 and is projected to reach USD 18,055.9 million by 2032, reflecting a robust CAGR of 6.9% during the forecast period (2025-2032).
| REPORT ATTRIBUTE | DETAILS |
|---|---|
| Historical Period | 2020-2023 |
| Base Year | 2024 |
| Forecast Period | 2025-2032 |
| Polyethylene (PE) Transparent Barrier Packaging Films Market Size 2024 | USD 10,587.6 Million |
| Polyethylene (PE) Transparent Barrier Packaging Films Market, CAGR | 6.9% |
| Polyethylene (PE) Transparent Barrier Packaging Films Market Size 2032 | USD 18,055.9 Million |
The Polyethylene (PE) transparent barrier packaging films market is shaped by leading global participants including 3M, Zhejiang Changyu New Materials Co., Ltd., Mondi, Glenroy Inc., Sealed Air, TOPPAN Inc., Amcor Plc, Momar Industries, and Klöckner Pentaplast, each focusing on recyclable mono-material solutions, downgauged film formats, and advanced barrier enhancements to support sustainability goals and performance expectations in food, pharmaceutical, and personal care applications. Asia-Pacific leads the market with approximately 36% share, driven by expanding production capacity, rising packaged food consumption, and rapid retail and e-commerce growth, followed by North America and Europe, where regulatory commitments to circular packaging and high adoption of MAP-compatible films continue to influence technological development and competitive differentiation.
Market Insights
- The global Polyethylene (PE) transparent barrier packaging films market was valued at USD 10,587.6 million in 2024 and is projected to reach USD 18,055.9 million by 2032, expanding at a CAGR of 6.9% during the forecast period.
- Market growth is driven by rising demand for extended shelf-life packaging, lightweight flexible formats, and the transition from rigid plastics to PE-based barrier solutions across food, beverage, pharmaceutical, and e-commerce supply chains.
- Key trends include strong adoption of recyclable mono-PE structures, advancements in high-barrier coatings, and the growing integration of MAP-compatible films improving freshness, clarity, and performance consistency.
- Competition intensifies as major players invest in downgauged films, bio-based PE, and advanced additive technologies while navigating regulatory pressures and performance limitations versus multi-layer composite structures.
- Asia-Pacific leads with approximately 36% share, followed by North America at nearly 28%, while pouches and sachets represent the dominant packaging segment, supported by convenience-driven consumer preferences and high-speed filling line compatibility across FMCG applications.
Market Segmentation Analysis:
By Type
Low-density polyethylene (LDPE) represents the dominant sub-segment, accounting for the largest share due to its excellent sealability, clarity, and flexibility suitable for food, personal care, and household packaging formats. Its ability to deliver strong moisture barrier performance and low-temperature resistance supports widespread adoption across chilled and frozen goods applications. Meanwhile, LLDPE enhances puncture resistance and downgauging opportunities, while HDPE addresses applications requiring greater rigidity and chemical resistance. Metallocene polyethylene (mPE) continues gaining traction as brand owners emphasize improved film optics, mechanical performance, and sustainable lightweight structures engineered for recyclability.
- For instance, ExxonMobil’s LDPE grades used in barrier packaging demonstrate tensile strength values reaching up to 23 MPa, supporting tear resistance and sealing integrity in frozen-food films.
By Packaging Format
Pouches and sachets hold the dominant share of the market as manufacturers favor flexible, lightweight pack formats that support high-speed filling lines and extended shelf-life for snacks, powders, condiments, and nutraceuticals. Their cost efficiency, superior printability, and reduced material usage enable brands to meet convenience-driven consumer preferences and sustainability initiatives. Wraps and lidding films remain critical in fresh food sealing, while bags and liners serve bulk industrial logistics. Shrink and stretch films support retail-ready and pallet unitisation, and MAP films expand steadily, driven by fresh produce, meat, and bakery shelf-life extension requirements.
- For instance, Amcor’s AmLite Ultra Recyclable high-barrier pouch delivers oxygen transmission rates below 1 cc/m²/day, enabling protection for oxygen-sensitive dry foods and supplements.
By Thickness
Films in the 25–50-micron thickness range lead the market, driven by their optimal balance of strength, barrier performance, and cost efficiency in mid-weight food, beverage, and household packaging applications. This range supports flexible pouch converting, laminate structures, and lidding film formats while enabling downgauging without compromising integrity. Films below 25 microns are preferred for secondary wraps and over-packaging, while the 50-100-micron category caters to heavy-duty applications requiring puncture resistance. Above 100 microns remains limited to industrial or protective packaging used in chemical, construction, and transportation sectors.
Key Growth Drivers
Rising Demand for Extended Shelf-Life Packaging in Food and Beverage
The increasing need to preserve freshness, prevent contamination, and reduce product wastage is a primary catalyst driving adoption of PE transparent barrier films across the global food and beverage industry. These films deliver moisture resistance, aroma retention, and oxygen barrier properties that align with the requirements of snacks, bakery goods, fresh produce, dairy products, and prepared meals. Growth in convenience consumption, driven by dual-income households, e-commerce grocery expansion, and portion-controlled packaging formats, continues to accelerate market uptake. Additionally, the shift from rigid containers to lightweight flexible structures enables transportation efficiency and reduces storage volume, offering cost benefits for manufacturers and retailers. PE transparent barrier films further support labeling space for regulatory information and brand visibility, a crucial factor in competitive retail shelves. These performance advantages position PE barrier films as a preferred packaging solution for brands targeting improved shelf stability, product differentiation, and packaging sustainability outcomes.
· "For instance, Innovia Films’ Propafilm™ Strata BOPP (biaxially oriented polypropylene)-based barrier film launched in 2019 (with an extension in 2021) demonstrates high barrier properties to oxygen and moisture, enabling shelf-life extension in packaged bakery and confectionery without aluminum layers, and is certified as 'recycle ready' where polypropylene recycling infrastructure exists.
Shift Toward Recyclable Mono-material Packaging Structures
The global emphasis on circular packaging systems and producer responsibility regulations is paving the way for PE mono-material constructions, replacing complex multi-layer formats based on PET, aluminum, and nylon combinations. Mono-PE transparent barrier films facilitate streamlined recycling and reduce contamination in collection processes, allowing converters to create redesigned packaging compatible with mechanical waste recovery infrastructure. This trend is reinforced by brand sustainability commitments, with manufacturers aiming for fully recyclable packaging portfolios within the decade. Advancements in polymer modification, surface coating, and functional additives enable PE films to meet barrier expectations previously exclusive to multi-material laminates. Moreover, regulatory bans and restrictions on composite plastics in multiple regions accelerate demand for simplified PE formats. As multinational FMCG players pursue low-carbon packaging models and improved lifecycle assessments, recyclable PE barrier films emerge as a strategic enabler, supporting compliance while maintaining performance in demanding applications.
- For instance, Borealis’ 2024 Borcycle™ M technology enables the production of mono-PE high-barrier film structures using mechanically recycled feedstock with melt flow rates ranging from 0.3 to 1.2 g/10 min and impact resistance stability loss limited to below 10% after five reprocessing cycles, supporting closed-loop PE-to-PE reuse in flexible packaging.
Growth of E-commerce and Automated Logistics Packaging
PE transparent barrier films benefit significantly from the rise in e-commerce fulfillment, which requires packaging solutions with high durability, resistance to tears and punctures, and dependable sealing integrity. Films engineered with improved clarity and print compatibility support brand presentation in direct-to-consumer channels, where packaging often serves as the first customer touchpoint. Automated logistics systems demand consistent thickness, coefficient of friction control, and machineability features that PE films provide with high reliability. Growth in meal-kit subscriptions, pharmaceutical shipments, and small-format personal care refills contributes further to demand acceleration. Additionally, shrink and stretch PE films used in transit packaging enable pallet stability and load security, reducing supply chain losses. The expansion of omnichannel retail and rising consumer expectations for product safety and tamper-evident packaging reinforce the value proposition of PE barrier films within modern distribution networks.
Key Trends & Opportunities
Advancements in High-Barrier Coatings and Functional Additives
A major trend reshaping the PE transparent barrier films market is the integration of cutting-edge coating technologies such as plasma-assisted deposition, acrylic coatings, and nanocomposite additives that enhance oxygen and moisture vapor transmission rates. These advancements create opportunities for PE films to penetrate applications once dominated by aluminum foil and PET-based laminates. The ability to deliver improved transparency while retaining barrier integrity expands applicability within premium packaged goods and display-oriented retail formats. Functional additives—such as antimicrobial agents, UV blockers, and anti-fog coatings—further differentiate PE film performance, supporting specialty uses in fresh produce, protein packaging, and nutraceuticals. This innovation landscape opens pathways for value-added film manufacturing and higher-margin product portfolios.
- For instance, Toppan Printing’s “GL BARRIER” transparent film platform incorporating aluminum oxide (AlOx) vapor-deposited ceramic coatings achieves oxygen transmission rates as low as 0.2 cc/m²/day and moisture transmission below 0.5 g/m²/day, enabling mono-material PE barrier structures to match performance traditionally seen in aluminum-laminated films.
Adoption of Sustainable Manufacturing and Bio-based PE Films
Growing investments in bio-PE derived from renewable feedstocks such as sugarcane ethanol create opportunities for reducing fossil dependency and reducing carbon footprints across packaging value chains. As organizations pursue decarbonization targets, bio-based PE barrier films position themselves as viable alternatives without requiring major redesign of converting equipment. The increasing availability of recycled PE content suitable for food-grade barrier film production represents another opportunity, driven by advancements in purification and decontamination processes. Voluntary commitments by global brands toward recycled content inclusion in packaging accelerate this trend. Together, bio-resin development, renewable material sourcing, and closed-loop recycling innovations contribute to sustainable growth trajectories in the PE barrier films category.
- For instance, Braskem’s “I’m green™” bio-based polyethylene manufactured using sugarcane ethanol captures up to 3.09 kg of CO₂ per kilogram of resin, as documented in third-party ISO 14040/44 life-cycle assessments, while maintaining melt flow rates ranging from 3 to 30 g/10 min, enabling direct use in existing extrusion and thermoforming equipment.
Key Challenges
Barrier Performance Limitations Compared to Multi-material Alternatives
Despite notable advancements, PE transparent barrier films still face performance limitations when directly compared with metallized, aluminum foil, or EVOH-based multi-layer structures for extremely sensitive moisture-sensitive or oxygen-sensitive products. These constraints require manufacturers to invest in technological enhancements, driving higher production cost burdens. Applications such as high-aroma beverages, powdered formulations, and shelf-stable processed meats still rely heavily on alternative composite materials. Overcoming these limitations requires continuous R&D and industrial-scale coating adoption, which can challenge small-to-mid-sized manufacturers. As brand performance specifications tighten, pressure persists to deliver improved barrier properties without adding complexity, weight, or recyclability constraints.
Stringent Regulatory Compliance and Material Standardization
Increasing legal frameworks surrounding packaging waste, environmental labeling, and recyclability standards impose financial and operational challenges for film producers and brand owners. Variations in recycling infrastructure across regions complicate product standardization and limit harmonized mono-material packaging deployment. Compliance with food-contact material certification, migration testing, and chemical safety regulations demands continuous documentation and laboratory validation. Additionally, extended producer responsibility fees and plastic taxes increase cost exposure for conventional PE formats. The combined impact of compliance complexity, certification investment, and evolving regulatory uncertainty presents headwinds, particularly for smaller participants aiming to scale competitively in international markets.
Regional Analysis
North America
North America holds approximately 28% of the global Polyethylene (PE) transparent barrier packaging films market, driven by strong consumption of packaged foods, frozen meals, pharmaceuticals, and e-commerce shipping formats. The United States dominates regional demand due to advanced converting capabilities and retail-ready flexible packaging adoption. Sustainability regulations encouraging recyclable mono-material films accelerate investment in PE-based alternatives to PET and metallized structures. Technological integration in MAP films and puncture-resistant formats aligns with retail logistics and fresh produce distribution. Brand focus on lightweight, tamper-evident packaging further strengthens market penetration across food service, healthcare, and household categories.
Europe
Europe accounts for around 24% of the market, supported by stringent packaging sustainability policies, circular plastics mandates, and rapid adoption of recyclable PE barrier laminates in FMCG, dairy, and meat segments. Germany, Italy, and France remain major contributors due to robust manufacturing bases and export-driven food industries. Demand is reinforced by extended producer responsibility frameworks encouraging mono-PE film replacement for composite packaging. The region also experiences strong traction for bio-based PE barrier films and downgauged flexible formats. Growth is further supported by demand for high-barrier lidding and protective films compatible with MAP technologies used in meats and bakery applications.
Asia-Pacific
Asia-Pacific leads the global market with approximately 36% share, driven by high-volume food processing expansion, growing retail distribution networks, and urban population growth. China and India represent major opportunities, with rapid flexible packaging adoption replacing rigid formats across snacks, confectionery, condiments, and personal care products. Regional manufacturing cost advantages support large-scale converting operations and export-oriented production. The rise of e-commerce logistics and home-delivered meal solutions accelerates demand for durable PE barrier films. Growing regulatory momentum toward recyclable formats and increasing investments in coating technologies reinforce Asia-Pacific's position as the fastest-growing regional market.
Latin America
Latin America represents roughly 7% of the market, with demand supported by rising consumption of packaged food, beverages, and pharmaceutical supplies. Brazil and Mexico drive adoption as modern retail expands and flexible packaging becomes more cost competitive than rigid alternatives. The region experiences increasing use of PE barrier films for moisture-sensitive snacks and fresh produce distribution. However, economic fluctuations and uneven recycling infrastructure remain limiting factors for recyclable mono-material deployment. Brand investment in localized packaging operations and supply chain optimization continues to stimulate market growth, particularly for pouches, laminates, and lightweight retail packaging formats.
Middle East & Africa
The Middle East & Africa region holds approximately 5% of global market share, characterized by growing demand for packaged staple foods, bottled beverages, and consumer household goods. The expansion of cold chain distribution, particularly in GCC nations, increases the need for barrier films that preserve freshness in high-temperature climates. Local manufacturing capacity is improving, though reliance on imported materials persists. Flexible packaging offers cost efficiency and convenience for price-sensitive consumers. Sustainability mandates are at an early stage, presenting future opportunities for recyclable mono-PE structures as infrastructure develops and food distribution consolidation advances.
Market Segmentations:
By Type
- Low-density polyethylene (LDPE)
- High-density polyethylene (HDPE)
- Linear low-density polyethylene (LLDPE)
- Metallocene polyethylene (mPE)
By Packaging Format
- Pouches & sachets
- Wraps & lidding films
- Bags & liners
- Shrink & stretch films
- Clamshells & blister packs
- Vacuum & modified atmosphere packaging (MAP) films
By Thickness
- Up to 25 microns
- 25–50 microns
- 50–100 microns
- Above 100 microns
By Geography
- North America
- U.S.
- Canada
- Mexico
- Europe
- Germany
- France
- U.K.
- Italy
- Spain
- Rest of Europe
- Asia Pacific
- China
- Japan
- India
- South Korea
- South-east Asia
- Rest of Asia Pacific
- Latin America
- Brazil
- Argentina
- Rest of Latin America
- Middle East & Africa
- GCC Countries
- South Africa
- Rest of the Middle East and Africa
Competitive Landscape
The Polyethylene (PE) transparent barrier packaging films market is characterized by a competitive landscape involving global polymer producers, vertically integrated flexible packaging converters, and specialized coating technology providers. Leading companies compete through advancements in high-barrier PE structures, recyclable mono-material laminates, and downgauged films that maintain functional strength while reducing material usage. Strategic priorities include investments in metallocene PE resins, nanocomposite additives, and plasma or acrylic coating technologies that improve oxygen and moisture barrier performance. Market participants are also expanding through capacity additions, mergers, and regional partnerships to strengthen supply resilience and proximity to FMCG, food processing, and pharmaceutical hubs. Sustainability commitments play a decisive role, with manufacturers introducing bio-based PE films and recycled-content solutions to align with circular packaging mandates. Customization capabilities including MAP-compatible films, anti-fog coatings, and high-clarity display packaging remain essential differentiators, supported by R&D initiatives focused on performance optimization and regulatory compliance across end-use segments.
Key Player Analysis
- 3M (U.S.)
- Zhejiang Changyu New Materials Co., Ltd. (China)
- Mondi (U.K.)
- Glenroy Inc. (U.S.)
- Sealed Air (U.S.)
- TOPPAN Inc. (Japan)
- Amcor Plc (Switzerland)
- Momar Industries (U.S.)
- Klöckner Pentaplast (U.K.)
Recent Developments
- In November 2025: TOPPAN’s subsidiary TOPPAN Speciality Films Private Limited (TSF) installed a new hybrid manufacturing line capable of producing both BOPP and BOPE films, enabling mono-material polyethylene (BOPE) output alongside traditional polypropylene films increasing film production capacity by about 40% to respond to rising global flexible-packaging demand.
- In July 2024, Mondi expanded its mono-material barrier film portfolio, rolling out PE-based recyclable barrier films designed for flexible packaging to support circular economy objectives.
- In December 2023, TOPPAN Packaging Czech s.r.o., a subsidiary of the TOPPAN Group, hosted a ceremonial groundbreaking to initiate the construction of a new facility in Most, located in the Ústí nad Labem Region of the Czech Republic. The facility will produce GL BARRIER, a leading transparent barrier film that is developed and produced by the TOPPAN Group, catering to the growing global demand for environmentally friendly packaging.
Report Coverage
The research report offers an in-depth analysis based on Type, Packaging format, Thickness and Geography. It details leading market players, providing an overview of their business, product offerings, investments, revenue streams, and key applications. Additionally, the report includes insights into the competitive environment, SWOT analysis, current market trends, as well as the primary drivers and constraints. Furthermore, it discusses various factors that have driven market expansion in recent years. The report also explores market dynamics, regulatory scenarios, and technological advancements that are shaping the industry. It assesses the impact of external factors and global economic changes on market growth. Lastly, it provides strategic recommendations for new entrants and established companies to navigate the complexities of the market.
Future Outlook
- Future adoption of mono-material PE barrier films will accelerate as global recycling mandates strengthen.
- Coating and additive innovation will significantly improve oxygen and moisture barrier properties.
- Bio-based PE and renewable resin sourcing will gain traction among sustainability-focused brands.
- Lightweight downgauged films will continue replacing rigid packaging formats across multiple sectors.
- E-commerce logistics will expand demand for puncture-resistant and tamper-evident PE film solutions.
- MAP-compatible transparent barrier films will see higher utilization in fresh food and protein packaging.
- Digital printing and smart identifiers will enhance traceability and packaging personalization.
- Regional converting capacity expansion will support localized supply chain resilience.
- Collaboration among polymer producers, converters, and FMCG brands will shape circular material design.
- Regulatory enforcement will push wider adoption of recyclable PE structures over composite laminates.
Request a Free Sample
Fill in your details and we'll send you a free sample report.
- Sample data tables & charts
- Research methodology
Need a Custom Version of This Report?
Tailor the scope, geography, or segments to your exact requirements.
- Custom geography or segment scope
- Direct access to our analyst team
Frequently Asked Questions
What is the current market size for Polyethylene (PE) transparent barrier packaging films, and what is its projected size in 2032?
At what Compound Annual Growth Rate is the Polyethylene (PE) transparent barrier packaging films market projected to grow between 2024 and 2032?
Which Polyethylene (PE) transparent barrier packaging films segment held the largest share in 2024?
What are the primary factors fueling the growth of the Polyethylene (PE) transparent barrier packaging films market?
Who are the leading companies in the Polyethylene (PE) transparent barrier packaging films market?
Which region commanded the largest share of the Polyethylene (PE) transparent barrier packaging films market in 2024?
Table of Content
Chapter 1. Report Introduction
- 1.1 Report Description & Purpose
- 1.1.1 Report Title & Market Definition
- 1.1.2 Unique Selling Propositions (USP) & Key Differentiators
- 1.1.3 Value Proposition for Stakeholders
- 1.2 Research Objectives
- 1.2.1 Market Sizing Objectives (Volume & Revenue)
- 1.2.2 Segmentation Objectives
- 1.2.3 Competitive Intelligence Objectives
- 1.2.4 Forecast & Scenario Objectives
- 1.3 Report Scope
- 1.3.1 Polyethylene Transparent Barrier Packaging Films Scope – Types & Subtypes Covered
- 1.3.2 Geographic Scope – Regions & Countries Covered
- 1.3.3 Historical Period, Base Year & Forecast Period (2024; forecast to 2032)
- 1.3.4 Inclusions & Exclusions
- 1.4 HS Code & Classification Framework
- 1.5 Currency, Units & Pricing Basis
- 1.6 Target Stakeholders
- 1.7 Limitations & Assumptions
Chapter 2. Executive Summary
- 2.1 Global Polyethylene Transparent Barrier Packaging Films Market Snapshot
- 2.1.1 Market Size – Historical (2024) & Forecast (2024-2032) (2024: USD 10,587.6 million → 2032: USD 18,055.9 million)
- 2.1.2 Volume & Revenue – Global Totals
- 2.1.3 Key Market Highlights – Top Five Facts
- 2.2 Polyethylene Transparent Barrier Packaging Films Market Segmentation Snapshot
- 2.2.1 Market Split by Region – 2024 vs. 2032
- 2.3 Competitive Snapshot
- 2.3.1 Top 10 Players by Revenue Share – 2024
- 2.3.2 Top 10 Players by Volume Share – 2024
- 2.3.3 Recent Strategic Developments (18-Month Summary)
- 2.4 Key Investment Highlights & Strategic Conclusions
Chapter 3. Polyethylene Transparent Barrier Packaging Films Market Dynamics & Industry Analysis
- 3.1 Market Overview & Context
- 3.1.1 Polyethylene Transparent Barrier Packaging Films Market Position in the Broader Automotive Value Chain
- 3.1.2 OEM vs. Replacement Market Dynamics
- 3.1.3 Market Maturity & Development Stage by Region
- 3.2 Polyethylene Transparent Barrier Packaging Films Market Drivers
- 3.3 Polyethylene Transparent Barrier Packaging Films Market Restraints & Challenges
- 3.4 Polyethylene Transparent Barrier Packaging Films Market Opportunities
- 3.5 Porter's Five Forces Analysis
- 3.5.1 Threat of New Entrants
- 3.5.2 Bargaining Power of Suppliers
- 3.5.3 Bargaining Power of Buyers
- 3.5.4 Threat of Substitutes
- 3.5.5 Competitive Rivalry – Intensity Assessment
- 3.6 Polyethylene Transparent Barrier Packaging Films Value Chain Analysis
- 3.6.1 Upstream – Raw Material/Input Suppliers
- 3.6.1.1 Raw Material/Input 1
- 3.6.1.2 Raw Material/Input 2
- 3.6.1.3 Raw Material/Input 3
- 3.6.2 Midstream – Production/Manufacturing/Service Delivery
- 3.6.2.1 Production/Process Overview
- 3.6.2.2 Key Facility Locations & Capacity by Manufacturer
- 3.6.3 Downstream – Distribution & End Consumer
- 3.6.3.1 Primary Channel – B2B/OEM
- 3.6.3.2 Secondary Channels – Dealer, Retail, Online, Direct
- 3.6.4 Value Chain Profitability Analysis
- 3.6.1 Upstream – Raw Material/Input Suppliers
- 3.7 PESTEL Analysis
- 3.7.1 Political Factors
- 3.7.2 Economic Factors
- 3.7.3 Social Factors
- 3.7.4 Technological Factors
- 3.7.5 Environmental Factors
- 3.7.6 Legal Factors
- 3.8 Polyethylene Transparent Barrier Packaging Films Supply Chain Analysis
- 3.8.1 Raw Material/Input Supply Risk Assessment
- 3.8.2 Manufacturing Concentration Risk (Geographic Exposure)
- 3.8.3 Trade Disruption Impact Analysis
- 3.9 Regulatory & Policy Landscape
Note: The regulatory and policy landscape section covers regulations based on their applicability to the market, Polyethylene Transparent Barrier Packaging Films category, geography, and scope of the study. Only regulatory frameworks with a material impact on operations, compliance, trade, sustainability, or market access are analyzed in detail.
Chapter 4. Key Investment Pockets & Opportunity Analysis
- 4.1 Polyethylene Transparent Barrier Packaging Films Market Attractiveness Analysis
- 4.1.1 By Region – Investment Attractiveness Matrix (Volume × CAGR)
- 4.2 Absolute Revenue Growth Opportunity
- 4.2.1 By Region – Absolute USD Growth Through 2032
- 4.3 Incremental Volume Opportunity
- 4.3.1 By Region – Incremental Volume Through 2032
- 4.3.2 Segment – Incremental Volume
- 4.4 Emerging Submarket Opportunity Deep Dive (Subject to Applicability)
- 4.5 Emerging Market Opportunity Scorecards
- 4.5.1 United States
- 4.5.2 Europe
- 4.5.3 Asia
- 4.5.4 Middle East & Africa
Note: Emerging Market Opportunity Scorecards will be included based on relevance and strategic importance. Regions listed are indicative and may vary depending on data availability and market dynamics.
Chapter 5. Polyethylene Transparent Barrier Packaging Films Import-Export Analysis & Trade Flows
- 5.1 Global Trade Overview
- 5.1.1 Global Export Value by Country (2024)
- 5.1.2 Global Export Volume by Country (2024)
- 5.1.3 Global Import Value by Country (2024)
- 5.1.4 Global Import Volume by Country (2024)
- 5.1.5 Net Trade Balance by Country (2024)
- 5.2 Export Analysis – Segment
- 5.2.1 Type 1 (HS Code)
- 5.2.2 Type 2 (HS Code)
- 5.2.3 Type 3 (HS Code)
- 5.2.4 Type 4 (HS Code)
- 5.2.5 Type 5 (HS Code)
- 5.3 Import Analysis – Segment
- 5.3.1 Type 1 (HS Code)
- 5.3.2 Type 2 (HS Code)
- 5.3.3 Type 3 (HS Code)
- 5.3.4 Type 4 (HS Code)
- 5.3.5 Type 5 (HS Code)
- 5.4 Average Unit Trade Prices
- 5.4.1 Average Export Price – Segment & Country
- 5.4.2 Average Import Price – Segment & Source Country
- 5.4.3 Price Trends (2024)
- 5.5 Key Trade Route Analysis
- 5.5.1 Trade Route 1
- 5.5.2 Trade Route 2
- 5.5.3 Trade Route 3
- 5.5.4 Trade Route 4
- 5.5.5 Trade Route 5
- 5.6 Trade Policy Impact Assessment
- 5.6.1 US Anti-Dumping & Section 301 Tariffs
- 5.6.2 EU Customs Union Impact
- 5.6.3 Major Free Trade Agreements
- 5.6.4 USMCA Rules of Origin
Note: Trade policy analysis will be included only where relevant to the Polyethylene Transparent Barrier Packaging Films market.
Chapter 6. Competitive Landscape & Company Benchmarking
- 6.1 Polyethylene Transparent Barrier Packaging Films Market Concentration & Structure
- 6.1.1 Herfindahl-Hirschman Index (HHI) – vs. 2024
- 6.1.2 Tier 1, Tier 2 & Tier 3 Market Structure
- 6.1.3 Global, Regional & Local Player Dynamics
- 6.2 Polyethylene Transparent Barrier Packaging Films Market Share Analysis – 2024
- 6.2.1 Global Revenue Share by Company
- 6.2.2 Global Volume Share by Company
- 6.2.3 Regional Revenue Share
- 6.2.4 Market Share Evolution ( vs. 2024)
- 6.2.5 OEM Segment Share by Company
- 6.2.6 Replacement Segment Share by Company
- 6.3 Production/Delivery Capacity & Facility Analysis
- 6.3.1 Global Installed Capacity
- 6.3.2 Capacity Utilization Rates
- 6.3.3 Production/Output Volume
- 6.3.4 Facility Locations & Capacity Map
- 6.3.5 Planned Capacity Additions
- 6.4 Polyethylene Transparent Barrier Packaging Films Competitive Benchmarking Matrix
- 6.4.1 Revenue, Volume, CAGR & Profitability Comparison
- 6.4.2 Channel Revenue Mix
- 6.4.3 Geographic Revenue Exposure
- 6.4.4 R&D Intensity
- 6.4.5 Sustainability Maturity
- 6.5 Strategic Developments in Polyethylene Transparent Barrier Packaging Films (Last 24 Months)
- 6.5.1 Mergers, Acquisitions & Divestments
- 6.5.2 New Polyethylene Transparent Barrier Packaging Films Launches
- 6.5.3 Facility Expansions
- 6.5.4 Strategic Alliances, Joint Ventures & Partnerships
- 6.5.5 Distribution Expansion & Market Entry
- 6.5.6 Sustainability & ESG Initiatives
- 6.6 Competitive Strategy Mapping
- 6.6.1 Leader, Challenger, Follower & Niche Classification
- 6.6.2 Pricing Strategy Comparison
- 6.6.3 Channel Strategy Matrix
Note: Strategic developments are included based on their materiality and the availability of reliable information.
Chapter 7. Global Polyethylene Transparent Barrier Packaging Films Market – By Distribution Channel
- 7.1 Segment Overview
- 7.1.1 Volume & Revenue Split by Channel (2024 & 2032)
- 7.1.2 Channel Mix Evolution (2024-2032)
Chapter 8. Regional Market Analysis – Global Overview
- 8.1 Global Regional Overview
- 8.1.1 Regional Volume Share
- 8.1.2 Regional Revenue Share
- 8.1.3 Regional Volume by Region
- 8.1.4 Regional Revenue by Region
- 8.1.5 Regional Forecast Through 2032
- 8.2 Cross-Regional Segment Analysis
- 8.2.1 By Distribution Channel
- 8.2.2 By Brand/Price Tier
Chapter 9. North America Polyethylene Transparent Barrier Packaging Films Market
- 9.1 United States
- 9.2 Canada
- 9.3 Mexico
Chapter 10. Europe Polyethylene Transparent Barrier Packaging Films Market
- 10.1 Germany
- 10.2 France
- 10.3 Italy
- 10.4 United Kingdom
- 10.5 Spain
- 10.6 Poland
- 10.7 Russia
- 10.8 Netherlands
- 10.9 Belgium
- 10.10 Sweden
- 10.11 Denmark
- 10.12 Norway
- 10.13 Rest of Europe
Chapter 11. Asia Pacific Polyethylene Transparent Barrier Packaging Films Market
- 11.1 China
- 11.2 India
- 11.3 Japan
- 11.4 South Korea
- 11.5 Thailand
- 11.6 Indonesia
- 11.7 Vietnam
- 11.8 Malaysia
- 11.9 Australia
- 11.10 Rest of Asia Pacific
Chapter 12. Latin America Polyethylene Transparent Barrier Packaging Films Market
- 12.1 Brazil
- 12.2 Argentina
- 12.3 Colombia
- 12.4 Chile
- 12.5 Rest of Latin America
Chapter 13. Middle East Polyethylene Transparent Barrier Packaging Films Market
- 13.1 Saudi Arabia
- 13.2 United Arab Emirates
- 13.3 Turkey
- 13.4 Israel
- 13.5 Iran
- 13.6 Rest of the Middle East
Chapter 14. Africa Polyethylene Transparent Barrier Packaging Films Market
- 14.1 South Africa
- 14.2 Egypt
- 14.3 Nigeria
- 14.4 Morocco
- 14.5 Rest of Africa
Chapter 15. Polyethylene Transparent Barrier Packaging Films Company Profiles
- 15.1 [Company 01]
- 15.1.1 Company Overview
- 15.1.2 Key Management Personnel
- 15.1.3 Products & Services Portfolio
- 15.1.4 Financial Performance
- 15.1.5 Key Market Focus & Geographic Presence
- 15.1.6 Recent Developments & Strategic Initiatives
Note: The company profile list is preliminary and may change based on research findings, market developments, data availability, and client requirements.
Chapter 16. Appendices
- Appendix A – List of Abbreviations & Acronyms
- Appendix B – Industry Classification Code Reference – Full Series
- Appendix C – Production & Capacity Data Tables
- Appendix D – End-Use & Demand Base Tables
- Appendix E – Consumption & Replacement Rate Assumptions
- Appendix F – ASP Reference Tables
- Appendix G – Manufacturing & Facility Database
- Appendix H – Import-Export Data Tables
- Appendix I – Regulatory Summary Tables
- Appendix J – Primary Research Participant List (Anonymized)
- Appendix K – Primary Research Questionnaire Framework
- Appendix L – Data Sources & Bibliography
- Appendix M – Market Size Divergence & Source Comparison
Chapter 17. Research Methodology
- 17.1 Research Framework & Philosophy
- 17.2 Secondary Research – Sources, Hierarchy & Data Extraction
- 17.3 Data Modeling – Bottom-Up & Top-Down Market Sizing
- 17.4 Primary Research – Stakeholder Framework, LOI & Sample Sizes
- 17.5 Forecast Methodology – Regression, Scenario & Sensitivity Analysis
- 17.6 Quality Control – Four-Layer Validation Framework
- 17.7 Limitations & Standard Assumptions
- 17.8 Disclaimer
