Dairy Alternatives Market Overview:
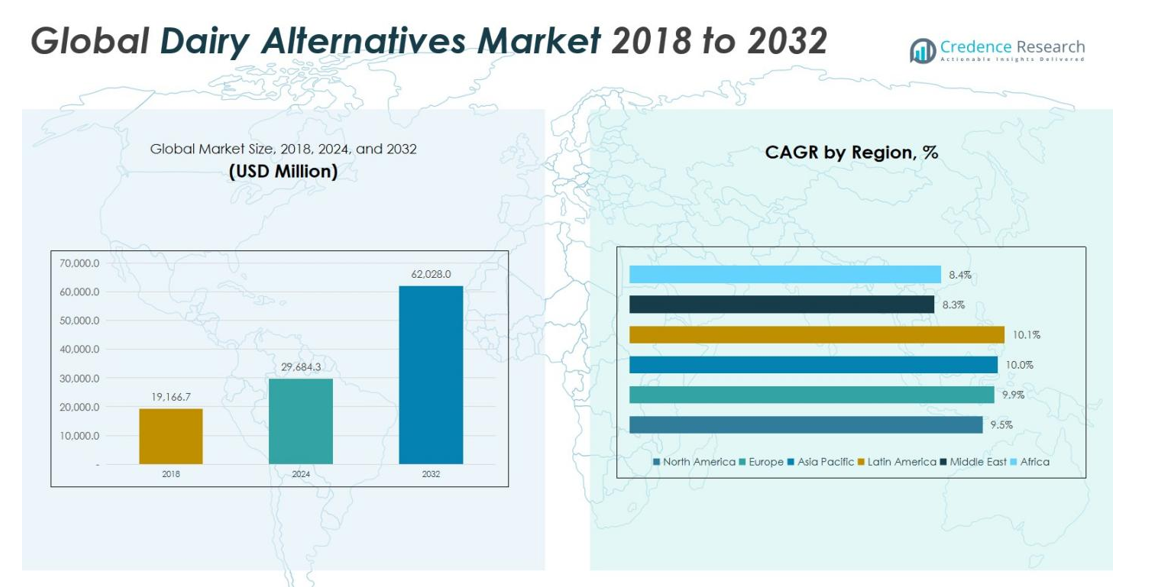
Dairy Alternatives Market size was valued at USD 19,166.7 million in 2018 and is expected to reach USD 29,684.3 million in 2024, growing further to USD 62,028.0 million by 2032, at a CAGR of 9.70% during the forecast period.
| REPORT ATTRIBUTE |
DETAILS |
| Historical Period |
2020-2023 |
| Base Year |
2024 |
| Forecast Period |
2025-2032 |
| Dairy Alternatives Market Size 2024 |
USD 29,684.3 million |
| Dairy Alternatives Market, CAGR |
9.70% |
| Dairy Alternatives Market Size 2032 |
USD 62,028.0 million |
The Dairy Alternatives Market is highly competitive, led by key players including Blue Diamond Growers, CP Kelco, Daiya Foods Inc., Nutriops S.L., Hiland Dairy, Ripple Foods, Califia Farms, Rude Health, Danone, and SunOpta. These companies are driving growth through product innovation, portfolio diversification, and strategic partnerships, particularly in plant-based beverages, yogurts, and cheeses. North America dominates the market, holding a 32% share in 2024, driven by high consumer awareness of lactose intolerance and widespread adoption of plant-based diets. Europe follows with a 27% share, supported by vegan trends and sustainability consciousness. Asia Pacific is emerging rapidly, capturing 22% of the market, fueled by rising health awareness, urbanization, and expanding modern retail. Collectively, these regions represent the majority of global consumption, while key players continue to strengthen their presence through innovation, fortified products, and expansion into high-growth emerging markets.
Dairy Alternatives Market Insights
- The Dairy Alternatives Market was valued at USD 29,684.3 Million in 2024 and is projected to reach USD 62,028.0 Million by 2032, growing at a CAGR of 9.70%.
- Rising health awareness, lactose intolerance prevalence, and the shift toward plant-based diets are driving strong adoption of almond, soy, oat, and rice-based alternatives across global markets.
- Market trends indicate growing demand for functional and fortified products, premiumization, and flavored variants, with plain formulations holding 60% market share and yogurt emerging as the leading application at 28%.
- The competitive landscape is dominated by Blue Diamond Growers, CP Kelco, Daiya Foods Inc., Nutriops S.L., Hiland Dairy, Ripple Foods, Califia Farms, Rude Health, Danone, and SunOpta, focusing on innovation, geographic expansion, and partnerships to strengthen market presence.
- North America leads with 32% market share, followed by Europe at 27%, Asia Pacific at 22%, Latin America at 11%, Middle East at 4%, and Africa at 3%, reflecting strong regional adoption and growth potential.
Access crucial information at unmatched prices!
Request your sample report today & start making informed decisions powered by Credence Research Inc.!
Download Sample
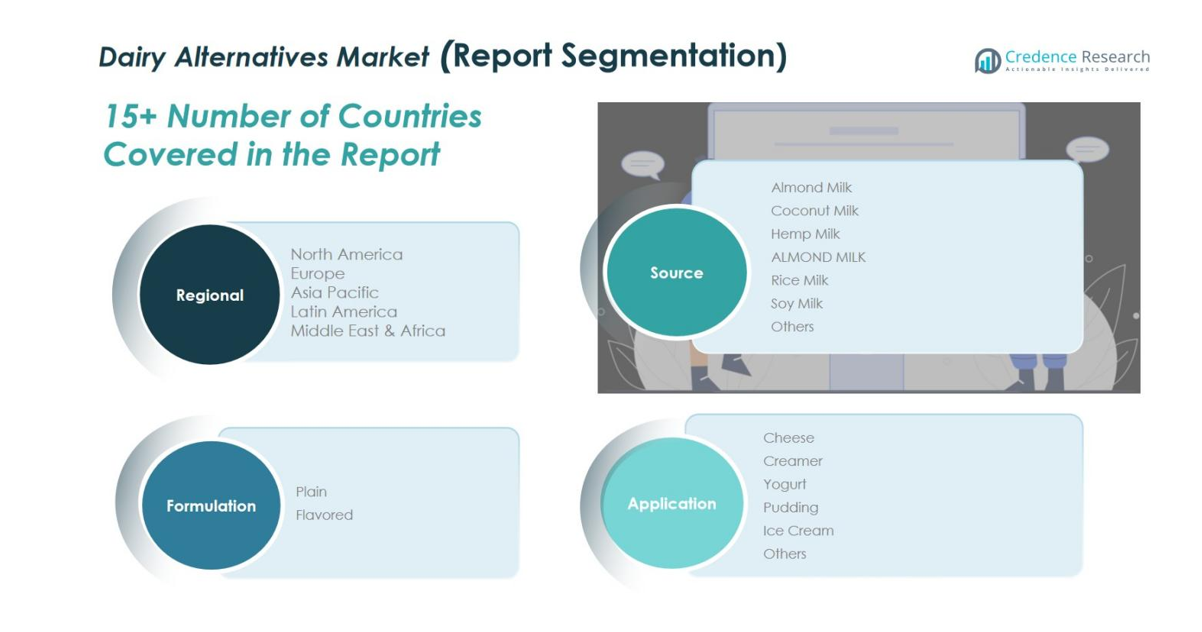
Dairy Alternatives Market Segmentation Analysis:
By Source:
Almond milk dominates the dairy alternatives market, holding a significant share of 34% in 2024. Its growth is fueled by increasing consumer awareness of lactose intolerance, plant-based nutrition, and heart-healthy properties. Coconut milk follows with a 20% share, driven by its versatility in beverages and culinary applications. Hemp, rice, and soy milk collectively account for around 30%, benefiting from niche consumer preferences and sustainability trends. Other sources, including oat and cashew milk, represent the remaining 16%, supported by product innovation and rising vegan adoption globally.
- For instance, the hemp milk market is rapidly expanding with companies such as Pacific Foods innovating with omega-3 rich hemp milk variants.
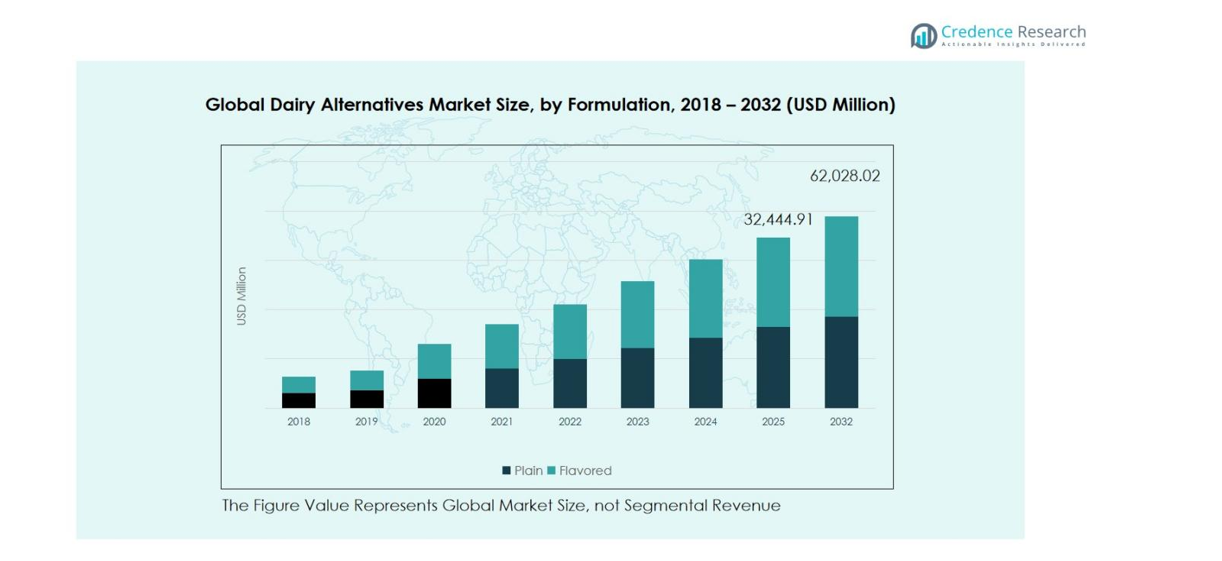
By Formulation:
Plain dairy alternatives lead the market with a 60% share in 2024, driven by consumer preference for natural, minimally processed products and easy customization for recipes. Flavored variants hold 40%, gaining traction through taste innovation, convenience, and youth-targeted marketing. Both segments benefit from the broader trend toward functional beverages, clean-label preferences, and increasing demand in ready-to-drink and fortified plant-based products. Product diversification and health-conscious trends continue to support steady growth for both plain and flavored formulations.
- For instance, Flora Professional introduced a versatile plant-based ice cream mix designed to replace traditional dairy without compromising taste, broadening product diversity.
By Application:
Yogurt is the dominant application sub-segment, capturing 28% market share, fueled by its popularity as a convenient, protein-rich, and probiotic product. Ice cream follows at 22%, driven by indulgence-focused innovation in plant-based flavors and textures. Cheese and creamers collectively account for 30%, supported by vegan cheese alternatives and coffee culture expansion. Pudding and other applications represent the remaining 20%, benefiting from convenience and dessert innovation. Increasing health consciousness, lactose intolerance prevalence, and plant-based diet adoption are the primary drivers shaping application growth.
Key Growth Drivers
Rising Health and Wellness Awareness
Consumers’ growing focus on health and wellness is significantly driving the dairy alternatives market. Increasing lactose intolerance, dietary restrictions, and the shift toward plant-based diets are encouraging the adoption of non-dairy products. Almond, soy, and oat-based alternatives are viewed as heart-healthy and nutrient-rich options. The demand for clean-label and fortified products further supports adoption across various age groups. Rising health consciousness, combined with an interest in functional nutrition, continues to expand the market globally, creating long-term growth potential.
- For instance, Califia Farms recently launched Complete, a plant-based milk fortified with 9 essential nutrients including 8 grams of protein, calcium, vitamins A, D, and B12, closely matching dairy’s nutritional profile.
Environmental and Sustainability Concerns
Environmental sustainability is a major driver in the dairy alternatives market. Plant-based dairy products have a lower carbon footprint and require fewer natural resources compared to traditional dairy. Growing awareness of climate change and ethical food production motivates consumers to choose eco-friendly alternatives. Brands emphasizing sustainable sourcing, production, and packaging appeal to environmentally conscious buyers. This sustainability trend not only boosts product adoption but also enhances brand value and consumer loyalty, reinforcing long-term growth for companies investing in plant-based dairy solutions.
- For instance, Nestlé has developed a variety of plant-based dairy products like pea- and oat-based beverages under its Nesfit brand, which offer a reduced sugar content and a favorable environmental footprint by using one of the most eco-friendly protein sources, yellow peas.
Innovation and Product Diversification
Continuous innovation in flavors, formulations, and nutritional enhancements is accelerating market growth. Companies are introducing plant-based yogurts, ice creams, and cheeses with improved taste, texture, and health benefits. Ready-to-drink beverages and functional products targeting protein, probiotics, and immunity are gaining popularity. Technological advancements in processing extend shelf life and product appeal. Diversification allows brands to cater to niche consumer preferences, expand distribution channels, and differentiate themselves in a competitive landscape, maintaining strong momentum in the dairy alternatives market.
Key Trends & Opportunities
Premiumization of Dairy Alternatives
Consumers increasingly seek premium, high-quality plant-based products, creating opportunities for market expansion. Organic, fortified, and nutrient-enriched alternatives command higher prices, appealing to health-conscious and affluent buyers. Brands offering premium options emphasize taste, texture, and ethical sourcing, aligning with consumer values. This trend encourages innovation in product lines and packaging, strengthening brand differentiation. As consumer willingness to pay for superior and functional products rises, companies can leverage this premiumization trend to increase margins and expand their market presence globally.
- For instance, Oatly Group AB launched innovative oat beverages like Unsweetened Oatmilk and Super Basic Oatmilk in the U.S., focusing on clean-label formulations with minimal ingredients and upcycled fibers, catering to consumers prioritizing simplicity and sustainability.
Rising Demand for Functional Products
Functional dairy alternatives fortified with protein, vitamins, minerals, and probiotics are gaining strong traction. Consumers are seeking products that provide additional health benefits beyond basic nutrition, such as immunity support, digestive wellness, and energy enhancement. This trend is particularly evident in ready-to-drink beverages and fortified yogurts. Functional products help brands capture a health-conscious demographic and create opportunities for product differentiation. Market players investing in research and development of innovative formulations are well-positioned to benefit from growing consumer interest in functional plant-based dairy solutions.
- For instance, Danone has developed ready-to-drink probiotic beverages containing clinically validated strains of Lactobacillus casei that support digestive health.
Key Challenges
High Production Costs
High production costs remain a challenge for the dairy alternatives market. Sourcing quality plant-based ingredients, specialized processing, and fortification increase manufacturing expenses compared to conventional dairy. These higher costs can result in premium pricing, limiting accessibility for price-sensitive consumers. Additionally, maintaining consistent taste, texture, and nutritional quality across large-scale production adds complexity. Companies must balance innovation with cost efficiency to remain competitive, while also educating consumers about the value and benefits of plant-based alternatives to justify higher price points.
Regulatory and Labeling Issues
Regulatory and labeling challenges hinder market growth in some regions. Varying definitions of dairy alternatives, labeling restrictions, and strict claims regarding nutrition or health benefits can complicate product launches. Mislabeling or non-compliance risks penalties and can damage brand reputation. Market players must navigate complex regulations while maintaining consumer trust. Clear, transparent labeling and adherence to international and local standards are crucial to ensuring product acceptance. These regulatory hurdles require strategic planning and robust compliance measures to minimize risks and support sustainable growth.
Regional Analysis
North America
North America’s dairy alternatives market was valued at USD 6,154.42 million in 2018 and is projected to reach USD 9,454.02 million in 2024, further expanding to USD 19,538.83 million by 2032, growing at a CAGR of 9.5%. The region accounts for a significant market share, led by high consumer awareness of lactose intolerance and strong adoption of plant-based diets. Almond and soy milk dominate the market, supported by innovation in yogurts, ice creams, and fortified beverages. Rising health consciousness and clean-label preferences continue to drive steady growth across the U.S., Canada, and Mexico.
Europe
Europe’s market was valued at USD 5,069.59 million in 2018, expected to grow to USD 7,925.28 million by 2024 and reach USD 16,766.17 million by 2032, at a CAGR of 9.9%. The region holds a substantial market share, driven by increasing lactose intolerance, vegan trends, and sustainability awareness. Germany, the UK, and France are key contributors, with almond and oat milk leading demand. Innovation in flavored and fortified yogurts, beverages, and ice creams enhances market penetration, while strong retail and e-commerce channels support widespread adoption across both mature and emerging European markets.
Asia Pacific
Asia Pacific’s dairy alternatives market stood at USD 4,174.50 million in 2018 and is projected to reach USD 6,556.83 million in 2024, growing further to USD 13,956.30 million by 2032, at a CAGR of 10.0%. Rapid adoption is fueled by health awareness, lactose intolerance, and a growing vegetarian population. China, Japan, and India are major contributors, with almond, soy, and rice milk dominating consumption. Urbanization, rising disposable incomes, and expanding modern retail channels accelerate market growth, while functional and fortified products, including beverages and yogurts, create significant opportunities.
Latin America
Latin America’s market was valued at USD 2,112.17 million in 2018 and is expected to reach USD 3,353.90 million by 2024, further growing to USD 7,238.67 million by 2032, at a CAGR of 10.1%. Brazil and Argentina dominate consumption, driven by rising lactose intolerance awareness and increasing adoption of plant-based diets. Almond, soy, and oat milk lead demand, supported by expanding retail networks and product innovation. Urbanization, rising middle-class incomes, and growing interest in functional beverages and fortified products further accelerate adoption across the region.
Middle East
The Middle East market was valued at USD 916.17 million in 2018, projected to grow to USD 1,319.68 million by 2024 and reach USD 2,481.12 million by 2032, at a CAGR of 8.3%. GCC countries and Israel lead the market, driven by rising lactose intolerance, health-conscious diets, and vegan trends. Almond and soy milk are the dominant sub-segments, supported by flavored and fortified product innovations. Expanding modern retail, greater product availability, and increasing awareness of plant-based nutrition are contributing to steady market growth across the region.
Africa
Africa’s dairy alternatives market was valued at USD 739.83 million in 2018 and is expected to reach USD 1,074.57 million by 2024, expanding further to USD 2,046.92 million by 2032, at a CAGR of 8.4%. South Africa and Egypt are the largest contributors, with almond, soy, and coconut milk leading demand. Market growth is supported by increasing awareness of lactose intolerance, urbanization, and adoption of plant-based diets. Retail modernization, improved import availability, and demand for fortified and flavored dairy alternatives drive adoption among health-conscious and younger consumers across the continent.
Dairy Alternatives Market Segmentations:
By Source
- Almond Milk
- Coconut Milk
- Hemp Milk
- Rice Milk
- Soy Milk
- Others
By Formulation
By Application
- Cheese
- Creamer
- Yogurt
- Pudding
- Ice Cream
- Others
By Region
- North America
- Europe
- Germany
- France
- U.K.
- Italy
- Spain
- Rest of Europe
- Asia Pacific
- China
- Japan
- India
- South Korea
- South-east Asia
- Rest of Asia Pacific
- Latin America
- Brazil
- Argentina
- Rest of Latin America
- Middle East & Africa
- GCC Countries
- South Africa
- Rest of the Middle East and Africa
Competitive Landscape
The competitive landscape of the Dairy Alternatives Market includes key players such as Blue Diamond Growers, CP Kelco, Daiya Foods Inc., Nutriops S.L., Hiland Dairy, Ripple Foods, Califia Farms, Rude Health, Danone, and SunOpta. Market competition is intensifying as companies focus on product innovation, geographic expansion, and portfolio diversification to capture growing demand for plant-based dairy. Leading players are investing in fortified and flavored beverages, yogurts, and cheeses to meet health-conscious consumer preferences. Strategic partnerships, mergers, and acquisitions are also common, enabling market participants to strengthen distribution networks and enhance brand recognition. Regional players are leveraging local sourcing and tailored formulations to address cultural taste preferences. With increasing consumer adoption of plant-based diets and rising health awareness, competitive dynamics are expected to remain robust, emphasizing innovation, sustainability, and strategic collaborations as key differentiators in a rapidly expanding market.
Shape Your Report to Specific Countries or Regions & Enjoy 30% Off!
Key Player Analysis
- Blue Diamond Growers
- CP Kelco
- Daiya Foods Inc.
- Nutriops, S.L.
- Hiland Dairy
- Ripple Foods
- Califia Farms, LLC
- Rude Health
- Danone
- SunOpta
- Other Key Players
Recent Developments
- In October 2024, UK-based plant-based milk brand Rude Health was acquired by Finland’s Oddlygood, a subsidiary of Valio, to strengthen its position in the UK dairy alternatives market.
- In June 2025, Indian dairy brand Amul entered the European market through a strategic partnership with Spain’s Cooperativa Ganadera del Valle de los Pedroches (COVAP), aiming to introduce its flagship milk products to Spain and other EU countries.
- In April 2025, Alpro, owned by Danone, began using British-grown oats processed at the Navara Oat Milling factory to produce oat milk, supporting the growing demand for locally sourced plant-based beverages in the UK.
Report Coverage
The research report offers an in-depth analysis based on Source, Formulation, Application and Region. It details leading market players, providing an overview of their business, product offerings, investments, revenue streams, and key applications. Additionally, the report includes insights into the competitive environment, SWOT analysis, current market trends, as well as the primary drivers and constraints. Furthermore, it discusses various factors that have driven market expansion in recent years. The report also explores market dynamics, regulatory scenarios, and technological advancements that are shaping the industry. It assesses the impact of external factors and global economic changes on market growth. Lastly, it provides strategic recommendations for new entrants and established companies to navigate the complexities of the market.
Future Outlook
- The market is expected to continue strong growth driven by rising health and wellness awareness.
- Plant-based diets and vegan lifestyles will increasingly influence consumer preferences globally.
- Innovation in flavors, formulations, and fortified products will expand adoption across age groups.
- Functional dairy alternatives targeting protein, probiotics, and immunity will see higher demand.
- Almond, soy, oat, and rice-based products will maintain dominance, with niche ingredients gaining traction.
- Expansion of modern retail and e-commerce channels will improve product accessibility.
- Sustainability and eco-friendly production practices will shape consumer purchasing decisions.
- Ready-to-drink beverages and convenience-oriented products will drive market penetration.
- Emerging markets in Asia Pacific, Latin America, and Africa will experience rapid growth.
- Strategic collaborations, partnerships, and mergers will strengthen market presence and competitiveness.


