
Market Overview:
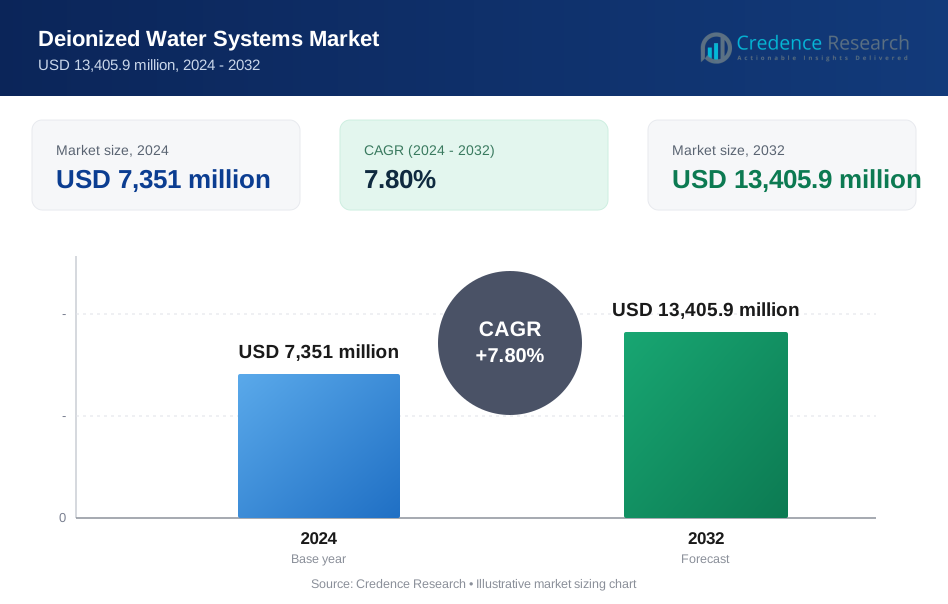
Deionized water systems market size was valued at USD 7351 million in 2024 and is anticipated to reach USD 13405.9 million by 2032, at a CAGR of 7.8 % during the forecast period (2024-2032).
| REPORT ATTRIBUTE | DETAILS |
|---|---|
| Historical Period | 2020-2023 |
| Base Year | 2024 |
| Forecast Period | 2025-2032 |
| Deionized Water Systems Market Size 2024 | USD 7351 Million |
| Deionized Water Systems Market, CAGR | 7.8 % |
| Deionized Water Systems Market Size 2032 | USD 13405.9 Million |
Several key factors drive the deionized water systems market. Growing environmental concerns and tightening regulatory frameworks for water discharge are compelling industries to adopt advanced water purification solutions. Rapid industrialization, especially in emerging economies, boosts the need for efficient water management systems. Technological advancements have led to the development of compact, energy-efficient, and automated deionized water systems, enabling broader adoption across small- and medium-scale enterprises. The increased prevalence of waterborne contaminants and the rising focus on sustainable manufacturing further amplify market growth. In addition, the trend toward zero-liquid discharge (ZLD) practices in various industries is expected to spur investments in high-performance deionization technology. Increasing consumer awareness about the adverse effects of impurities in water is encouraging businesses to prioritize high-purity solutions. The growing use of deionized water in laboratories, research institutions, and the automotive sector also contributes to sustained market demand.
Regionally, Asia Pacific leads the deionized water systems market, driven by rapid industrialization and strong demand from electronics, pharmaceuticals, and power sectors in China, India, and South Korea. In this context, Puretec Systems, NANCREDE Engineers Co., and Reynolds Culligan are expanding their presence through partnerships and advanced installations. North America and Europe hold substantial shares, supported by strict water quality regulations and established industries. The Middle East and Africa are emerging markets, with increased investments in water treatment infrastructure and supportive government policies accelerating adoption.
Market Insights:
- The deionized water systems market was valued at USD 7,351 million in 2024 and is projected to reach USD 13,405.9 million by 2032, registering a robust CAGR of 7.8%.
- Stringent regulatory standards for water discharge and environmental compliance are driving adoption of advanced deionization technologies across industries.
- Rapid industrialization in Asia Pacific and Latin America, especially in electronics, pharmaceuticals, and power, is fueling demand for high-purity water solutions.
- Technological advancements have enabled compact, energy-efficient, and automated systems, making deionized water accessible to small- and medium-sized enterprises.
- High initial investment and operational costs, along with complex integration and skilled manpower requirements, present significant challenges to wider adoption.
- Asia Pacific leads the market with a 41% share, followed by North America at 27% and Europe at 21%, reflecting strong regional demand and regulatory focus.
- Rising awareness of water quality, expansion into laboratories and automotive sectors, and favorable policies for water reuse and conservation continue to create new growth opportunities globally.
Market Drivers:
Stringent Regulatory Standards and Environmental Compliance Fuel Adoption
The implementation of strict regulatory standards regarding water purity and wastewater discharge is a primary driver for the deionized water systems market. Governments and international agencies enforce tighter limits on contaminants and require industries to minimize environmental impact. The need for compliance with evolving environmental laws encourages facilities to invest in advanced deionization technologies. The push for zero-liquid discharge (ZLD) and the reduction of hazardous waste output are top priorities for manufacturing sectors. Companies face mounting pressure to meet these requirements or risk penalties and reputational harm. Regulatory frameworks stimulate innovation in water purification, creating demand for reliable, efficient deionized water systems.
Industrial Expansion and Demand for High-Purity Water Intensifies Market Growth
Rapid industrialization, particularly in emerging economies, significantly boosts the need for deionized water systems. Sectors such as pharmaceuticals, electronics, power generation, and food and beverage manufacturing require ultra-pure water for critical processes. It supports consistent product quality, enhances operational efficiency, and reduces equipment wear. Manufacturers increasingly rely on deionized water to avoid contamination and maintain industry standards. The global expansion of these sectors strengthens the market’s foundation, ensuring stable, long-term demand. Industrial growth in Asia Pacific and Latin America further amplifies the adoption of advanced water treatment solutions.
- For instance, Veolia Water Technologies reported that their advanced deionization systems have enabled pharmaceutical manufacturers to achieve water purity levels exceeding 18.2 MΩ·cm resistivity, critical for ensuring consistent drug quality and regulatory compliance.
Technological Advancements Drive Efficiency and Broader Application
Continuous technological advancements contribute to the evolution of the deionized water systems market. The introduction of automated, energy-efficient, and compact systems makes high-purity water accessible for small- and medium-sized enterprises. It lowers operational costs while providing high throughput and consistent quality. Advances in monitoring, control, and membrane technology increase reliability and ease of use. Modern systems can integrate seamlessly with existing infrastructure, facilitating widespread adoption across diverse applications. The emphasis on innovation attracts new users and strengthens market competitiveness.
Rising Awareness of Water Quality and Expanding Application Scope
Growing awareness of the importance of water quality influences purchasing decisions across industries. Stakeholders recognize the critical role of pure water in protecting human health, ensuring product safety, and achieving regulatory compliance. The deionized water systems market benefits from expanding application areas, including laboratories, research institutions, and automotive manufacturing. It addresses concerns about waterborne contaminants, supports research integrity, and maintains operational safety. The trend toward sustainable manufacturing and increased investments in research and healthcare sectors broadens the market’s reach, driving continued growth.
- For instance, ELGA LabWater’s PURELAB Quest system, launched in 2023, is capable of delivering 10 liters per hour of Type I, II, and III purified water with a conductivity of less than 0.055 μS/cm at 25°C, and is now used in more than 6,000 academic and pharmaceutical research labs worldwide
Market Trends:
Technological Innovation and Automation Enhance System Performance
The deionized water systems market is experiencing a notable shift towards advanced technologies that prioritize efficiency, reliability, and automation. The adoption of intelligent control systems, real-time water quality monitoring, and remote operation capabilities is becoming more prevalent across industrial and commercial sectors. It leverages sensor integration and data analytics to ensure precise deionization and proactive maintenance. The development of compact, modular, and energy-efficient systems supports flexible deployment in both large-scale manufacturing facilities and smaller enterprises. Manufacturers introduce features such as automated regeneration cycles and membrane-based purification methods to reduce operational costs and improve sustainability. This technological evolution increases the appeal of deionized water systems among a broader customer base.
- For Instance, Puretec Systems launched its IntelliPure DI controller, which enables real-time monitoring and remote adjustment for up to 10,000 liters of deionized water output per day, as documented in the company’s technical release from March 2024.
Growing Integration with Sustainable and Circular Water Management Practices
Sustainability trends and the global focus on resource conservation significantly influence the deionized water systems market. The market aligns with green manufacturing principles by supporting water reuse, recycling, and zero-liquid discharge (ZLD) initiatives across multiple industries. Companies prioritize solutions that minimize water wastage and energy consumption, integrating deionized water systems into circular water management strategies. The increased emphasis on environmentally responsible production drives demand for systems with lower environmental footprints and enhanced operational transparency. It benefits from partnerships and collaborations focused on water stewardship, encouraging adoption in industries seeking to achieve ambitious sustainability targets. The integration of deionized water systems into smart factory and eco-friendly infrastructure projects is expected to accelerate in the coming years.
- For instance, Veolia Water Technologies implemented a zero-liquid discharge (ZLD) system at a refinery in India that processes 430 cubic meters of wastewater per hour, recovering 95% of water for reuse and reducing freshwater intake by 130 million liters annually.
Market Challenges Analysis:
High Capital Investment and Operational Costs Limit Broader Adoption
The deionized water systems market faces significant challenges related to high initial investment and ongoing operational costs. Installation of advanced deionization technology requires considerable capital, which can deter small and medium-sized enterprises. Maintenance expenses, such as replacement of resins, membranes, and filters, further increase total ownership costs. It often encounters resistance from budget-conscious organizations, particularly in regions with limited financial resources. Complex system requirements and the need for skilled personnel to operate and maintain the systems add to operational barriers. These cost factors can restrict widespread adoption and slow market penetration in price-sensitive industries.
Complexity of System Integration and Water Quality Management
Integration of deionized water systems into existing industrial infrastructure often presents technical and logistical difficulties. It demands customized solutions to accommodate diverse process requirements and fluctuating water quality levels. The need for continuous monitoring and precise control complicates operations, requiring investment in staff training and advanced instrumentation. Variation in feed water characteristics can impact system efficiency and lifespan, leading to unpredictable performance and higher maintenance needs. The deionized water systems market must address these integration and management challenges to enable consistent, reliable operation across varied industry environments.
Market Opportunities:
Expansion in Emerging Markets and Untapped Industrial Applications
The deionized water systems market presents strong opportunities for growth in emerging economies experiencing rapid industrialization and infrastructure development. It benefits from rising investments in sectors such as electronics, pharmaceuticals, power generation, and food and beverage processing across Asia Pacific, Latin America, and the Middle East. The increase in manufacturing activity and the need for high-purity water in these regions create favorable conditions for market expansion. Untapped industrial applications, such as renewable energy, microelectronics, and specialty chemicals, offer further potential. Companies can capture new business by providing tailored solutions that address the specific needs and regulations of local markets. The trend toward localization and government support for advanced water management infrastructure strengthen prospects for market participants.
Innovation in Sustainable and Smart Water Purification Solutions
Advancements in sustainable technology and digitalization open new avenues for the deionized water systems market. It can leverage innovation in membrane materials, energy-efficient processes, and IoT-enabled monitoring systems to deliver value-added solutions. The growing emphasis on water reuse, recycling, and zero-liquid discharge creates demand for next-generation systems that align with global sustainability targets. Collaboration with technology providers and integration with smart factory ecosystems will enhance the functionality and appeal of deionized water systems. The focus on reducing environmental footprints and achieving regulatory compliance presents significant opportunity for providers to differentiate their offerings and capture emerging customer segments.
Market Segmentation Analysis:
By Capacity
The deionized water systems market features segmentation by capacity, including small, medium, and large-scale systems. Small-capacity units cater to laboratories, research institutions, and small manufacturing operations that require limited but consistently high-purity water output. Medium and large-capacity systems serve heavy industries, electronics manufacturing, pharmaceuticals, and power generation, where both water quality and large volumes are essential for continuous operations.
By Configuration
By configuration, the market comprises two-bed, mixed-bed, and electrodeionization (EDI) systems. Two-bed systems offer cost-effective solutions for moderate purity applications, appealing to industries with less stringent requirements. Mixed-bed and EDI systems address the need for ultra-pure water, supporting advanced manufacturing, life sciences, and healthcare sectors. Mixed-bed configurations provide flexibility and are widely chosen in environments where the highest water quality standards must be met.
- For instance, Purolite’s two-bed ion exchange resin configuration effectively removes hardness and dissolved salts while reducing operational costs, with a validated resin capacity of 1.2 eq/L, supporting industries such as power generation and municipal water treatment
By Buyer Type
The deionized water systems market serves both industrial and institutional buyers. Industrial buyers include companies in chemicals, automotive, food and beverage, and energy, all demanding robust, high-capacity systems for process reliability. Institutional buyers, such as hospitals, universities, and research centers, prioritize compact systems that deliver ease of use and consistent water quality. It adapts solutions to fit the operational, regulatory, and capacity requirements unique to each buyer segment.
Segmentations:
By Capacity
- Small Capacity
- Medium Capacity
- Large Capacity
By Configuration
- Two-Bed Systems
- Mixed-Bed Systems
- Electrodeionization (EDI) Systems
By Buyer Type
- Industrial Buyers
- Institutional Buyers
By End User
- Pharmaceuticals
- Electronics and Semiconductors
- Power Generation
- Food and Beverage
- Laboratories and Research Institutes
- Healthcare
- Automotive
- Others
By Region
- North America
- U.S.
- Canada
- Mexico
- Europe
- Germany
- France
- U.K.
- Italy
- Spain
- Rest of Europe
- Asia Pacific
- China
- Japan
- India
- South Korea
- South-east Asia
- Rest of Asia Pacific
- Latin America
- Brazil
- Argentina
- Rest of Latin America
- Middle East & Africa
- GCC Countries
- South Africa
- Rest of the Middle East and Africa
Regional Analysis:
Asia Pacific
Asia Pacific accounts for 41% of the global deionized water systems market, holding the largest regional share. The region’s growth is driven by rapid industrialization and strong demand from sectors such as electronics, pharmaceuticals, and power generation in China, India, Japan, and South Korea. It benefits from expanding production capacities, foreign direct investment, and a large pool of end users across diverse industries. Favorable government policies and increased public and private sector funding for water management further drive adoption of advanced deionization systems. The growing focus on environmental protection and water reuse accelerates market growth, particularly in urban and industrial hubs. Regional manufacturers and global players continue to expand their presence and partnerships, reinforcing Asia Pacific’s leadership position.
North America and Europe
North America holds a 27% share, while Europe accounts for 21% of the global deionized water systems market. Both regions sustain growth through advanced regulatory frameworks, established industrial bases, and strong emphasis on sustainable practices. The United States, Canada, Germany, the United Kingdom, and France prioritize water quality management, supporting steady investment in deionization solutions. It leverages innovation in automation, remote monitoring, and smart water purification systems to address evolving customer needs. Stringent compliance requirements for wastewater discharge and environmental standards promote the adoption of state-of-the-art technologies. Mature end-user industries such as pharmaceuticals, food processing, and chemicals remain key contributors to regional demand.
Middle East, Africa, and Latin America
The Middle East, Africa, and Latin America collectively represent 11% of the global deionized water systems market. These regions are witnessing growth driven by industrialization, urbanization, and infrastructure projects that increase the need for advanced water treatment solutions. Governments invest in water conservation, public health, and sustainable manufacturing, spurring adoption of purification technologies. It benefits from rising awareness about water quality and the need for reliable systems in sectors such as energy, mining, and municipal water treatment. Regional and international players collaborate on large-scale projects and capacity-building initiatives, strengthening local expertise and market presence. Economic diversification efforts and environmental stewardship underpin long-term market growth in these regions.
Key Player Analysis:
- Puretec Systemss
- NANCREDE Engineers Co.
- Reynolds Culligan
- Labtron
- Besco Water Systems Inc.
- Evoqua Water Technologies
- IMELTECH SDN BHD
- Pure Aqua, Inc.
- Industrial Water Solution
- Veolia Water Technologies
Competitive Analysis:
The deionized water systems market demonstrates a competitive landscape characterized by the presence of established global players and a growing number of regional manufacturers. Leading companies such as Veolia, SUEZ, Evoqua Water Technologies, Labtron, and Puretec Systems hold significant market shares, driven by their broad product portfolios and advanced technology offerings. It experiences frequent product innovations, mergers, and strategic collaborations as key players seek to strengthen their market positions and expand geographic reach. Smaller and niche companies compete by focusing on customized solutions, technical support, and cost-effectiveness for specific industrial requirements. The market rewards providers who deliver high reliability, energy efficiency, and compliance with evolving water quality standards. Intense competition encourages continuous improvement in system design and service delivery, while customer focus remains central to growth strategies in the deionized water systems market.
Recent Developments:
- In March 2025, Culligan International signed on as a supporting sponsor to supply filtered water in sustainable aluminum bottles at major races (Shamrock Shuffle, Chicago 13.1, Chicago Marathon), replacing single-use plastics
- In October 2024, Reynolds Consumer Products reported Q3 revenues of $910 million and announced leadership changes, with Scott Huckins set to become President and CEO and Nathan Lowe as CFO starting January 1, 2025.
- In 2023, Xylem Inc. completed its acquisition of Evoqua Water Technologies in an all-stock transaction valued at approximately $7.5 billion.
Market Concentration & Characteristics:
The deionized water systems market exhibits a moderate to high level of market concentration, with several major global players dominating overall revenue and technological innovation. It features a mix of large multinational corporations and specialized regional firms, each addressing specific industry requirements. The market values strong research and development capabilities, advanced automation, and robust after-sales support. Product differentiation focuses on reliability, efficiency, and compliance with water quality standards. Customer loyalty is shaped by consistent system performance and responsive technical service. It continues to evolve in response to changing regulatory demands and industry needs, making adaptability and continuous innovation essential characteristics for market participants.
Report Coverage:
The research report offers an in-depth analysis based on Capacity, Configuration, Buyer Type, End User, Region. It details leading market players, providing an overview of their business, product offerings, investments, revenue streams, and key applications. Additionally, the report includes insights into the competitive environment, SWOT analysis, current market trends, as well as the primary drivers and constraints. Furthermore, it discusses various factors that have driven market expansion in recent years. The report also explores market dynamics, regulatory scenarios, and technological advancements that are shaping the industry. It assesses the impact of external factors and global economic changes on market growth. Lastly, it provides strategic recommendations for new entrants and established companies to navigate the complexities of the market.
Future Outlook:
- Industry-wide shift toward sustainable water management drives increased demand for integrated deionized water systems.
- Emerging technologies in membrane separation and ion exchange enhance system performance and cost efficiency.
- Continuous digitalization and remote monitoring capability increase system reliability and reduce unplanned downtime.
- Customized deionization units gain traction in niche industries such as biotechnology, laboratory research, and specialty chemicals.
- Demand for mobile and modular systems expands adoption opportunities across decentralized industrial facilities.
- Providers form strategic alliances with engineering firms and EPC contractors to access large-scale infrastructure projects.
- Circular economy and zero-liquid discharge initiatives push the development of closed-loop deionization solutions.
- Competitive dynamics favor companies that offer scalable, energy-efficient systems with predictable lifecycle costs.
- Regional expansions into Africa, Latin America, and the Middle East create fresh markets for mid-tier and local suppliers.
- It fosters a shift toward hybrid purification models combining deionization with reverse osmosis and electro-deionization technologies.
Request a Free Sample
Fill in your details and we'll send you a free sample report.
- Sample data tables & charts
- Research methodology
Need a Custom Version of This Report?
Tailor the scope, geography, or segments to your exact requirements.
- Custom geography or segment scope
- Direct access to our analyst team
Frequently Asked Questions
What is the current size of the Deionized water systems market?
What factors are driving the growth of the Deionized water systems market?
What are the key segments within the Deionized water systems market?
What are some challenges faced by the Deionized water systems market?
Who are the major players in the Deionized water systems market?
Table of Content
Chapter 1. Report Introduction
- 1.1 Report Description & Purpose
- 1.1.1 Report Title & Market Definition
- 1.1.2 Unique Selling Propositions (USP) & Key Differentiators
- 1.1.3 Value Proposition for Stakeholders
- 1.2 Research Objectives
- 1.2.1 Market Sizing Objectives (Volume & Revenue)
- 1.2.2 Segmentation Objectives
- 1.2.3 Competitive Intelligence Objectives
- 1.2.4 Forecast & Scenario Objectives
- 1.3 Report Scope
- 1.3.1 Deionized Water Systems Scope – Types & Subtypes Covered
- 1.3.2 Geographic Scope – Regions & Countries Covered
- 1.3.3 Historical Period, Base Year & Forecast Period (2024; forecast to 2032)
- 1.3.4 Inclusions & Exclusions
- 1.4 HS Code & Classification Framework
- 1.5 Currency, Units & Pricing Basis
- 1.6 Target Stakeholders
- 1.7 Limitations & Assumptions
Chapter 2. Executive Summary
- 2.1 Global Deionized Water Systems Market Snapshot
- 2.1.1 Market Size – Historical (2024) & Forecast (2024-2032) (2024: USD 7,351 million → 2032: USD 13,405.9 million)
- 2.1.2 Volume & Revenue – Global Totals
- 2.1.3 Key Market Highlights – Top Five Facts
- 2.2 Deionized Water Systems Market Segmentation Snapshot
- 2.2.1 Market Split by Region – 2024 vs. 2032
- 2.3 Competitive Snapshot
- 2.3.1 Top 10 Players by Revenue Share – 2024
- 2.3.2 Top 10 Players by Volume Share – 2024
- 2.3.3 Recent Strategic Developments (18-Month Summary)
- 2.4 Key Investment Highlights & Strategic Conclusions
Chapter 3. Deionized Water Systems Market Dynamics & Industry Analysis
- 3.1 Market Overview & Context
- 3.1.1 Deionized Water Systems Market Position in the Broader Automotive Value Chain
- 3.1.2 OEM vs. Replacement Market Dynamics
- 3.1.3 Market Maturity & Development Stage by Region
- 3.2 Deionized Water Systems Market Drivers
- 3.3 Deionized Water Systems Market Restraints & Challenges
- 3.4 Deionized Water Systems Market Opportunities
- 3.5 Porter's Five Forces Analysis
- 3.5.1 Threat of New Entrants
- 3.5.2 Bargaining Power of Suppliers
- 3.5.3 Bargaining Power of Buyers
- 3.5.4 Threat of Substitutes
- 3.5.5 Competitive Rivalry – Intensity Assessment
- 3.6 Deionized Water Systems Value Chain Analysis
- 3.6.1 Upstream – Raw Material/Input Suppliers
- 3.6.1.1 Raw Material/Input 1
- 3.6.1.2 Raw Material/Input 2
- 3.6.1.3 Raw Material/Input 3
- 3.6.2 Midstream – Production/Manufacturing/Service Delivery
- 3.6.2.1 Production/Process Overview
- 3.6.2.2 Key Facility Locations & Capacity by Manufacturer
- 3.6.3 Downstream – Distribution & End Consumer
- 3.6.3.1 Primary Channel – B2B/OEM
- 3.6.3.2 Secondary Channels – Dealer, Retail, Online, Direct
- 3.6.4 Value Chain Profitability Analysis
- 3.6.1 Upstream – Raw Material/Input Suppliers
- 3.7 PESTEL Analysis
- 3.7.1 Political Factors
- 3.7.2 Economic Factors
- 3.7.3 Social Factors
- 3.7.4 Technological Factors
- 3.7.5 Environmental Factors
- 3.7.6 Legal Factors
- 3.8 Deionized Water Systems Supply Chain Analysis
- 3.8.1 Raw Material/Input Supply Risk Assessment
- 3.8.2 Manufacturing Concentration Risk (Geographic Exposure)
- 3.8.3 Trade Disruption Impact Analysis
- 3.9 Regulatory & Policy Landscape
Note: The regulatory and policy landscape section covers regulations based on their applicability to the market, Deionized Water Systems category, geography, and scope of the study. Only regulatory frameworks with a material impact on operations, compliance, trade, sustainability, or market access are analyzed in detail.
Chapter 4. Key Investment Pockets & Opportunity Analysis
- 4.1 Deionized Water Systems Market Attractiveness Analysis
- 4.1.1 By Region – Investment Attractiveness Matrix (Volume × CAGR)
- 4.2 Absolute Revenue Growth Opportunity
- 4.2.1 By Region – Absolute USD Growth Through 2032
- 4.3 Incremental Volume Opportunity
- 4.3.1 By Region – Incremental Volume Through 2032
- 4.3.2 Segment – Incremental Volume
- 4.4 Emerging Submarket Opportunity Deep Dive (Subject to Applicability)
- 4.5 Emerging Market Opportunity Scorecards
- 4.5.1 United States
- 4.5.2 Europe
- 4.5.3 Asia
- 4.5.4 Middle East & Africa
Note: Emerging Market Opportunity Scorecards will be included based on relevance and strategic importance. Regions listed are indicative and may vary depending on data availability and market dynamics.
Chapter 5. Deionized Water Systems Import-Export Analysis & Trade Flows
- 5.1 Global Trade Overview
- 5.1.1 Global Export Value by Country (2024)
- 5.1.2 Global Export Volume by Country (2024)
- 5.1.3 Global Import Value by Country (2024)
- 5.1.4 Global Import Volume by Country (2024)
- 5.1.5 Net Trade Balance by Country (2024)
- 5.2 Export Analysis – Segment
- 5.2.1 Type 1 (HS Code)
- 5.2.2 Type 2 (HS Code)
- 5.2.3 Type 3 (HS Code)
- 5.2.4 Type 4 (HS Code)
- 5.2.5 Type 5 (HS Code)
- 5.3 Import Analysis – Segment
- 5.3.1 Type 1 (HS Code)
- 5.3.2 Type 2 (HS Code)
- 5.3.3 Type 3 (HS Code)
- 5.3.4 Type 4 (HS Code)
- 5.3.5 Type 5 (HS Code)
- 5.4 Average Unit Trade Prices
- 5.4.1 Average Export Price – Segment & Country
- 5.4.2 Average Import Price – Segment & Source Country
- 5.4.3 Price Trends (2024)
- 5.5 Key Trade Route Analysis
- 5.5.1 Trade Route 1
- 5.5.2 Trade Route 2
- 5.5.3 Trade Route 3
- 5.5.4 Trade Route 4
- 5.5.5 Trade Route 5
- 5.6 Trade Policy Impact Assessment
- 5.6.1 US Anti-Dumping & Section 301 Tariffs
- 5.6.2 EU Customs Union Impact
- 5.6.3 Major Free Trade Agreements
- 5.6.4 USMCA Rules of Origin
Note: Trade policy analysis will be included only where relevant to the Deionized Water Systems market.
Chapter 6. Competitive Landscape & Company Benchmarking
- 6.1 Deionized Water Systems Market Concentration & Structure
- 6.1.1 Herfindahl-Hirschman Index (HHI) – vs. 2024
- 6.1.2 Tier 1, Tier 2 & Tier 3 Market Structure
- 6.1.3 Global, Regional & Local Player Dynamics
- 6.2 Deionized Water Systems Market Share Analysis – 2024
- 6.2.1 Global Revenue Share by Company
- 6.2.2 Global Volume Share by Company
- 6.2.3 Regional Revenue Share
- 6.2.4 Market Share Evolution ( vs. 2024)
- 6.2.5 OEM Segment Share by Company
- 6.2.6 Replacement Segment Share by Company
- 6.3 Production/Delivery Capacity & Facility Analysis
- 6.3.1 Global Installed Capacity
- 6.3.2 Capacity Utilization Rates
- 6.3.3 Production/Output Volume
- 6.3.4 Facility Locations & Capacity Map
- 6.3.5 Planned Capacity Additions
- 6.4 Deionized Water Systems Competitive Benchmarking Matrix
- 6.4.1 Revenue, Volume, CAGR & Profitability Comparison
- 6.4.2 Channel Revenue Mix
- 6.4.3 Geographic Revenue Exposure
- 6.4.4 R&D Intensity
- 6.4.5 Sustainability Maturity
- 6.5 Strategic Developments in Deionized Water Systems (Last 24 Months)
- 6.5.1 Mergers, Acquisitions & Divestments
- 6.5.2 New Deionized Water Systems Launches
- 6.5.3 Facility Expansions
- 6.5.4 Strategic Alliances, Joint Ventures & Partnerships
- 6.5.5 Distribution Expansion & Market Entry
- 6.5.6 Sustainability & ESG Initiatives
- 6.6 Competitive Strategy Mapping
- 6.6.1 Leader, Challenger, Follower & Niche Classification
- 6.6.2 Pricing Strategy Comparison
- 6.6.3 Channel Strategy Matrix
Note: Strategic developments are included based on their materiality and the availability of reliable information.
Chapter 7. Global Deionized Water Systems Market – By Distribution Channel
- 7.1 Segment Overview
- 7.1.1 Volume & Revenue Split by Channel (2024 & 2032)
- 7.1.2 Channel Mix Evolution (2024-2032)
Chapter 8. Regional Market Analysis – Global Overview
- 8.1 Global Regional Overview
- 8.1.1 Regional Volume Share
- 8.1.2 Regional Revenue Share
- 8.1.3 Regional Volume by Region
- 8.1.4 Regional Revenue by Region
- 8.1.5 Regional Forecast Through 2032
- 8.2 Cross-Regional Segment Analysis
- 8.2.1 By Distribution Channel
- 8.2.2 By Brand/Price Tier
Chapter 9. North America Deionized Water Systems Market
- 9.1 United States
- 9.2 Canada
- 9.3 Mexico
Chapter 10. Europe Deionized Water Systems Market
- 10.1 Germany
- 10.2 France
- 10.3 Italy
- 10.4 United Kingdom
- 10.5 Spain
- 10.6 Poland
- 10.7 Russia
- 10.8 Netherlands
- 10.9 Belgium
- 10.10 Sweden
- 10.11 Denmark
- 10.12 Norway
- 10.13 Rest of Europe
Chapter 11. Asia Pacific Deionized Water Systems Market
- 11.1 China
- 11.2 India
- 11.3 Japan
- 11.4 South Korea
- 11.5 Thailand
- 11.6 Indonesia
- 11.7 Vietnam
- 11.8 Malaysia
- 11.9 Australia
- 11.10 Rest of Asia Pacific
Chapter 12. Latin America Deionized Water Systems Market
- 12.1 Brazil
- 12.2 Argentina
- 12.3 Colombia
- 12.4 Chile
- 12.5 Rest of Latin America
Chapter 13. Middle East Deionized Water Systems Market
- 13.1 Saudi Arabia
- 13.2 United Arab Emirates
- 13.3 Turkey
- 13.4 Israel
- 13.5 Iran
- 13.6 Rest of the Middle East
Chapter 14. Africa Deionized Water Systems Market
- 14.1 South Africa
- 14.2 Egypt
- 14.3 Nigeria
- 14.4 Morocco
- 14.5 Rest of Africa
Chapter 15. Deionized Water Systems Company Profiles
- 15.1 [Company 01]
- 15.1.1 Company Overview
- 15.1.2 Key Management Personnel
- 15.1.3 Products & Services Portfolio
- 15.1.4 Financial Performance
- 15.1.5 Key Market Focus & Geographic Presence
- 15.1.6 Recent Developments & Strategic Initiatives
Note: The company profile list is preliminary and may change based on research findings, market developments, data availability, and client requirements.
Chapter 16. Appendices
- Appendix A – List of Abbreviations & Acronyms
- Appendix B – Industry Classification Code Reference – Full Series
- Appendix C – Production & Capacity Data Tables
- Appendix D – End-Use & Demand Base Tables
- Appendix E – Consumption & Replacement Rate Assumptions
- Appendix F – ASP Reference Tables
- Appendix G – Manufacturing & Facility Database
- Appendix H – Import-Export Data Tables
- Appendix I – Regulatory Summary Tables
- Appendix J – Primary Research Participant List (Anonymized)
- Appendix K – Primary Research Questionnaire Framework
- Appendix L – Data Sources & Bibliography
- Appendix M – Market Size Divergence & Source Comparison
Chapter 17. Research Methodology
- 17.1 Research Framework & Philosophy
- 17.2 Secondary Research – Sources, Hierarchy & Data Extraction
- 17.3 Data Modeling – Bottom-Up & Top-Down Market Sizing
- 17.4 Primary Research – Stakeholder Framework, LOI & Sample Sizes
- 17.5 Forecast Methodology – Regression, Scenario & Sensitivity Analysis
- 17.6 Quality Control – Four-Layer Validation Framework
- 17.7 Limitations & Standard Assumptions
- 17.8 Disclaimer
