Market Overview
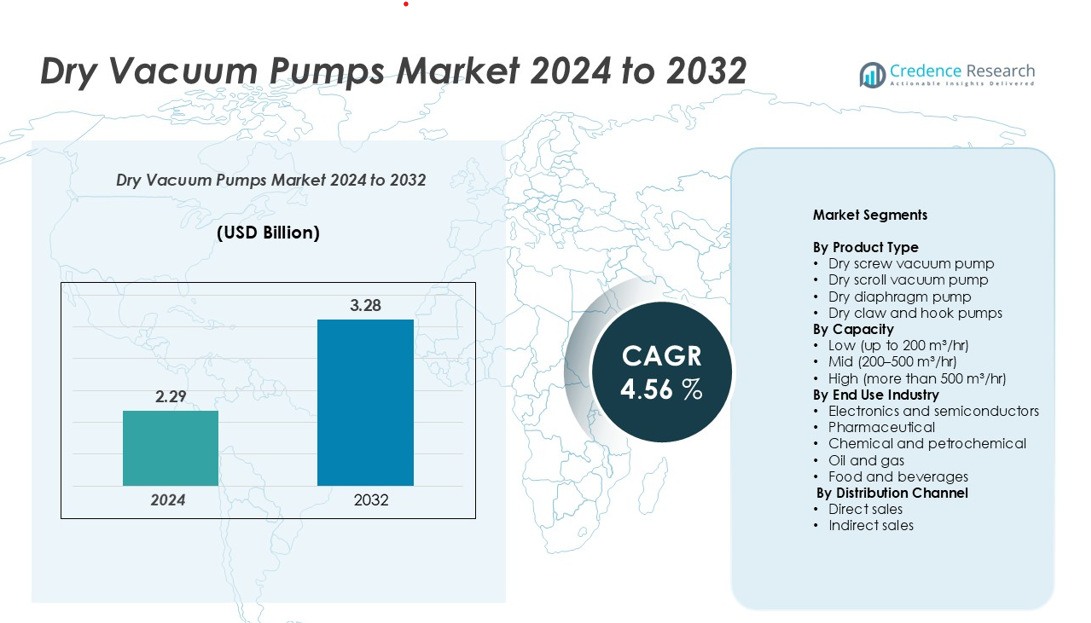
The Dry Vacuum Pumps market size was valued at USD 2.29 billion in 2024 and is anticipated to reach USD 3.28 billion by 2032, at a CAGR of 4.56% during the forecast period
| REPORT ATTRIBUTE |
DETAILS |
| Historical Period |
2020-2023 |
| Base Year |
2024 |
| Forecast Period |
2025-2032 |
| Dry Vacuum Pumps Market Size 2024 |
USD 2.29 billion |
| Dry Vacuum Pumps Market, CAGR |
4.56% |
| Dry Vacuum Pumps Market Size 2032 |
USD 3.28 billion |
The global dry vacuum pumps market is dominated by leading players such as Alfa Laval, Atlas Copco, Agilent Technologies, Edwards Vacuum, Leybold GmbH, Becker Vacuum Pumps, DEKKER Vacuum Technologies, Ebara Corporation, Flowserve Corporation, Graham Corporation, Grundfos, and KNF Neuberger. These companies leverage innovation, energy-efficient technologies, and robust after-sales service to strengthen market positions. North America leads the market with approximately 30% share, driven by advanced electronics, pharmaceutical, and chemical industries. Europe follows with around 28%, supported by automation, renewable energy, and sustainability initiatives. Asia-Pacific is the fastest-growing region, expected to capture nearly 32% of the market by 2032, fueled by rapid industrialization, semiconductor production, and expanding manufacturing infrastructure. Strategic collaborations and technological advancements among these players ensure dominance across these key regions.
Market Insights
- The dry vacuum pumps market was valued at USD 2.29 billion in 2024 and is projected to reach USD 3.28 billion by 2032, growing at a CAGR of 4.56% during the forecast period.
- Rising demand from electronics, pharmaceutical, and chemical industries is driving market growth, supported by industrial automation and expansion of manufacturing facilities globally.
- Key trends include adoption of energy-efficient and low-maintenance pumps, integration of IoT-enabled predictive maintenance, and growing focus on sustainable and green manufacturing processes.
- The competitive landscape is dominated by players such as Alfa Laval, Atlas Copco, Agilent Technologies, Edwards Vacuum, and Leybold GmbH, emphasizing innovation, strategic partnerships, and advanced product offerings to strengthen regional presence.
- Regionally, North America holds ~30% market share, Europe ~28%, Asia-Pacific ~32%, with Latin America and the Middle East & Africa sharing the remaining ~10%. Mid-capacity pumps and electronics & semiconductor end-use segments dominate the market share.
Access crucial information at unmatched prices!
Request your sample report today & start making informed decisions powered by Credence Research Inc.!
Download Sample
Market Segmentation Analysis:
By Product Type
The Dry Screw Vacuum Pump segment dominates the product type category, accounting for the largest market share due to its high efficiency, reliability, and ability to handle large volumes of gas without contamination. Dry scroll and diaphragm pumps are gaining traction in specialized applications such as laboratories and pharmaceutical production. Growing demand from electronics, chemical, and food processing industries is driving adoption, while technological advancements in energy-efficient and low-maintenance vacuum solutions further support market growth across all product types.
- For instance, Pfeiffer Vacuum’s ACP 90 SDdry screw vacuum pump delivers a maximum pumping speed of 88 m³/h and can handle up to 2,400 g/h of pure water vapor load via its gas ballast ports without performance degradation.
By Capacity
Within capacity segments, mid-capacity pumps (200–500 m³/hr) hold the largest share, driven by their versatility in industrial and commercial applications. Low-capacity units are preferred in laboratories and small-scale manufacturing, while high-capacity pumps are increasingly deployed in heavy industrial sectors such as oil and gas. Rising industrial automation, expansion of manufacturing facilities, and increased investment in semiconductor and pharmaceutical production are key factors propelling the demand for mid-range and high-capacity dry vacuum pumps globally.
- For instance, The Atlas Copco DWS-500 dry screw vacuum pump achieves a peak pumping speed of approximately 460 m³/hr and has a maximum power consumption of about 11 kW, which occurs at its peak pumping load, not under ultimate pressure conditions.
By End Use Industry
The electronics and semiconductor segment leads the market, representing the highest share due to stringent vacuum requirements in wafer processing, chip fabrication, and cleanroom operations. Pharmaceutical and chemical industries also contribute significantly, fueled by stringent regulatory standards, the need for contamination-free processes, and growing production capacities. The food and beverage and oil & gas sectors are witnessing steady growth, driven by process efficiency and safety considerations. Increasing industrial automation, expansion of production facilities, and adoption of energy-efficient vacuum solutions act as major growth drivers across all end-use industries.
Key Growth Drivers
Rising Industrial Automation and Manufacturing Expansion
The increasing adoption of industrial automation and the expansion of manufacturing facilities are driving demand for dry vacuum pumps. Industries such as electronics, pharmaceuticals, and chemicals rely on precise and contamination-free vacuum solutions for critical processes like semiconductor fabrication, drug production, and chemical processing. Automated production lines and sophisticated machinery require reliable and energy-efficient vacuum pumps to maintain operational efficiency and minimize downtime. Additionally, as emerging economies invest in industrial infrastructure, the demand for scalable vacuum solutions grows, providing manufacturers opportunities to supply both standard and high-capacity pumps. These factors collectively position dry vacuum pumps as essential components in modern industrial ecosystems, further boosting market growth.
- For instance, the semiconductor fab requires house vacuum flow rates between 2,000 and 8,000 m³/hr, with some larger facilities requiring over 12,000 m³/hr. These facilities must operate continuously (24/7), with no tolerance for failure, as unexpected downtime can be extremely costly. Reliability and redundancy are therefore crucial for the vacuum systems that support the manufacturing process.
Technological Advancements in Pump Efficiency and Sustainability
Advancements in pump technology, such as energy-efficient designs, low-maintenance operations, and eco-friendly materials, are fueling market growth. Modern dry vacuum pumps offer higher throughput with reduced energy consumption, meeting the sustainability and cost-efficiency requirements of industrial clients. Innovations like intelligent monitoring, IoT-enabled predictive maintenance, and improved sealing technologies enhance performance and reduce operational risks. As industries prioritize reducing carbon footprints and achieving regulatory compliance, these technological improvements increase adoption across various sectors. The integration of smart solutions not only enhances reliability but also attracts new end-users seeking long-term operational savings and sustainability benefits, strengthening market expansion.
- For instance, Technetics’ HELICOFLEX® metal seal installed in a semiconductor vacuum pump maintains a leakage rate ofmbar·l/sec at 200 °C in the vacuum casing, enabling more stable pressure control and extended seal life under harsh thermal conditions.
Growth in End-Use Industries such as Electronics, Pharmaceuticals, and Chemicals
The growing demand from electronics, pharmaceutical, and chemical industries acts as a critical driver for the dry vacuum pumps market. The semiconductor industry requires precise vacuum systems for chip fabrication, while pharmaceuticals depend on contamination-free pumps for drug manufacturing. Similarly, chemical processing facilities increasingly use dry vacuum pumps to ensure safety and efficiency during complex reactions. Expansion of production capacities, new plant setups, and rising global consumption of electronics and pharmaceuticals contribute to a surge in pump demand. Additionally, regulatory compliance, high process reliability, and operational efficiency requirements in these sectors further reinforce the adoption of advanced dry vacuum solutions.
Key Trends & Opportunities
Integration of IoT and Predictive Maintenance
The adoption of IoT-enabled dry vacuum pumps and predictive maintenance solutions is a prominent trend shaping the market. Connected pumps allow real-time monitoring of operational parameters such as pressure, temperature, and energy consumption, enabling predictive analytics to prevent unplanned downtime. This trend offers an opportunity for manufacturers to differentiate their products through smart solutions that enhance reliability, reduce maintenance costs, and improve operational efficiency. Industrial players increasingly prefer pumps that provide actionable insights for process optimization, creating a lucrative market for technologically advanced dry vacuum systems.
- For instance, Busch’s “O⁴O” digital service platform monitors key parameters such as oil temperature and running hours in real-time for compatible R5 series pumps like the RA and RD models.
Expansion of Renewable Energy and Green Manufacturing Applications
The rise of renewable energy and green manufacturing initiatives presents opportunities for dry vacuum pumps, particularly in solar panel production, battery manufacturing, and sustainable chemical processes. Low-emission and energy-efficient pumps are increasingly preferred to meet environmental regulations and corporate sustainability targets. Companies focusing on clean technology and eco-friendly manufacturing are likely to invest in advanced dry vacuum solutions to ensure minimal environmental impact while maintaining operational efficiency. This shift toward sustainable industrial practices is expected to create long-term growth opportunities for market participants.
- For instance, Leybold offers multiple series of dry compressing screw vacuum pumps for battery-related processes, including the DRYVAC, VARODRY, and SCREWLINE series. The pumping speeds are offered in a range, with specific models available in speeds such as 65, 210, 630, 650, 800, and 1600 m³/h.
Increasing Adoption in Emerging Economies
Emerging economies in Asia-Pacific, Latin America, and the Middle East present significant opportunities due to rapid industrialization, infrastructure expansion, and growing manufacturing hubs. Rising investments in electronics, pharmaceuticals, and chemical processing plants are driving demand for reliable vacuum solutions. Companies targeting these markets can leverage competitive pricing, localized manufacturing, and service networks to expand their footprint. Additionally, government incentives for industrial growth and modernization programs further enhance market potential, positioning emerging regions as key growth areas.
Key Challenges
High Initial Investment and Operational Costs
The high initial cost of dry vacuum pumps, coupled with maintenance and energy expenses, poses a challenge for small- and medium-sized enterprises. Advanced pumps with smart features, energy efficiency, and high capacity often require significant capital investment, limiting adoption among cost-sensitive clients. Additionally, operational costs, including electricity, maintenance, and spare parts, can further constrain demand. Manufacturers need to balance performance with affordability, while end-users may seek leasing or rental options to mitigate financial burden. Addressing cost concerns remains critical for accelerating market penetration and adoption across diverse industries.
Technological Complexity and Maintenance Requirements
Dry vacuum pumps, particularly high-capacity and precision models, involve sophisticated technology requiring skilled personnel for operation and maintenance. Inadequate technical expertise can lead to suboptimal performance, downtime, and reduced equipment lifespan, limiting adoption in certain regions. Moreover, frequent preventive maintenance and the need for specialized components can increase operational challenges for end-users. Manufacturers face pressure to provide comprehensive training, user-friendly systems, and robust after-sales support to overcome these hurdles. Simplifying operations while maintaining efficiency and reliability is crucial to mitigating this challenge.
Regional Analysis
North America
North America holds a significant share of the dry vacuum pumps market, driven by advanced manufacturing, semiconductor, and pharmaceutical industries. The U.S. and Canada lead adoption due to stringent process standards, high automation, and robust industrial infrastructure. Technological innovations, energy-efficient pumps, and a strong aftermarket services network further support market growth. Increasing investments in electronics, food processing, and chemical industries contribute to rising demand. With market share estimated at around 30%, North America remains a key hub for both standard and high-capacity dry vacuum pumps, benefiting from continuous industrial modernization and strong regulatory compliance.
Europe
Europe accounts for a major portion of the market, with approximately 28% market share, fueled by industrial automation, clean manufacturing initiatives, and renewable energy adoption. Germany, France, and the U.K. are prominent users in electronics, pharmaceuticals, and chemical sectors. The region emphasizes energy-efficient and low-maintenance vacuum solutions, aligning with stringent environmental and safety regulations. Expanding semiconductor fabs and pharmaceutical production facilities drive consistent demand. Additionally, technological advancements and government initiatives promoting sustainable industrial practices create opportunities for manufacturers to introduce advanced dry vacuum pumps with improved reliability and operational efficiency.
Asia-Pacific
Asia-Pacific is the fastest-growing region, projected to capture around 32% of the market by 2032, driven by rapid industrialization, urbanization, and rising electronics, pharmaceutical, and chemical manufacturing. China, India, Japan, and South Korea dominate demand due to expanding semiconductor and cleanroom applications. Investments in industrial automation, energy-efficient solutions, and smart manufacturing technologies boost adoption. Increasing government support for infrastructure and manufacturing expansion further accelerates market growth. The region presents significant opportunities for both local and global pump manufacturers to supply low-, mid-, and high-capacity dry vacuum pumps across diverse industries, with a focus on cost-effective and scalable solutions.
Latin America
Latin America accounts for a smaller yet growing share of the market, approximately 5%, driven by rising industrialization in Brazil, Mexico, and Argentina. Expansion of chemical, pharmaceutical, and food processing industries is fueling demand for reliable dry vacuum pumps. Market growth is supported by increasing adoption of energy-efficient and low-maintenance solutions, as companies seek operational efficiency amid rising energy costs. While infrastructure limitations and cost sensitivity pose challenges, local government incentives and modernization projects provide opportunities for pump manufacturers. The region is witnessing steady growth in industrial applications and aftermarket services, indicating long-term potential.
Middle East & Africa
The Middle East & Africa region holds around 5% market share, primarily driven by oil and gas, chemical processing, and expanding industrial sectors in the UAE, Saudi Arabia, and South Africa. Demand for high-capacity and energy-efficient dry vacuum pumps is rising to support industrial modernization and process optimization. Government initiatives focusing on industrial diversification, sustainability, and adoption of advanced manufacturing technologies create growth opportunities. However, limited skilled workforce and high initial investment may restrict rapid adoption. Despite challenges, regional investments in refining, petrochemicals, and pharmaceutical manufacturing present steady demand and long-term market potential for dry vacuum pumps.
Market Segmentations:
By Product Type
- Dry screw vacuum pump
- Dry scroll vacuum pump
- Dry diaphragm pump
- Dry claw and hook pumps
By Capacity
- Low (up to 200 m³/hr)
- Mid (200–500 m³/hr)
- High (more than 500 m³/hr)
By End Use Industry
- Electronics and semiconductors
- Pharmaceutical
- Chemical and petrochemical
- Oil and gas
- Food and beverages
By Distribution Channel
- Direct sales
- Indirect sales
By Geography
- North America
- Europe
- Germany
- France
- U.K.
- Italy
- Spain
- Rest of Europe
- Asia Pacific
- China
- Japan
- India
- South Korea
- South-east Asia
- Rest of Asia Pacific
- Latin America
- Brazil
- Mexico
- Rest of Latin America
- Middle East & Africa
- GCC Countries
- South Africa
- Rest of Middle East and Africa
Competitive Landscape
The dry vacuum pumps market is highly competitive, characterized by the presence of global and regional players offering a wide range of products across capacities, technologies, and end-use industries. Key players, including Alfa Laval, Atlas Copco, Agilent Technologies, Edwards Vacuum, Leybold GmbH, and Becker Vacuum Pumps, focus on innovation, energy-efficient designs, and advanced automation to strengthen their market position. Companies are investing in R&D to develop low-maintenance, high-performance pumps, while strategic partnerships, mergers, and acquisitions help expand geographical reach and service capabilities. Regional players also cater to niche applications and price-sensitive markets, intensifying competition. Market participants differentiate through product quality, after-sales support, and sustainable solutions. Increasing demand from electronics, pharmaceuticals, chemicals, and food processing industries encourages continuous product development, making innovation and operational excellence crucial for maintaining competitive advantage in the global dry vacuum pumps market.
Key Player Analysis
- Alfa Laval
- Atlas Copco
- Becker Vacuum Pumps
- DEKKER Vacuum Technologies
- Edwards Vacuum
- Ebara Corporation
- Flowserve Corporation
- Graham Corporation
- Grundfos
- KNF Neuberger
- Leybold GmbH
- Agilent Technologies
Recent Developments
- In February 2025, Falcon Vacuum Pumps & Systems, based in Faridabad, showcased its full product range at PrintPack India 2025. Specializing in oil-lubricated, oil-sealed, and dry vacuum pumps, along with ring blowers, the company primarily serves the printing and packaging industries.
- In November 2024, ULVAC, Inc. has introduced the Gv135 oil rotary vacuum pump, optimized for the analytical equipment industry. The pump addresses the demand for quiet operation in sensitive environments, featuring advanced noise reduction, achieving 46 dB, and enhanced oil leakage and backflow prevention. This design improves operational productivity and provides a quieter, more comfortable work environment, especially in research labs and offices.
- In August 2023, Edwards Vacuum has introduced the E2S series, a new oil-sealed rotary vane vacuum pump for low and medium vacuum use in industrial and research environments. With its compact design, it provides a high pumping speed of 90 m³/h and an ultimate vacuum of 3 x 10⁻³ mbar, improving cycle times and throughput without added energy consumption. The E2S provides easy operation, while its low-noise sintered steel bearings and continuous lubrication offer quieter operation.
Report Coverage
The research report offers an in-depth analysis based on Product Type, Capacity, End Use Industry, Distribution Channel, and Geography. It details leading market players, providing an overview of their business, product offerings, investments, revenue streams, and key applications. Additionally, the report includes insights into the competitive environment, SWOT analysis, current market trends, as well as the primary drivers and constraints. Furthermore, it discusses various factors that have driven market expansion in recent years. The report also explores market dynamics, regulatory scenarios, and technological advancements that are shaping the industry. It assesses the impact of external factors and global economic changes on market growth. Lastly, it provides strategic recommendations for new entrants and established companies to navigate the complexities of the market.
Future Outlook
- The dry vacuum pumps market is expected to witness steady growth driven by expanding industrial automation and manufacturing activities.
- Increasing adoption in semiconductor and electronics manufacturing will continue to be a major growth factor.
- Technological innovations will focus on energy efficiency, noise reduction, and smart monitoring systems.
- Demand for eco-friendly and oil-free vacuum solutions will rise due to sustainability initiatives.
- Pharmaceutical and chemical industries will expand their use of dry vacuum pumps for contamination-free production.
- Emerging economies in Asia-Pacific will offer significant opportunities for market expansion.
- Manufacturers will strengthen their presence through partnerships, mergers, and regional collaborations.
- Continuous product development will enhance pump reliability, performance, and lifespan.
- Service-based business models such as maintenance contracts and equipment leasing will gain traction.
- Increasing focus on predictive maintenance and digital control integration will shape the future competitive landscape.


